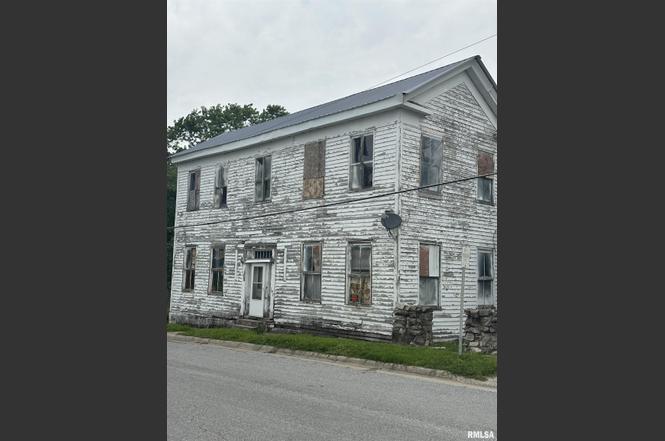
107 N Market St · Jonesboro, IL
Flood risk 1/10 · Minimal
- FEMA flood zone
- X (unshaded)
- Chance of flooding over 30 yrs
- 0.0%
- Est. flood insurance / yr
- $473 – $860
Fire risk 3/10 · Minor
- Est. fire insurance / yr
- $804 – $1,492
Heat risk 5/10 · Moderate
- Hot days now (above 107°F)
- 7 days/yr
- Hot days in 30 yrs
- 23 days/yr
Wind risk 2/10 · Minimal
- Chance of severe wind over 30 yrs
- 3.0%
Air-quality risk 1/10 · Minimal
- Unhealthy air days now
- 0 days/yr
- Unhealthy air days in 30 yrs
- 0 days/yr
Risk factors via First Street. Map © Google.
Why this score? — see what drove the B grade
The composite is a weighted blend of 9 inputs, each scored 0–100. Each bar is that input's sub-score; the figure is the points it added to the 100-point composite (weight × sub-score).
- Cash flow +30.0/30.0
- 1% rule +10.0/10.0
- DSCR +10.0/10.0
- ARV discount +7.5/15.0
- Appreciation +5.1/10.0
- Schools +4.0/10.0
- Livability +3.2/5.0
- Rent growth +2.5/5.0
- Condition / age +2.5/5.0
$34,000
🖨 Deal sheet (PDF) 📄 Offer letter ✓ Due diligence
Listing remarks
COME CHECK OUT THIS HISTORIC BUILDING NESTLED JUST OF THE JONESBORO SQUARE. YOUR IMAGINATION AND WORK ETHIC CAN RESTORE THIS HOME TO A LIVABLE AND LOVELY HOME. WE WERE TOLD THIS WAS ONCE A HOTEL IN THE EARLY 1900'S. CALL TODAY TO SCHEDULE YOUR PRIVATE SHOWING.
Key facts
- 4,356 sq ft lot
- Parking
- Built 1891
Property features AI
Exterior
- Parking: Alley access for parking (no garage)
- Utilities: Public water; Public sewer
- Home design: Single family residence; Built in 1891; Metal roof
- Construction: Total building area 2776; Not new construction
- Exterior features: Level lot; Paved road access
Interior
- Kitchen: No appliances listed
- Bedrooms: 3 bedrooms (one on main level, others on upper level)
- Flooring: Laminate flooring in several bedrooms; Hardwood in living room; Vinyl in kitchen; Other flooring in family room
- Bathrooms: 2 full bathrooms
- Heating & cooling: No heating listed
- Interior features: Non-functional fireplace; Partial, unfinished basement
- Laundry & utility: No laundry appliances listed
Neighborhood map
What this means for you Summary
Snapshot
- This is a 3-bed/2.0-bath other listed at $34k.
Deal economics
- At list price, monthly cash flow is $759 ($9k/yr) — positive.
- The deal already cash-flows at list — no discount required.
- Meets the 1% rule at list price ($1k rent vs $34k).
- Recommended offer: $30k (12.0% below list) — sets the bar for market timing.
Location & tenants
- Location reads 64/100 on livability (#699 in IL) — a middle-class / working-renter tenant base. Strengths: crime A+, cost of living A+, housing A+; Watch: amenities F, commute F, employment D-.
- County Of Union School District No43 (town): math 36% / reading 55% proficiency, ranked #246 of 919 in IL (top 27%) — families likely to look elsewhere, expect single-tenant / working-renter base with shorter leases.
- Zoned schools: Jonesboro Elem School (reading 24%, 341 students, 0% FRL) — zoned schools average 0% FRL vs 50% district-wide (50 pts lower); this property's tenant base skews higher-income than the district average.
- Market conditions: 21 active listings in the ZIP; 10 units permitted in Union County in 2024 (0 in 5+ unit buildings).
Forward outlook
- In year one you build about $330 of equity ($235 loan paydown + $95 appreciation (0.3% local appreciation)).
- Union County population projected at -18% by 2050 — secular population decline; favor cash flow + early exit over multi-decade hold.
- At projected returns (0.3% appreciation + 3.0% rent growth), your $10k cash investment doubles in ~2 years — after that, you're playing with house money.
Negotiation context
- It's been on market 150 days — a 12% lower offer ($30k) is reasonable based on typical stale-listing flexibility.
- 5 sale attempts; this cycle's ask has dropped $11k (24%) from the opening price — seller is motivated, your offer sets the floor, not the list.
Risks & watch-outs
- Watch-outs: built in 1891 — expect roof / HVAC / electrical / plumbing capex.
- Climate carrying-cost: extreme-heat days projected 7→23/yr by 2055 (HVAC capex compounding) — expect insurance premiums to compound above CPI over the hold.
Questions for the listing agent
- It's been on market 150 days. Have you received any prior offers? Is the seller open to a 12% concession, seller financing, or rate buy-down credit?
- Built in 1891 — when were the roof, HVAC, electrical panel, plumbing, and water heater last replaced?
- Why hasn't it sold? Are there any deal-killer items the seller is aware of (foundation, flood, title, zoning, code violations)?
- Is there a deadline driving the sale (1031 exchange, divorce, estate, relocation)? That informs how much negotiation room exists.
- Schools are D-rated, which usually means shorter tenancies and higher turnover. Who's the typical renter profile here, and what's been the actual vacancy rate?
- What's the average days-on-market for RENTAL listings here right now (not sales)? A rising rental-DOM trend means longer vacancies and softer asking-rent achievability than the comps imply.
- What's the recent tenant-quality profile in this submarket — average credit score on applications, eviction rate, late-payment / NSF rate, and stable-employment percentage? A property-management company in the area should have these aggregated.
- How much new for-sale + rental construction is in the pipeline within 1–3 miles? Heavy new supply typically softens prices + rents 12–24 months out; constrained supply supports both.
Investment metrics
- 1% rule
- 3.76% ✓
- Cap rate
- 33.07%
- Cash-on-cash
- 95.62%
- DSCR
- 5.25
- GRM
- 2.2
CMA / ARV
No comps found within radius.
Projected returns pro-forma
0.28% appreciation · 3.0% rent growth · sell at horizon
- IRR
- 98.3%
- Equity multiple
- 6.02×
- Total profit
- $47,801
- Equity at exit
- $10,351
- IRR
- 99.3%
- Equity multiple
- 12.44×
- Total profit
- $108,934
- Equity at exit
- $12,831
Cash invested: $9,520 (down + closing). Projections, not guarantees.
Landlord ↔ Tenant lean methodology
- Overall (STATE)
- 43 Moderately Tenant-Leaning
- State Illinois
- 43 Moderately Tenant-Leaning · D+7
- County
- — inherits STATE
- City
- — inherits STATE
ZIP-level market 62952
- Home prices YoY
- 0.3%
- Active inventory
- 21
- Price-to-rent
- 2.2×
Monthly cashflow live
- Estimated rent
- $1,278 medium interval (Pro) →
- Mortgage (P&I)
- −$178
- Tax from tax record
- −$59 /mo · $704/yr
- Insurance
- −$14
- HOA
- −$0
- Vacancy / Maint / Mgmt
- −$268
- Net cashflow
- $759
Break-even live
Sensitivity live
| Price | -10% $778 | -5% $768 | +0% $759 | +5% $749 | +10% $739 |
|---|---|---|---|---|---|
| Rent | -10% $658 | -5% $708 | +0% $759 | +5% $809 | +10% $860 |
| Rate | -1.0pp $776 | -0.5pp $767 | base $759 | +0.5pp $750 | +1.0pp $741 |
UW: 25.0% down · 7.5% · 30yr · 1.5% tax · 5.0% vac · 8.0% maint · 8.0% mgmt
Financing live
Cash to close
- Down payment
- $8,500
- Closing costs
- $1,020
- Reserves months
- —
- Total cash needed
- —
Loan-product check · same deal, 3 products live
Conventional
25% down · 7.5% · 30yr
- Down + closing
- —
- Monthly P&I
- —
- Monthly cashflow
- —
- DSCR
- —
- Eligible?
- —
Personal DTI + credit; lowest rate.
DSCR
20% down · 8.5% · 30yr
- Down + closing
- —
- Monthly P&I
- —
- Monthly cashflow
- —
- DSCR
- —
- Eligible?
- —
No personal income docs; deal must DSCR.
Hard money
10% down · 12.0% · 12mo
- Down + closing
- —
- Monthly P&I
- —
- Monthly cashflow
- —
- DSCR
- —
- Eligible?
- —
Short-term bridge; refi at stabilization.
Listing history 28 events
-
2026-06-21days on market $34,000 Active 150 DOM
-
2026-06-18days on market $34,000 Active 148 DOM
-
2026-06-17days on market $34,000 Active 147 DOM
-
2026-06-16days on market $34,000 Active 146 DOM
-
2026-06-15days on market $34,000 Active 145 DOM
-
2026-06-13days on market $34,000 Active 143 DOM
-
2026-06-12days on market $34,000 Active 142 DOM
-
2026-06-09days on market $34,000 Active 139 DOM
-
2026-06-08days on market $34,000 Active 138 DOM
-
2026-06-07days on market $34,000 Active 137 DOM
-
2026-06-07days on market $34,000 Active 136 DOM
-
2026-06-04days on market $34,000 Active 133 DOM
-
2026-06-02days on market $34,000 Active 132 DOM
-
2026-06-01days on market $34,000 Active 131 DOM
-
2026-05-31days on market $34,000 Active 130 DOM
-
2026-05-31days on market $34,000 Active 129 DOM
-
2026-05-24status Active
-
2026-05-23status Active
-
2026-04-26price $34,900
-
2026-01-28historical
-
2026-01-28historical
-
2026-01-28historical
-
2026-01-08status Active
-
2026-01-06historical
-
2026-01-05historical
-
2025-11-27$45,000 Active
-
2025-09-01price
-
2025-06-28Active
ⓘ Source: listings_history table (triggers on properties + properties_extension) + one-shot
backfill from property_details.listing_events for pre-trigger history.
Tax reassessment forecast IL · Partial reset (capped growth)
- Current annual tax
- $704 · $59/mo
- Projected year-2 tax
- $738 · $62/mo
- Expected delta
- +$34/yr (+$3/mo · 4.8%)
ⓘ Screening estimate from a state-policy table — verify with the county assessor before closing.
Climate risk First Street
- Flood 1/10 Low FEMA zone X (unshaded) · 0% chance over 30 yrs
- Wildfire 3/10 Moderate
- Heat 5/10 Major 7 d/yr ≥107°F today · 23 d/yr by 30 yrs out
- Wind 2/10 Low 3% chance of damaging wind over 30 yrs
- Air quality 1/10 Low 0 unhealthy d/yr today · 0 by 30 yrs out
Nearby sold comps map
Loading sold comps map…
Walkable amenities ~0.75 mi
Loading nearby amenities…
Taxation est. · year 1
- Rental income
- $15,339
- − Mortgage interest
- −$1,905
- − Property taxes
- −$704
- − Insurance
- −$170
- − Repairs & maintenance
- −$1,227
- − Management
- −$1,227
- − Depreciation
- −$989
- Taxable income
- $9,116
- Est. tax owed @ 24.0%
- −$2,188
- After-tax cash flow
- $6,916/yr
For passive investors: Depreciation is non-cash, so a rental often shows a tax loss while cash-flowing — sheltering income. Rental losses are passive: they offset passive income freely, and up to $25,000/yr can offset ordinary (W-2) income if you actively participate and your MAGI is under $100k (phasing out to $0 by $150k); unused losses carry forward. On sale, claimed depreciation is recaptured at up to 25%, and gains may owe capital-gains tax (a 1031 exchange can defer both). Figures are a year-1 estimate at your 24.0% rate — not tax advice; consult a CPA.
Schools (NCES district)
- District
- County Of Union School District No43
- NCES district ID
- 1720640
- Math proficiency
- 36% ▲ 1.00%
- Reading proficiency
- 55% ▲ 13.00%
- Median HH income
- $39,283
- Composite
- 40.19/100
- National rank
- #7824
- State rank
- #246 of 919 in IL
Livability — Jonesboro
- Score
- 64/100
- State rank
- #699
- US rank
- #14279
Category grades
Schools grade is shown separately in the Schools card above.
Census & demographics
- Census place
- Jonesboro, IL
- Population (ZIP)
- 2,950
Population outlook (Union County) Hauer SSP2
- Today (2025)
- 16,606 people
- By 2030
- 16,055 · -3.3%
- By 2040
- 14,875 · -10.4%
- By 2050
- 13,645 · -17.8%
- By 2075
- 10,704 · -35.5%
- By 2100
- 7,880 · -52.5%
Race, ethnicity, and origin ACS 2023
- Neighborhood character
- Predominantly White (87%)
- Race & ethnicity
- White 87% Two or more races 10% Black 1%
- Common ancestry
- Romanian 1% Slovak 1% Lithuanian 1%
- Foreign-born
- 0%
- Languages at home
- 99% English-only · Spanish 1%
Political lean MEDSL · Union
- 2024 margin
- Solid R (+43.2) · D 27.8% · R 71.0% · Other 1.2%
- 2008→2024 swing
- -31.3pp toward R · 2008: -11.9pp · 2024: -43.2pp
- All cycles
- 2024: R+43.2 2020: R+40.2 2016: R+39.8 2012: R+21.9 2008: R+11.9
Not yet ingested
- Civics
- —
Market trends
- HPI YoY
- ▲ 0.28%
- Current HPI
- 106.3031
- Rent YoY
- —
- Metro
- —
- State GDP YoY
- ▲ 1.59%
- F500 in state
- 60
Industry mix (Fortune 500 HQ in IL)
| Industry | F500 HQs | Revenue |
|---|---|---|
| Insurance | 4 | $201B |
|
||
| Consumer Goods | 4 | $87B |
|
||
| Industrial Machinery | 3 | $64B |
|
||
| Healthcare | 2 | $55B |
|
||
| Retail / Pharmacy | 1 | $148B |
|
||
| Agriculture / Food | 1 | $86B |
|
||
Price history
-22.4% since first listed12 events — show timeline
- 2026-05-24 Relisted — MRED as Distributed by MLS Grid
- 2026-05-23 Relisted — MRED as Distributed by MLS Grid
- 2026-04-26 Price Changed $34,900 RMLSA as Distributed by MLS Grid
- 2026-01-28 Listing Removed — MRED as Distributed by MLS Grid
- 2026-01-28 Listing Removed — MRED as Distributed by MLS Grid
- 2026-01-28 Listing Removed — MRED as Distributed by MLS Grid
- 2026-01-08 Relisted — MRED as Distributed by MLS Grid
- 2026-01-06 Listing Removed — RMLSA as Distributed by MLS Grid
- 2026-01-05 Listing Removed — MRED as Distributed by MLS Grid
- 2025-11-27 Listed $45,000 RMLSA as Distributed by MLS Grid
- 2025-09-01 Price Changed — RMLSA as Distributed by MLS Grid
- 2025-06-28 Listed — RMLSA as Distributed by MLS Grid
Property tax history
+45.0%/yrLatest (2024): $704 · +11.2% YoY. Source: county tax records.
Cash-flow waterfall
monthlySold comps — $/sqft
last 12 mo · ≤1 miLoading sold comps…