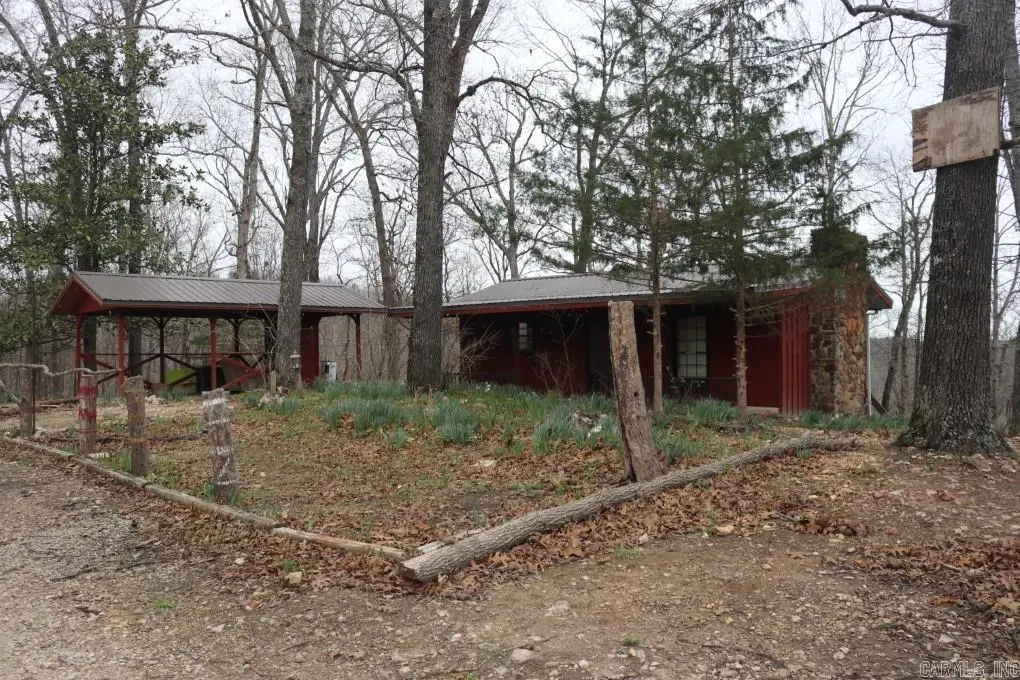
826 Crooked Ridge Rd · Fifty-Six, AR
Flood risk 1/10 · Minimal
- FEMA flood zone
- X
- Chance of flooding over 30 yrs
- 0.0%
- Est. flood insurance / yr
- $473 – $860
Fire risk 5/10 · Moderate
- Est. fire insurance / yr
- $1,499 – $2,785
Heat risk 4/10 · Minor
- Hot days now (above 107°F)
- 7 days/yr
- Hot days in 30 yrs
- 19 days/yr
Wind risk 2/10 · Minimal
- Chance of severe wind over 30 yrs
- 2.0%
Air-quality risk 1/10 · Minimal
- Unhealthy air days now
- 0 days/yr
- Unhealthy air days in 30 yrs
- 0 days/yr
Risk factors via First Street. Map © Google.
Why this score? — see what drove the C+ grade
The composite is a weighted blend of 9 inputs, each scored 0–100. Each bar is that input's sub-score; the figure is the points it added to the 100-point composite (weight × sub-score).
- Cash flow +28.3/30.0
- DSCR +10.0/10.0
- ARV discount +8.9/15.0
- 1% rule +6.8/10.0
- Schools +3.1/10.0
- Rent growth +2.5/5.0
- Livability +2.5/5.0
- Condition / age +2.5/5.0
- Appreciation +0.0/10.0
$79,000
🖨 Deal sheet 📄 Offer letter ✓ Due diligence
Listing remarks
This 1 bed, 2 bath cabin offers a solid foundation and rustic charm, ready for your personal touch. With a little TLC, you can transform this into the perfect cozy escape. Property Highlights: 8.68 acres of scenic, wooded land Gas log fireplace for those cozy mountain evenings 1 bedroom, 2 bathrooms Carport & back deck for relaxing and entertaining Rare spring water source – hard to find and highly desirable Abundant wildlife – perfect for hunters and nature lovers Ideally located just one parcel away from the Ozark National Forest and only 15 minutes from the stunning Blanchard Springs Caverns. If you’ve been dreaming of owning a slice of the Ozarks, this i
Key facts
- Carport
- Abundant wildlife
- Gas log fireplace
Tags
Property features AI
Exterior
- Parking: Carport
- Utilities: Septic system
- Home design: Single-family property
- Construction: Wood exterior; Metal roof; Slab foundation
- Exterior features: Wooded lot with mountain views; Year-round spring on the property; Gravel road access
Interior
- Flooring: Wood flooring; Vinyl flooring
- Bathrooms: 2 full bathrooms
- Heating & cooling: Window air conditioning units
- Interior features: Wood and vinyl floors; Gas log fireplace; Basement
Neighborhood map
What this means for you Summary
Snapshot
- This is a 1-bed/1.0-bath single-family listed at $79k.
Deal economics
- At list price, monthly cash flow is $252 ($3k/yr) — positive.
- The deal already cash-flows at list — no discount required.
- Meets the 1% rule at list price ($933 rent vs $79k).
- Recommended offer: $78k (1.5% below list) — sets the bar for market timing.
Location & tenants
- Location reads: area grade C — affects rentability + tenant quality, not the cash-flow math above.
- Mountain View School District (rural): math 34% / reading 41% proficiency, ranked #107 of 238 in AR (top 45%) — families likely to look elsewhere, expect single-tenant / working-renter base with shorter leases.
- Market conditions: 164 active listings in the ZIP; 2 units permitted in Stone County in 2024 (0 in 5+ unit buildings).
Forward outlook
- Local home prices are declining (-3.0%/yr); year-one equity from $546 of loan paydown is wiped out by about $2k of value loss. Plan a longer hold.
- Stone County population projected to shrink 6% by 2050 — rents likely to lag national; underwrite the cash flow, not the appreciation.
- At projected returns (-3.0% appreciation + 3.0% rent growth), your $22k cash investment doubles in ~9 years — after that, you're playing with house money.
Negotiation context
- It's been on market 21 days — a 2% lower offer ($78k) is reasonable based on typical stale-listing flexibility.
- Current owner paid $45k; list at $79k implies a 76% gain — meaningful room to come down on a strong offer.
Risks & watch-outs
- Climate carrying-cost: moderate wildfire risk — expect insurance premiums to compound above CPI over the hold.
Questions for the listing agent
- Is there a deadline driving the sale (1031 exchange, divorce, estate, relocation)? That informs how much negotiation room exists.
- What's the average days-on-market for RENTAL listings here right now (not sales)? A rising rental-DOM trend means longer vacancies and softer asking-rent achievability than the comps imply.
- What's the recent tenant-quality profile in this submarket — average credit score on applications, eviction rate, late-payment / NSF rate, and stable-employment percentage? A property-management company in the area should have these aggregated.
- How much new for-sale + rental construction is in the pipeline within 1–3 miles? Heavy new supply typically softens prices + rents 12–24 months out; constrained supply supports both.
Investment metrics
- 1% rule
- 1.18% ✓
- Cap rate
- 10.13%
- Cash-on-cash
- 13.69%
- DSCR
- 1.61
- GRM
- 7.1
CMA / ARV
- ARV (on-the-fly)
- $81,466
- Comps found
- 1
Show comp detail 1 sale within ~0.75 mi
| Address | Dist | Beds/Ba | Sqft | Sold | Price | $/sf | Match |
|---|---|---|---|---|---|---|---|
| 826 Crooked Ridge Rd | 0.00mi | 1/2.0 | 1,058 (0%) | 1mo | $81,000 | $77 | 95 |
Match score weights: distance 35% · size 25% · config 20% · recency 20%. Top-matched comps best support the ARV.
Projected returns pro-forma
-3.0% appreciation · 3.0% rent growth · sell at horizon
- IRR
- 3.8%
- Equity multiple
- 1.15×
- Total profit
- $3,246
- Equity at exit
- $11,779
- IRR
- 13.3%
- Equity multiple
- 2.06×
- Total profit
- $23,424
- Equity at exit
- $6,830
Cash invested: $22,120 (down + closing). Projections, not guarantees.
Landlord ↔ Tenant lean methodology
- Overall (STATE)
- 92 Strongly Landlord-Friendly
- State Arkansas
- 92 Strongly Landlord-Friendly · R+14
- County
- — inherits STATE
- City
- — inherits STATE
ZIP-level market 72560
- Home prices YoY
- -23.2%
- Active inventory
- 164
- Price-to-rent
- 7.1×
Monthly cashflow live
- Estimated rent
- $933 medium interval (Pro) →
- Mortgage (P&I)
- −$414
- Tax from tax record
- −$37 /mo · $449/yr
- Insurance
- −$33
- HOA
- −$0
- Vacancy / Maint / Mgmt
- −$196
- Net cashflow
- $252
Break-even live
UW: 25.0% down · 7.5% · 30yr · 1.5% tax · 5.0% vac · 8.0% maint · 8.0% mgmt
Financing live
Cash to close
- Down payment
- $19,750
- Closing costs
- $2,370
- Reserves months
- —
- Total cash needed
- —
Loan-product check · same deal, 3 products live
Conventional
25% down · 7.5% · 30yr
- Down + closing
- —
- Monthly P&I
- —
- Monthly cashflow
- —
- DSCR
- —
- Eligible?
- —
Personal DTI + credit; lowest rate.
DSCR
20% down · 8.5% · 30yr
- Down + closing
- —
- Monthly P&I
- —
- Monthly cashflow
- —
- DSCR
- —
- Eligible?
- —
No personal income docs; deal must DSCR.
Hard money
10% down · 12.0% · 12mo
- Down + closing
- —
- Monthly P&I
- —
- Monthly cashflow
- —
- DSCR
- —
- Eligible?
- —
Short-term bridge; refi at stabilization.
Listing history 3 events
-
2026-04-10status Under Contract
-
2026-03-20$79,000 New Listing
-
2005-03-22soldstatus $45,000
ⓘ Source: listings_history table (triggers on properties + properties_extension) + one-shot
backfill from property_details.listing_events for pre-trigger history.
Tax reassessment forecast AR · Resets to sale price
- Current annual tax
- $449 · $37/mo
- Projected year-2 tax
- $506 · $42/mo
- Expected delta
- +$56/yr (+$5/mo · 12.5%)
ⓘ Screening estimate from a state-policy table — verify with the county assessor before closing.
Climate risk First Street
- Flood 1/10 Low FEMA zone X · 0% chance over 30 yrs
- Wildfire 5/10 Major
- Heat 4/10 Moderate 7 d/yr ≥107°F today · 19 d/yr by 30 yrs out
- Wind 2/10 Low 2% chance of damaging wind over 30 yrs
- Air quality 1/10 Low 0 unhealthy d/yr today · 0 by 30 yrs out
Nearby sold comps map
Loading sold comps map…
Walkable amenities ~0.75 mi
Loading nearby amenities…
Taxation est. · year 1
- Rental income
- $11,195
- − Mortgage interest
- −$4,425
- − Property taxes
- −$449
- − Insurance
- −$395
- − Repairs & maintenance
- −$896
- − Management
- −$896
- − Depreciation
- −$2,298
- Taxable income
- $1,836
- Est. tax owed @ 24.0%
- −$441
- After-tax cash flow
- $2,587/yr
For passive investors: Depreciation is non-cash, so a rental often shows a tax loss while cash-flowing — sheltering income. Rental losses are passive: they offset passive income freely, and up to $25,000/yr can offset ordinary (W-2) income if you actively participate and your MAGI is under $100k (phasing out to $0 by $150k); unused losses carry forward. On sale, claimed depreciation is recaptured at up to 25%, and gains may owe capital-gains tax (a 1031 exchange can defer both). Figures are a year-1 estimate at your 24.0% rate — not tax advice; consult a CPA.
Schools (NCES district)
- District
- Mountain View School District
- NCES district ID
- 0510200
- Math proficiency
- 34% ▼ -20.00%
- Reading proficiency
- 41% ▼ -13.00%
- Median HH income
- $31,281
- Composite
- 30.61/100
- National rank
- #6192
- State rank
- #107 of 238 in AR
Livability — Fifty-Six
No livability data for this city. (Only ~50 U.S. cities are tracked.)
Census & demographics
- City population
- 7,650
- Population (ZIP)
- 7,650
Population outlook (Stone County) Hauer SSP2
- Today (2025)
- 12,440 people
- By 2030
- 12,372 · -0.5%
- By 2040
- 12,081 · -2.9%
- By 2050
- 11,628 · -6.5%
- By 2075
- 10,863 · -12.7%
- By 2100
- 9,420 · -24.3%
Race, ethnicity, and origin ACS 2023
- Neighborhood character
- Predominantly White (89%)
- Race & ethnicity
- White 89% Two or more races 6% Hispanic / Latino 3% Native American 1%
- Common ancestry
- Slovak 4% Iranian 3% Lithuanian 1%
- Foreign-born
- 1% · Canada
- Languages at home
- 97% English-only · German/W. Germanic 2% Spanish 1%
Political lean MEDSL · Stone
- 2024 margin
- Solid R (+61.7) · D 18.1% · R 79.7% · Other 2.2%
- 2008→2024 swing
- -25.3pp toward R · 2008: -36.4pp · 2024: -61.7pp
- All cycles
- 2024: R+61.7 2020: R+57.9 2016: R+52.3 2012: R+45.2 2008: R+36.4
Not yet ingested
- Civics
- —
Market trends
- HPI YoY
- ▼ -48.20%
- Current HPI
- 159.8996
- Rent YoY
- —
- Metro
- —
- State GDP YoY
- ▲ 3.80%
- F500 in state
- 10
Industry mix (Fortune 500 HQ in AR)
| Industry | F500 HQs | Revenue |
|---|---|---|
| Retail | 1 | $681B |
|
||
| Food / Agriculture | 1 | $53B |
|
||
| Retail / Energy | 1 | $22B |
|
||
| Transportation / Logistics | 1 | $12B |
|
||
| Energy | 1 | $4B |
|
||
Price history
+75.6% since first listed3 events — show timeline
- 2026-04-10 Pending — CARMLS
- 2026-03-20 Listed $79,000 CARMLS
- 2005-03-22 Sold (Public Records) $45,000 Public Records
Property tax history
+1.0%/yrLatest (2025): $449 · +0.0% YoY. Source: county tax records.
Cash-flow waterfall
monthlySold comps — $/sqft
last 12 mo · ≤1 miLoading sold comps…