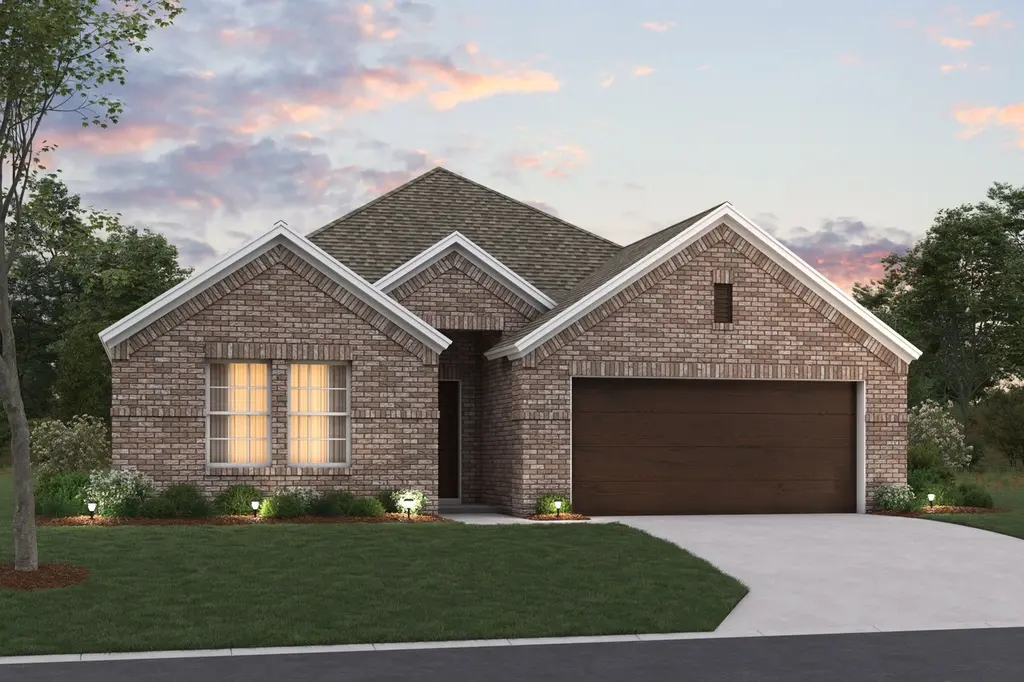
116 Biscayne Ln · Royse City, TX
Flood risk No data
- FEMA flood zone
- —
- Chance of flooding over 30 yrs
- —
- Est. flood insurance / yr
- —
Fire risk No data
- Est. fire insurance / yr
- —
Heat risk No data
- Hot days now (above threshold)
- —
- Hot days in 30 yrs
- —
Wind risk No data
- Chance of severe wind over 30 yrs
- —
Air-quality risk No data
- Unhealthy air days now
- —
- Unhealthy air days in 30 yrs
- —
Risk factors via First Street. Map © Google.
Why this score? — see what drove the D grade
The composite is a weighted blend of 9 inputs, each scored 0–100. Each bar is that input's sub-score; the figure is the points it added to the 100-point composite (weight × sub-score).
- ARV discount +10.7/15.0
- Cash flow +10.3/30.0
- Condition / age +4.0/5.0
- Schools +3.8/10.0
- Livability +3.8/5.0
- 1% rule +3.1/10.0
- DSCR +3.0/10.0
- Rent growth +2.2/5.0
- Appreciation +0.0/10.0
$310,000
🖨 Deal sheet (PDF) 📄 Offer letter ✓ Due diligence
Listing remarks
Welcome to 116 Biscayne Lane, Royse City, Texas — a beautifully crafted new construction single-story home built by M/I Homes. This 2,106 square feet home offers 4 bedrooms and 3 bathrooms, designed with quality and functionality in mind. Step inside to discover an open-concept living space that creates a seamless flow between the main living areas, ideal for both everyday living and entertaining. The thoughtful floorplan maximizes space throughout, ensuring each room serves a purpose while maintaining a cohesive design. Key features of this home include: 4 spacious bedrooms and 3 full bathrooms Single-story layout with 2,106 square feet of living space Open-concept living space w
Key facts
- Large kitchen island
- Open concept design
- Spacious foyer
Tags
Neighborhood map
What this means for you Summary
Snapshot
- This is a 4-bed/3.0-bath single-family listed at $310k. Condition is rated good.
Deal economics
- At list price, monthly cash flow is $-168 ($-2k/yr) — negative.
- To cash-flow at today's rent, offer at most $286k (7.9% below list).
- To meet the 1% rule (rent ≥ 1% of price), the offer needs to be $250k (19.4% below list).
- Recommended offer: $250k (19.4% below list) — sets the bar for 1% rule.
- Cap rate 5.6% vs local median 4.2% in Royse City — top-decile yield for the area; either an underpriced asset or a hidden risk that comps aren't pricing in. Stress-test before assuming the spread holds.
Location & tenants
- Location reads 75/100 on livability (#158 in TX, #4,292 nationally) — a middle-class / working-renter tenant base. Strengths: crime A+, employment A+, housing A+; Watch: amenities F, commute F.
- Royse City ISD (rural): math 42% / reading 42% proficiency, ranked #266 of 826 in TX (top 32%) — families likely to look elsewhere, expect single-tenant / working-renter base with shorter leases.
- Zoned schools: Davis El (math 52% / reading 41%, grade D-, #1,080 of 4,322 statewide, top 25%, 500 students, 52% FRL); Ouida Baley Middle (math 32% / reading 35%, grade F, #911 of 1,662 statewide, top 56%, 934 students, 43% FRL); Royse City H S (math 38% / reading 55%, grade D-, #621 of 1,632 statewide, top 38%, 2,526 students, 37% FRL).
- Market conditions: Rents soft (-1.1%/yr); 1301 active listings in the ZIP; 40 comparable units currently listed for rent nearby; rentals at typical pace (median 16d on market — plan ~3-4 weeks tenant-placement turnaround); high-income renter base; 1,289 units permitted in Hunt County in 2024 (527 in 5+ unit buildings).
Forward outlook
- Local home prices are declining (-3.0%/yr); year-one equity from $2k of loan paydown is wiped out by about $9k of value loss. Plan a longer hold.
- Hunt County population projected at +15% by 2050 — modest demand growth; plan on rents tracking national, not racing it.
Negotiation context
- It's been on market 39 days — a 3% lower offer ($301k) is reasonable based on typical stale-listing flexibility.
Questions for the listing agent
- What do current leases actually rent for vs. the listed asking? Can we see a recent rent roll and the last 12 months of T-12 income?
- It's been on market 39 days. Have you received any prior offers? Is the seller open to a 19% concession, seller financing, or rate buy-down credit?
- Is there a deadline driving the sale (1031 exchange, divorce, estate, relocation)? That informs how much negotiation room exists.
- The area grade is low — what's the realistic commute time and amenity access for the typical tenant pool here? Any planned neighborhood developments (good or bad) we should know about?
- What's the average days-on-market for RENTAL listings here right now (not sales)? A rising rental-DOM trend means longer vacancies and softer asking-rent achievability than the comps imply.
- What's the recent tenant-quality profile in this submarket — average credit score on applications, eviction rate, late-payment / NSF rate, and stable-employment percentage? A property-management company in the area should have these aggregated.
- How much new for-sale + rental construction is in the pipeline within 1–3 miles? Heavy new supply typically softens prices + rents 12–24 months out; constrained supply supports both.
Investment metrics
- 1% rule
- 0.81% ✗
- Cap rate
- 5.64%
- Cash-on-cash
- -2.33%
- DSCR
- 0.90
- GRM
- 10.3
CMA / ARV
- ARV (median comp)
- $333,826
- List price
- $310,000
- Delta
- -7.14%
- Verdict
- FAIR
- Comps
- 20 within 1.0 mi
Show comp detail 12 sales within ~0.75 mi
| Address | Dist | Beds/Ba | Sqft | Sold | Price | $/sf | Match |
|---|---|---|---|---|---|---|---|
| 1509 Etosha Dr | 0.08mi | 4/3.0 | 2,106 (0%) | 2mo | $304,990 | $145 | 94 |
| 1705 Gulin St | 0.13mi | 4/3.0 | 2,106 (0%) | 0mo | $343,839 | $163 | 94 |
| 1617 Gulin St | 0.12mi | 4/2.0 | 2,106 (0%) | 2mo | $309,990 | $147 | 89 |
| 1501 Gulin St | 0.14mi | 4/2.0 | 2,106 (0%) | 1mo | $334,990 | $159 | 89 |
| 1609 Rushpea Dr | 0.07mi | 4/3.0 | 2,184 (+4%) | 2mo | $309,990 | $142 | 88 |
| 1712 Gulin St | 0.16mi | 4/2.0 | 2,106 (0%) | 2mo | $323,990 | $154 | 87 |
| 1604 Etosha Dr | 0.09mi | 4/2.0 | 2,010 (-5%) | 2mo | $303,990 | $151 | 83 |
| 1613 Gulin St | 0.12mi | 4/2.0 | 2,010 (-5%) | 1mo | $304,990 | $152 | 82 |
| 1600 Etosha Dr | 0.09mi | 4/2.0 | 1,898 (-10%) | 1mo | $297,990 | $157 | 75 |
| 2908 Goodrich St | 0.43mi | 4/2.0 | 2,086 (-1%) | 2mo | $300,000 | $144 | 73 |
| 1616 Gulin St | 0.15mi | 4/2.0 | 1,877 (-11%) | 0mo | $323,934 | $173 | 71 |
| 2940 Lawson Dr | 0.36mi | 5/2.0 (+1) | 2,012 (-4%) | 2mo | $221,000 | $110 | 65 |
Match score weights: distance 35% · size 25% · config 20% · recency 20%. Top-matched comps best support the ARV.
Projected returns pro-forma
-3.0% appreciation · 0.0% rent growth · sell at horizon
- IRR
- -23.6%
- Equity multiple
- 0.21×
- Total profit
- $-68,237
- Equity at exit
- $46,222
- IRR
- -29.5%
- Equity multiple
- -0.17×
- Total profit
- $-101,368
- Equity at exit
- $26,803
Cash invested: $86,800 (down + closing). Projections, not guarantees.
Landlord ↔ Tenant lean methodology
- Overall (STATE)
- 87 Strongly Landlord-Friendly
- State Texas
- 87 Strongly Landlord-Friendly · R+5
- County
- — inherits STATE
- City
- — inherits STATE
ZIP-level market 75189
- Home prices YoY
- -25.0%
- Rents YoY
- -1.1%
- Active inventory
- 1301
- Price-to-rent
- 10.3×
Monthly cashflow live
- Estimated rent
- $2,499 high interval (Pro) →
- Mortgage (P&I)
- −$1,626
- Tax est. 1.5%
- −$388 /mo · $4,650/yr
- Insurance
- −$129
- HOA
- −$0
- Vacancy / Maint / Mgmt
- −$525
- Net cashflow
- $-168
Break-even live
Sensitivity live
| Price | -10% $46 | -5% $-61 | +0% $-168 | +5% $-275 | +10% $-383 |
|---|---|---|---|---|---|
| Rent | -10% $-366 | -5% $-267 | +0% $-168 | +5% $-70 | +10% $29 |
| Rate | -1.0pp $-12 | -0.5pp $-89 | base $-168 | +0.5pp $-249 | +1.0pp $-330 |
UW: 25.0% down · 7.5% · 30yr · 1.5% tax · 5.0% vac · 8.0% maint · 8.0% mgmt
Financing live
Cash to close
- Down payment
- $77,500
- Closing costs
- $9,300
- Reserves months
- —
- Total cash needed
- —
Loan-product check · same deal, 3 products live
Conventional
25% down · 7.5% · 30yr
- Down + closing
- —
- Monthly P&I
- —
- Monthly cashflow
- —
- DSCR
- —
- Eligible?
- —
Personal DTI + credit; lowest rate.
DSCR
20% down · 8.5% · 30yr
- Down + closing
- —
- Monthly P&I
- —
- Monthly cashflow
- —
- DSCR
- —
- Eligible?
- —
No personal income docs; deal must DSCR.
Hard money
10% down · 12.0% · 12mo
- Down + closing
- —
- Monthly P&I
- —
- Monthly cashflow
- —
- DSCR
- —
- Eligible?
- —
Short-term bridge; refi at stabilization.
Rent comps 40 comps
| Address | Beds | Baths | Sqft | Rent | $/sqft | DOM | Units | Dist |
|---|---|---|---|---|---|---|---|---|
| 201 Corcovado Ave Royse City, TX | 4.0 | 3.0 | 2323 | $3,900 | $1.68 | 46d | 1 | 0.08mi |
| 1825 Lotus St Royse City, TX | 4.0 | 2.0 | 1996 | $2,195 | $1.10 | 5d | 1 | 0.14mi |
| 1833 Lotus St Royse City, TX | 4.0 | 2.5 | 2348 | $2,495 | $1.06 | 26d | 1 | 0.15mi |
| 1833 Lotus St Royse City, TX | 4.0 | 2.5 | 2348 | $2,495 | $1.06 | 19d | 1 | 0.15mi |
| 3312 Buttonbush Dr Royse City, TX | 4.0 | 2.0 | 1892 | $2,135 | $1.13 | 1d | 1 | 0.27mi |
| 1844 Javelina St Royse City, TX | 4.0 | 2.0 | 1720 | $2,295 | $1.33 | 6d | 1 | 0.28mi |
| 1852 Javelina St Royse City, TX | 4.0 | 2.0 | 1900 | $2,200 | $1.16 | 0d | 1 | 0.29mi |
| 113 Keller Rd Royse City, TX | 4.0 | 2.0 | 1917 | $1,950 | $1.02 | 46d | 1 | 0.33mi |
| 113 Keller Rd Royse City, TX | 4.0 | 2.0 | 1917 | $1,950 | $1.02 | 23d | 1 | 0.33mi |
| 1813 Huisache St Royse City, TX | 3.0 | 2.0 | 1600 | $1,895 | $1.18 | 21d | 1 | 0.34mi |
| 2940 Lawson Dr Royse City, TX | 5.0 | 2.0 | 2012 | $2,295 | $1.14 | 7d | 1 | 0.37mi |
| 1944 Javelina St Royse City, TX | 3.0 | 2.0 | 1934 | $2,195 | $1.13 | 0d | 1 | 0.38mi |
| 1817 Grassland Dr Royse City, TX | 3.0 | 2.0 | 1763 | $2,000 | $1.13 | 1d | 1 | 0.39mi |
| 3032 Zinnia St Royse City, TX | 4.0 | 2.0 | 1917 | $2,000 | $1.04 | 26d | 1 | 0.40mi |
| 1937 Huisache St Royse City, TX | 4.0 | 2.0 | 1999 | $2,200 | $1.10 | 0d | 1 | 0.42mi |
| 3000 Buttonbush Dr Royse City, TX | 4.0 | 2.0 | 1892 | $1,895 | $1.00 | 17d | 1 | 0.43mi |
| 505 Banner Ave Royse City, TX | 5.0 | 2.0 | 2012 | $2,180 | $1.08 | 8d | 1 | 0.48mi |
| 505 Banner Ave Royse City, TX | 5.0 | 2.0 | 2012 | $2,180 | $1.08 | 26d | 1 | 0.48mi |
| 305 Banner Ave Royse City, TX | 4.0 | 2.0 | 1830 | $2,350 | $1.28 | 5d | 1 | 0.49mi |
| 1828 Elderberry St Royse City, TX | 3.0 | 2.0 | 1907 | $1,995 | $1.05 | 17d | 1 | 0.54mi |
| 1944 Fox Glove St Royse City, TX | 4.0 | 2.0 | 1478 | $1,795 | $1.21 | 46d | 1 | 0.54mi |
| 1825 Damianita Dr Royse City, TX | 4.0 | 2.0 | 1999 | $2,100 | $1.05 | 17d | 1 | 0.56mi |
| 1916 Elderberry St Royse City, TX | 3.0 | 2.0 | 1654 | $2,059 | $1.24 | 0d | 1 | 0.57mi |
| 2912 Wooten Trl Royse City, TX | 4.0 | 3.0 | 2092 | $1,895 | $0.91 | 5d | 1 | 0.57mi |
| 1817 Acacia Dr Royse City, TX | 4.0 | 3.0 | 2118 | $2,000 | $0.94 | 16d | 1 | 0.67mi |
| 2117 Berrywood Dr Royse City, TX | 4.0 | 2.0 | 1706 | $2,095 | $1.23 | 3d | 1 | 0.76mi |
| 2117 Berrywood Dr Royse City, TX | 4.0 | 2.0 | 1703 | $2,095 | $1.23 | 5d | 1 | 0.76mi |
| 1312 Silver Maple Ln Royse City, TX | 3.0 | 2.5 | 1406 | $1,695 | $1.21 | 46d | 1 | 0.86mi |
| 2141 Donker Dr Royse City, TX | 4.0 | 2.0 | 1838 | $1,850 | $1.01 | 17d | 1 | 0.89mi |
| 2141 Donker Dr Royse City, TX | 4.0 | 2.0 | 1838 | $1,850 | $1.01 | 5d | 1 | 0.89mi |
| 2134 Donker Dr Royse City, TX | 4.0 | 2.0 | 1838 | $1,950 | $1.06 | 3d | 1 | 0.90mi |
| 1226 Banyan Dr Royse City, TX | 4.0 | 2.0 | 1996 | $1,895 | $0.95 | 21d | 1 | 0.91mi |
| 1216 Alder Tree Ln Royse City, TX | 4.0 | 2.5 | 2260 | $2,029 | $0.90 | 5d | 1 | 0.92mi |
| 1225 Alder Tree Ln Royse City, TX | 3.0 | 2.5 | 2181 | $2,000 | $0.92 | 5d | 1 | 0.92mi |
| 1309 Honeywood Ln Royse City, TX | 3.0 | 2.0 | 1514 | $1,746 | $1.15 | 1d | 1 | 0.93mi |
| 1125 Silver Maple Ln Royse City, TX | 3.0 | 2.0 | 1590 | $1,895 | $1.19 | 26d | 1 | 0.97mi |
| 1125 Silver Maple Ln Royse City, TX | 3.0 | 2.0 | 1444 | $1,895 | $1.31 | 46d | 1 | 0.97mi |
| 3105 Oak Crest Dr Royse City, TX | 3.0 | 2.0 | 1864 | $1,929 | $1.03 | 24d | 1 | 0.98mi |
| 5502 County Road 2646 Unit 2646 Royse City, TX | 3.0 | 2.5 | 1920 | $2,300 | $1.20 | 46d | 1 | 0.99mi |
| 3032 Leatherwood Ln Royse City, TX | 3.0 | 2.0 | 1586 | $2,100 | $1.32 | 7d | 1 | 1.05mi |
Listing history 9 events
-
2026-06-09pricedays on market $310,000 Active 39 DOM
-
2026-06-08days on market $349,990 Active 38 DOM
-
2026-06-07days on market $349,990 Active 37 DOM
-
2026-06-04days on market $349,990 Active 34 DOM
-
2026-06-03days on market $349,990 Active 33 DOM
-
2026-06-02days on market $349,990 Active 32 DOM
-
2026-06-01days on market $349,990 Active 31 DOM
-
2026-05-31days on market $349,990 Active 30 DOM
-
2026-05-01$357,084 Active 1479-char remark
ⓘ Source: listings_history table (triggers on properties + properties_extension) + one-shot
backfill from property_details.listing_events for pre-trigger history.
Nearby sold comps map
Loading sold comps map…
Walkable amenities ~0.75 mi
Loading nearby amenities…
Taxation est. · year 1
- Rental income
- $29,986
- − Mortgage interest
- −$17,365
- − Property taxes
- −$4,650
- − Insurance
- −$1,550
- − Repairs & maintenance
- −$2,399
- − Management
- −$2,399
- − Depreciation
- −$9,018
- Taxable loss
- −$7,395
- Est. tax savings @ 24.0%
- +$1,775
- After-tax cash flow
- $-245/yr
For passive investors: Depreciation is non-cash, so a rental often shows a tax loss while cash-flowing — sheltering income. Rental losses are passive: they offset passive income freely, and up to $25,000/yr can offset ordinary (W-2) income if you actively participate and your MAGI is under $100k (phasing out to $0 by $150k); unused losses carry forward. On sale, claimed depreciation is recaptured at up to 25%, and gains may owe capital-gains tax (a 1031 exchange can defer both). Figures are a year-1 estimate at your 24.0% rate — not tax advice; consult a CPA.
Condition & rehab AI · 12 photos
This single-story home offers a good condition with modern finishes and a well-maintained exterior. It is ready for a cosmetic upgrade to enhance its resale and rental value.
Value-add opportunities
- Both landscaping — enhances curb appeal and adds value
- Both painting — refreshes interior and exterior
- Both window treatments — improves energy efficiency and aesthetics
Renovation cost estimate screening
Value-add ROI direction
- Both landscaping — enhances curb appeal and adds value ↑
- Both painting — refreshes interior and exterior ↑
- Both window treatments — improves energy efficiency and aesthetics ↑
ⓘ Cost ranges are severity-bucket heuristics (US national rule-of-thumb). Get contractor quotes + a written scope before underwriting a rehab budget.
Schools (NCES district)
- District
- Royse City ISD
- NCES district ID
- 4838220
- Math proficiency
- 42% ▼ -10.00%
- Reading proficiency
- 42% ▼ -5.00%
- Median HH income
- $73,810
- Composite
- 38.44/100
- National rank
- #4197
- State rank
- #266 of 826 in TX
Livability — Royse City
- Score
- 75/100
- State rank
- #158
- US rank
- #4292
Category grades
Schools grade is shown separately in the Schools card above.
Census & demographics
- County
- Rockwall County · 132,930 people
- City population
- 48,739
- Metro
- Dallas-Fort Worth-Arlington, TX
- Population (ZIP)
- 48,739
- Household income
- $117,125
- Rent vs Own
- Severe rent burden
- 569.0
Population outlook (Hunt County) Hauer SSP2
- Today (2025)
- 97,090 people
- By 2030
- 100,452 · +3.5%
- By 2040
- 106,544 · +9.7%
- By 2050
- 111,218 · +14.6%
- By 2075
- 121,695 · +25.3%
- By 2100
- 123,683 · +27.4%
Race, ethnicity, and origin ACS 2023
- Neighborhood character
- Diverse neighborhood (Simpson 0.57)
- Race & ethnicity
- White 60% Hispanic / Latino 25% Two or more races 12% Black 10% Asian 2%
- Hispanic origin (detail)
- Mexican 20%
- Common ancestry
- Slovak 2% Serbian 1% Lithuanian 1%
- Foreign-born
- 10% · Canada, Philippines, Jamaica
- Languages at home
- 80% English-only · Spanish 15% Other Indo-European 1%
Political lean MEDSL · Hunt
- 2024 margin
- Solid R (+55.5) · D 21.9% · R 77.4%
- 2008→2024 swing
- -14.9pp toward R · 2008: -40.6pp · 2024: -55.5pp
- All cycles
- 2024: R+55.5 2020: R+52.5 2016: R+56.3 2012: R+51.2 2008: R+40.6
Not yet ingested
- Civics
- —
Market trends
- HPI YoY
- ▼ -71.10%
- Current HPI
- 212.8422
- Rent YoY
- ▼ -1.13%
- Metro
- Dallas-Fort Worth-Arlington, TX
- State GDP YoY
- ▲ 3.95%
- F500 in state
- 110
Industry mix (Fortune 500 HQ in TX)
| Industry | F500 HQs | Revenue |
|---|---|---|
| Energy | 16 | $1,198B |
|
||
| Technology | 5 | $198B |
|
||
| Engineering / Construction | 4 | $72B |
|
||
| Energy Services | 3 | $60B |
|
||
| Utilities | 3 | $41B |
|
||
| Healthcare | 2 | $330B |
|
||
Cash-flow waterfall
monthlySold comps — $/sqft
last 12 mo · ≤1 miLoading sold comps…