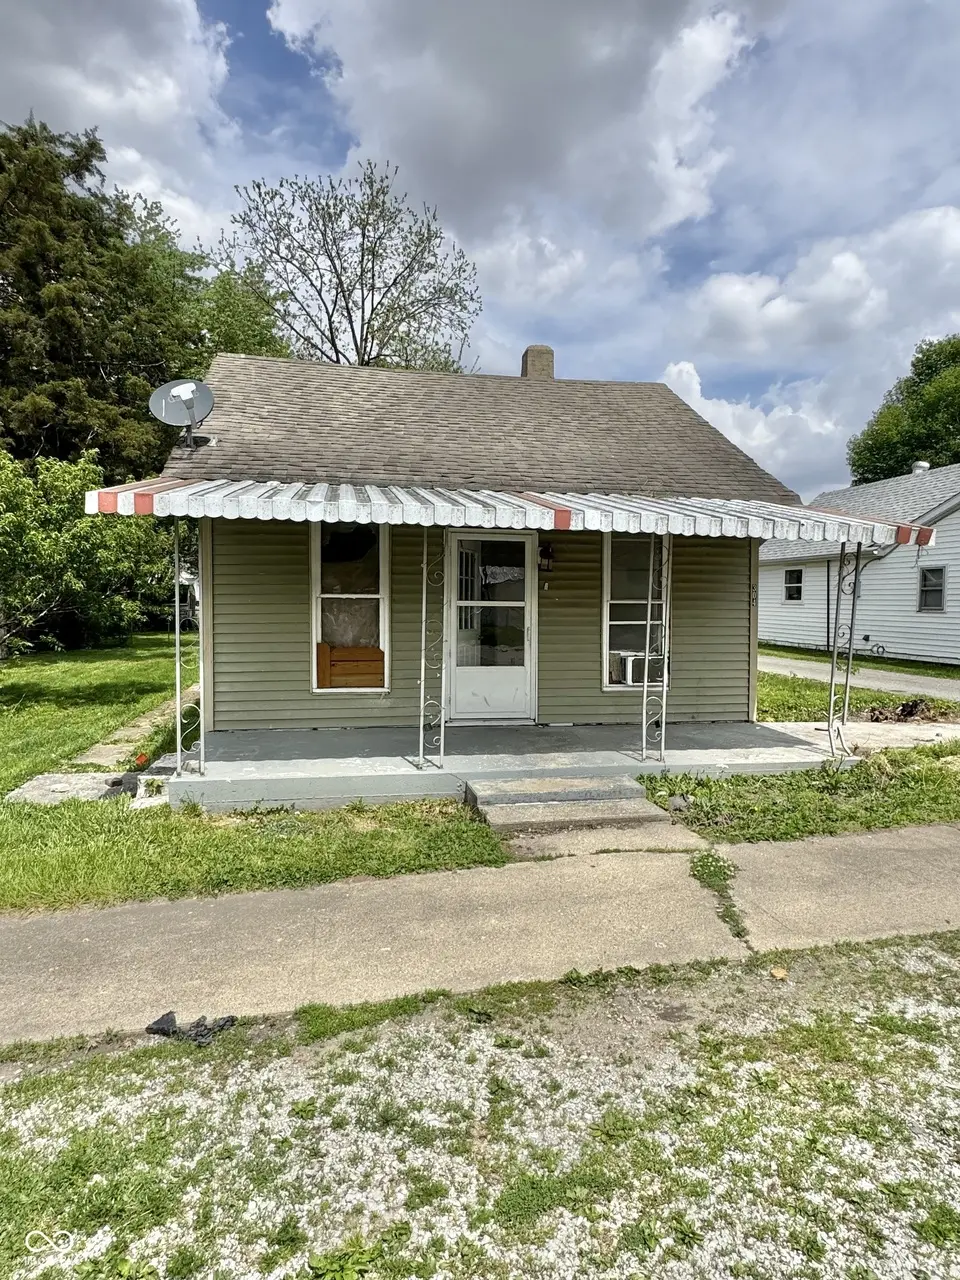
304 E Franklin St · St. Paul, IN
Flood risk 1/10 · Minimal
- FEMA flood zone
- X (unshaded)
- Chance of flooding over 30 yrs
- 0.0%
- Est. flood insurance / yr
- $507 – $1,088
Fire risk 1/10 · Minimal
- Est. fire insurance / yr
- $717 – $1,331
Heat risk 3/10 · Minor
- Hot days now (above 102°F)
- 7 days/yr
- Hot days in 30 yrs
- 19 days/yr
Wind risk 2/10 · Minimal
- Chance of severe wind over 30 yrs
- 1.0%
Air-quality risk 2/10 · Minimal
- Unhealthy air days now
- 1 days/yr
- Unhealthy air days in 30 yrs
- 2 days/yr
Risk factors via First Street. Map © Google.
Why this score? — see what drove the B- grade
The composite is a weighted blend of 9 inputs, each scored 0–100. Each bar is that input's sub-score; the figure is the points it added to the 100-point composite (weight × sub-score).
- Cash flow +30.0/30.0
- 1% rule +10.0/10.0
- DSCR +10.0/10.0
- ARV discount +7.5/15.0
- Schools +3.7/10.0
- Rent growth +2.5/5.0
- Livability +2.5/5.0
- Condition / age +2.5/5.0
- Appreciation +0.0/10.0
$39,000
🖨 Deal sheet 📄 Offer letter ✓ Due diligence
Listing remarks MLS
Needs Renovation! Could be a 1-2 BR w/ 1 bath. Nice roomy 60x120 lot with fenced yard. Also has a storage shed in back. Sits on a side alley. Has been recently treated for termites. Repairs and demo had been started. Some floors have been opened up and there are holes in some areas. Please use caution!
Key facts
- Fenced yard
- Storage shed
- Side alley
Tags
Property features AI
Finance
- Other: Lot under 1/4 acre (approximately 0.17 acre)
- Financial info: Property listed in fixer condition
Exterior
- Utilities: Public water; Municipal sewer connected
- Home design: Single-family residence; One story
- Construction: Vinyl siding; Crawl space foundation
- Exterior features: Covered porch; Storage shed
Interior
- Kitchen: Kitchen on main level
- Bedrooms: 2 bedrooms (both on the main level)
- Bathrooms: 1 full bathroom (on the main level)
- Heating & cooling: Baseboard heating; Window air conditioning units
- Interior features: No built-in kitchen appliances listed
- Laundry & utility: Main-level laundry room
Neighborhood map
What this means for you Summary
Snapshot
- This is a 1-bed/1.0-bath single-family listed at $39k.
Deal economics
- At list price, monthly cash flow is $394 ($5k/yr) — positive.
- The deal already cash-flows at list — no discount required.
- Meets the 1% rule at list price ($879 rent vs $39k).
- Recommended offer: $38k (3.0% below list) — sets the bar for market timing.
Location & tenants
- Location reads: area grade B — affects rentability + tenant quality, not the cash-flow math above.
- Decatur County Community Schools (rural): math 39% / reading 48% proficiency, ranked #107 of 301 in IN (top 36%) — families likely to look elsewhere, expect single-tenant / working-renter base with shorter leases.
- Market conditions: 3 active listings in the ZIP; 66 units permitted in Decatur County in 2024 (0 in 5+ unit buildings).
Forward outlook
- Local home prices are declining (-3.0%/yr); year-one equity from $270 of loan paydown is wiped out by about $1k of value loss. Plan a longer hold.
- Decatur County population projected at +6% by 2050 — modest demand growth; plan on rents tracking national, not racing it.
- At projected returns (-3.0% appreciation + 3.0% rent growth), your $11k cash investment doubles in ~3 years — after that, you're playing with house money.
Negotiation context
- It's been on market 54 days — a 3% lower offer ($38k) is reasonable based on typical stale-listing flexibility.
- 2 sale attempts with the ask held roughly flat each time — persistent listings suggest the price (not the market) is what's stuck; bring a comps-based counter.
Risks & watch-outs
- Watch-outs: built in 1900 — expect roof / HVAC / electrical / plumbing capex.
Questions for the listing agent
- It's been on market 54 days. Have you received any prior offers? Is the seller open to a 3% concession, seller financing, or rate buy-down credit?
- Built in 1900 — when were the roof, HVAC, electrical panel, plumbing, and water heater last replaced?
- Is there a deadline driving the sale (1031 exchange, divorce, estate, relocation)? That informs how much negotiation room exists.
- What's the average days-on-market for RENTAL listings here right now (not sales)? A rising rental-DOM trend means longer vacancies and softer asking-rent achievability than the comps imply.
- What's the recent tenant-quality profile in this submarket — average credit score on applications, eviction rate, late-payment / NSF rate, and stable-employment percentage? A property-management company in the area should have these aggregated.
- How much new for-sale + rental construction is in the pipeline within 1–3 miles? Heavy new supply typically softens prices + rents 12–24 months out; constrained supply supports both.
Investment metrics
- 1% rule
- 2.25% ✓
- Cap rate
- 18.43%
- Cash-on-cash
- 43.34%
- DSCR
- 2.93
- GRM
- 3.7
CMA / ARV
- ARV (on-the-fly)
- $196,409
- Comps found
- 2
Show comp detail 2 sales within ~0.75 mi
| Address | Dist | Beds/Ba | Sqft | Sold | Price | $/sf | Match |
|---|---|---|---|---|---|---|---|
| 307 N Main St | 0.18mi | 2/1.0 (+1) | 1,144 (+15%) | 1mo | $225,000 | $197 | 62 |
| 203 E Harrison St | 0.07mi | 1/1.5 | 1,092 (+10%) | 22mo | $59,900 | $55 | 60 |
Match score weights: distance 35% · size 25% · config 20% · recency 20%. Top-matched comps best support the ARV.
Projected returns pro-forma
-3.0% appreciation · 3.0% rent growth · sell at horizon
- IRR
- 40.2%
- Equity multiple
- 2.72×
- Total profit
- $18,832
- Equity at exit
- $5,815
- IRR
- 46.6%
- Equity multiple
- 5.48×
- Total profit
- $48,875
- Equity at exit
- $3,372
Cash invested: $10,920 (down + closing). Projections, not guarantees.
Landlord ↔ Tenant lean methodology
- Overall (STATE)
- 90 Strongly Landlord-Friendly
- State Indiana
- 90 Strongly Landlord-Friendly · R+11
- County
- — inherits STATE
- City
- — inherits STATE
ZIP-level market 47272
- Home prices YoY
- -6.2%
- Active inventory
- 3
- Price-to-rent
- 3.7×
Monthly cashflow live
- Estimated rent
- $879 medium interval (Pro) →
- Mortgage (P&I)
- −$205
- Tax from tax record
- −$79 /mo · $952/yr
- Insurance
- −$16
- HOA
- −$0
- Vacancy / Maint / Mgmt
- −$185
- Net cashflow
- $394
Break-even live
UW: 25.0% down · 7.5% · 30yr · 1.5% tax · 5.0% vac · 8.0% maint · 8.0% mgmt
Financing live
Cash to close
- Down payment
- $9,750
- Closing costs
- $1,170
- Reserves months
- —
- Total cash needed
- —
Loan-product check · same deal, 3 products live
Conventional
25% down · 7.5% · 30yr
- Down + closing
- —
- Monthly P&I
- —
- Monthly cashflow
- —
- DSCR
- —
- Eligible?
- —
Personal DTI + credit; lowest rate.
DSCR
20% down · 8.5% · 30yr
- Down + closing
- —
- Monthly P&I
- —
- Monthly cashflow
- —
- DSCR
- —
- Eligible?
- —
No personal income docs; deal must DSCR.
Hard money
10% down · 12.0% · 12mo
- Down + closing
- —
- Monthly P&I
- —
- Monthly cashflow
- —
- DSCR
- —
- Eligible?
- —
Short-term bridge; refi at stabilization.
Listing history 17 events
-
2026-06-18days on market $39,000 Active 54 DOM
-
2026-06-17days on market $39,000 Active 53 DOM
-
2026-06-16days on market $39,000 Active 52 DOM
-
2026-06-15days on market $39,000 Active 51 DOM
-
2026-06-13days on market $39,000 Active 49 DOM
-
2026-06-12days on market $39,000 Active 48 DOM
-
2026-06-09days on market $39,000 Active 45 DOM
-
2026-06-08days on market $39,000 Active 44 DOM
-
2026-06-07days on market $39,000 Active 43 DOM
-
2026-06-07days on market $39,000 Active 42 DOM
-
2026-06-04days on market $39,000 Active 39 DOM
-
2026-06-02days on market $39,000 Active 38 DOM
-
2026-06-01days on market $39,000 Active 37 DOM
-
2026-05-31days on market $39,000 Active 36 DOM
-
2026-05-31days on market $39,000 Active 35 DOM
-
2026-04-24$39,000 Active
-
2026-04-23$39,000 Active 303-char remark
Show marketing remark (303 chars)
Needs Renovation! Could be a 1-2 BR w/ 1 bath. Nice roomy 60x120 lot with fenced yard. Also has a storage shed in back. Sits on a side alley. Has been recently treated for termites. Repairs and demo had been started. Some floors have been opened up and there are holes in some areas. Please use caution!
ⓘ Source: listings_history table (triggers on properties + properties_extension) + one-shot
backfill from property_details.listing_events for pre-trigger history.
Tax reassessment forecast IN · Partial reset (capped growth)
- Current annual tax
- $952 · $79/mo
- Projected year-2 tax
- $952 · $79/mo
- Expected delta
- $0/yr ($0/mo · 0.0%)
ⓘ Screening estimate from a state-policy table — verify with the county assessor before closing.
Climate risk First Street
- Flood 1/10 Low FEMA zone X (unshaded) · 0% chance over 30 yrs
- Wildfire 1/10 Low
- Heat 3/10 Moderate 7 d/yr ≥102°F today · 19 d/yr by 30 yrs out
- Wind 2/10 Low 100% chance of damaging wind over 30 yrs
- Air quality 2/10 Low 1 unhealthy d/yr today · 2 by 30 yrs out
Nearby sold comps map
Loading sold comps map…
Walkable amenities ~0.75 mi
Loading nearby amenities…
Taxation est. · year 1
- Rental income
- $10,550
- − Mortgage interest
- −$2,185
- − Property taxes
- −$952
- − Insurance
- −$195
- − Repairs & maintenance
- −$844
- − Management
- −$844
- − Depreciation
- −$1,135
- Taxable income
- $4,395
- Est. tax owed @ 24.0%
- −$1,055
- After-tax cash flow
- $3,678/yr
For passive investors: Depreciation is non-cash, so a rental often shows a tax loss while cash-flowing — sheltering income. Rental losses are passive: they offset passive income freely, and up to $25,000/yr can offset ordinary (W-2) income if you actively participate and your MAGI is under $100k (phasing out to $0 by $150k); unused losses carry forward. On sale, claimed depreciation is recaptured at up to 25%, and gains may owe capital-gains tax (a 1031 exchange can defer both). Figures are a year-1 estimate at your 24.0% rate — not tax advice; consult a CPA.
Schools (NCES district)
- District
- Decatur County Community Schools
- NCES district ID
- 1802610
- Math proficiency
- 39% ▼ -11.00%
- Reading proficiency
- 48% ▼ -6.00%
- Median HH income
- $50,731
- Composite
- 37.43/100
- National rank
- #4415
- State rank
- #107 of 301 in IN
Livability — St. Paul
No livability data for this city. (Only ~50 U.S. cities are tracked.)
Census & demographics
- Census place
- St. Paul, IN
- Population (ZIP)
- 2,100
Population outlook (Decatur County) Hauer SSP2
- Today (2025)
- 27,709 people
- By 2030
- 28,278 · +2.1%
- By 2040
- 29,195 · +5.4%
- By 2050
- 29,512 · +6.5%
- By 2075
- 29,835 · +7.7%
- By 2100
- 27,192 · -1.9%
Race, ethnicity, and origin ACS 2023
- Neighborhood character
- Predominantly White (89%)
- Race & ethnicity
- White 89% Two or more races 7% Hispanic / Latino 4% Black 2% Asian 2%
- Common ancestry
- Russian 4% Slovak 2% Romanian 1%
- Foreign-born
- 4% · Canada
Political lean MEDSL · Decatur
- 2024 margin
- Solid R (+58.5) · D 19.9% · R 78.4% · Other 1.8%
- 2008→2024 swing
- -34.1pp toward R · 2008: -24.4pp · 2024: -58.5pp
- All cycles
- 2024: R+58.5 2020: R+58.1 2016: R+57.4 2012: R+40.5 2008: R+24.4
Not yet ingested
- Civics
- —
Market trends
- HPI YoY
- ▼ -14.55%
- Current HPI
- 219.0463
- Rent YoY
- —
- Metro
- —
- State GDP YoY
- ▲ 2.90%
- F500 in state
- 18
Industry mix (Fortune 500 HQ in IN)
| Industry | F500 HQs | Revenue |
|---|---|---|
| Industrial Machinery | 2 | $37B |
|
||
| Healthcare | 1 | $177B |
|
||
| Pharmaceuticals | 1 | $45B |
|
||
| Metals / Steel | 1 | $18B |
|
||
| Agriculture | 1 | $17B |
|
||
| Packaging | 1 | $12B |
|
||
Price history
+0.0% since first listed2 events — show timeline
- 2026-04-24 Listed $39,000 MIBOR as Distributed by MLS Grid
- 2026-04-23 Listed $39,000 SEIBR
Property tax history
+7.5%/yrLatest (2023): $952 · +9.5% YoY. Source: county tax records.
Cash-flow waterfall
monthlySold comps — $/sqft
last 12 mo · ≤1 miLoading sold comps…