49980 Avenida Vista Bonita · La Quinta, CA
Flood risk 1/10 · Minimal
- FEMA flood zone
- X (unshaded)
- Chance of flooding over 30 yrs
- 0.0%
- Est. flood insurance / yr
- $507 – $1,088
Fire risk 5/10 · Moderate
- Est. fire insurance / yr
- $659 – $1,223
Heat risk 9/10 · Severe
- Hot days now (above 113°F)
- 7 days/yr
- Hot days in 30 yrs
- 19 days/yr
Wind risk 1/10 · Minimal
- Chance of severe wind over 30 yrs
- —
Air-quality risk 4/10 · Minor
- Unhealthy air days now
- 4 days/yr
- Unhealthy air days in 30 yrs
- 5 days/yr
Risk factors via First Street. Map © Google.
Why this score? — see what drove the D+ grade
The composite is a weighted blend of 9 inputs, each scored 0–100. Each bar is that input's sub-score; the figure is the points it added to the 100-point composite (weight × sub-score).
- Cash flow +15.4/30.0
- ARV discount +7.5/15.0
- 1% rule +5.9/10.0
- DSCR +4.7/10.0
- Rent growth +4.1/5.0
- Schools +3.8/10.0
- Livability +2.9/5.0
- Condition / age +2.5/5.0
- Appreciation +0.0/10.0
$499,900
🖨 Deal sheet 📄 Offer letter ✓ Due diligence
Listing remarks
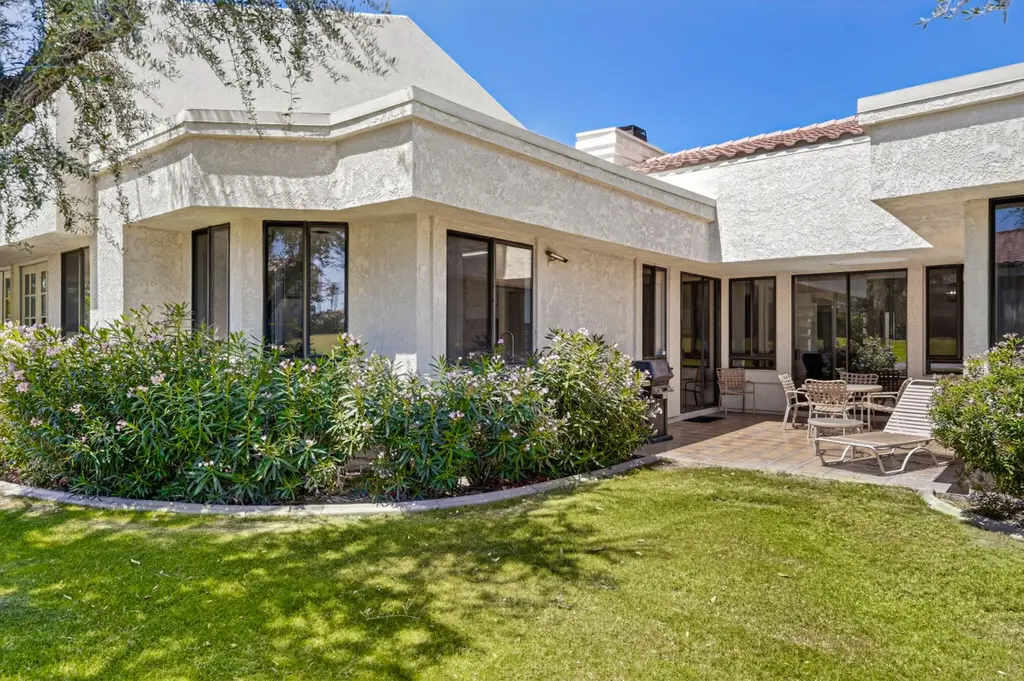
Investor opportunity in the highly sought-after Santa Rosa Cove community of La Quinta. This 3-bedroom, 3-bathroom residence offers 2,194 square feet of living space--creating a compelling value-added opportunity in a premier location. Featuring vaulted ceilings, abundant natural light, and a spacious floor plan, the home is ready for renovation and customization. The main living area centers around a statement fireplace and connects to multiple indoor-outdoor spaces, while the kitchen provides a functional layout with strong potential for modernization. A unique atrium entry and multiple sliding glass doors enhance the open, airy feel throughout. Two of the three bedrooms are ensuite, offe
Key facts
- Greenbelt setting
- Private patio
- Unique atrium entry
Tags
Property features AI
Finance
- Other: Washer, dryer, and refrigerator included in sale; Property sold as-is; governed by CC&R and planned development disclosures
- Financial info: Listing terms allow cash, submit, or cash to new loan; Short-term rentals not allowed; Will not consider lease
- HOA & community: Monthly association fee (community-managed); Association covers security and trash; Association amenities include controlled access, tennis courts, management, grounds maintenance, and clubhouse; Association pet rules apply; Development has a golf course
Exterior
- Parking: Attached 2-car garage with garage door opener; Direct entrance; Driveway; Two additional uncovered/assigned spaces (total 4 parking spaces)
- Security: 24-hour security; Gated community; Controlled access
- Utilities: Water provided by water district; Connected sewer (paid); PUD: Yes
- Home design: Condominium, attached; One story; Entry at ground level; Flat and tile roofing
- Construction: Stucco exterior; Slab foundation; Built year from assessor
- Exterior features: Gated community with 24-hour security; Controlled access; Clubhouse; Tennis courts; Pickleball courts; Golf course within development; Sprinkler system; Drip irrigation; Mountain and park/greenbelt views; Front door faces west; leisure area faces east
Interior
- Kitchen: Tile counters; Electric cooktop; Electric oven; Microwave; Dishwasher; Refrigerator; Trash compactor; Gas available
- Bedrooms: Two master bedrooms
- Flooring: Carpet; Tile
- Bathrooms: Three full bathrooms; Double vanities; Shower over tub
- Heating & cooling: Central heating; Fireplace heating (gas); Air conditioning; Central air; Ceiling fans
- Interior features: High ceilings (9 ft+); Vaulted ceilings; Ground-level no-step entry; Double-door entry; Sliding doors; Partially furnished; Blinds
- Laundry & utility: Washer and dryer included; Laundry in individual room
Neighborhood map
What this means for you Summary
Snapshot
- This is a 3-bed/3.0-bath condo listed at $500k.
Deal economics
- At list price, monthly cash flow is $195 ($2k/yr) — positive.
- The deal already cash-flows at list — no discount required.
- Meets the 1% rule at list price ($5k rent vs $500k).
- Recommended offer: $492k (1.5% below list) — sets the bar for market timing.
- Cap rate 6.8% vs local median 3.3% in La Quinta — top-decile yield for the area; either an underpriced asset or a hidden risk that comps aren't pricing in. Stress-test before assuming the spread holds.
Location & tenants
- Location reads 58/100 on livability (#694 in CA) — a working-class tenant base; expect higher turnover. Strengths: commute A-, employment B+, housing B+; Watch: schools D, amenities F, cost of living F.
- Desert Sands Unified (suburban): math 31% / reading 56% proficiency, ranked #199 of 517 in CA (top 38%) — families likely to look elsewhere, expect single-tenant / working-renter base with shorter leases.
- Market conditions: Rents rising fast (+6.5%/yr); 656 active listings in the ZIP; 40 comparable units currently listed for rent nearby; rentals lingering (median 44d on market — plan ~5-8 weeks vacancy on turnover, expect pricing pressure); 70% of comp listings sitting > 30 days — soft ceiling on asking rent; solid renter incomes; 9,195 units permitted in Riverside County in 2024 (1,512 in 5+ unit buildings).
- At $5,442/mo this rent would consume 66% of the median local household income ($99k/yr) (locally 1078% of renters already pay >50% of income on rent) — very limited rent-growth headroom before tenants either downsize or default.
Forward outlook
- Local home prices are declining (-3.0%/yr); year-one equity from $3k of loan paydown is wiped out by about $15k of value loss. Plan a longer hold.
- Riverside County population projected at +22% by 2050 — long-run rental-demand tailwind backs the buy-and-hold thesis.
Negotiation context
- It's been on market 15 days — a 2% lower offer ($492k) is reasonable based on typical stale-listing flexibility.
Risks & watch-outs
- Climate carrying-cost: moderate wildfire risk; extreme-heat days projected 7→19/yr by 2055 (HVAC capex compounding) — expect insurance premiums to compound above CPI over the hold.
Questions for the listing agent
- What does the HOA fee cover, when was the last increase, and are there any pending special assessments or reserve-fund shortfalls?
- Any open or pending special assessments — roof, HVAC, plumbing, elevator, façade? What's the per-unit balance and payoff schedule, and is the seller paying it off at close or rolling it to the buyer?
- Is there a deadline driving the sale (1031 exchange, divorce, estate, relocation)? That informs how much negotiation room exists.
- Schools are D-rated, which usually means shorter tenancies and higher turnover. Who's the typical renter profile here, and what's been the actual vacancy rate?
- The area grade is low — what's the realistic commute time and amenity access for the typical tenant pool here? Any planned neighborhood developments (good or bad) we should know about?
- What's the average days-on-market for RENTAL listings here right now (not sales)? A rising rental-DOM trend means longer vacancies and softer asking-rent achievability than the comps imply.
- What's the recent tenant-quality profile in this submarket — average credit score on applications, eviction rate, late-payment / NSF rate, and stable-employment percentage? A property-management company in the area should have these aggregated.
- How much new apartment / multifamily construction is in the pipeline within 1–3 miles? Heavy new supply (>2% of stock underway) typically softens rents 12–24 months out; light construction supports rent growth.
Investment metrics
- 1% rule
- 1.09% ✓
- Cap rate
- 6.76%
- Cash-on-cash
- 1.67%
- DSCR
- 1.07
- GRM
- 7.7
CMA / ARV
No comps found within radius.
Projected returns pro-forma
-3.0% appreciation · 6.45% rent growth · sell at horizon
- IRR
- -9.1%
- Equity multiple
- 0.65×
- Total profit
- $-48,553
- Equity at exit
- $74,537
- IRR
- 5.1%
- Equity multiple
- 1.44×
- Total profit
- $61,783
- Equity at exit
- $43,222
Cash invested: $139,972 (down + closing). Projections, not guarantees.
Landlord ↔ Tenant lean methodology
- Overall (STATE)
- 18 Strongly Tenant-Friendly
- State California
- 18 Strongly Tenant-Friendly · D+13
- County
- — inherits STATE
- City
- — inherits STATE
ZIP-level market 92253
- Rents YoY
- 6.5%
- Active inventory
- 656
- Price-to-rent
- 7.7×
Monthly cashflow live
- Estimated rent
- $5,442 high interval (Pro) →
- Mortgage (P&I)
- −$2,622
- Tax from tax record
- −$495 /mo · $5,935/yr
- Insurance
- −$208
- HOA
- −$780
- Vacancy / Maint / Mgmt
- −$1,143
- Net cashflow
- $195
Break-even live
UW: 25.0% down · 7.5% · 30yr · 1.5% tax · 5.0% vac · 8.0% maint · 8.0% mgmt
Financing live
Cash to close
- Down payment
- $124,975
- Closing costs
- $14,997
- Reserves months
- —
- Total cash needed
- —
Loan-product check · same deal, 3 products live
Conventional
25% down · 7.5% · 30yr
- Down + closing
- —
- Monthly P&I
- —
- Monthly cashflow
- —
- DSCR
- —
- Eligible?
- —
Personal DTI + credit; lowest rate.
DSCR
20% down · 8.5% · 30yr
- Down + closing
- —
- Monthly P&I
- —
- Monthly cashflow
- —
- DSCR
- —
- Eligible?
- —
No personal income docs; deal must DSCR.
Hard money
10% down · 12.0% · 12mo
- Down + closing
- —
- Monthly P&I
- —
- Monthly cashflow
- —
- DSCR
- —
- Eligible?
- —
Short-term bridge; refi at stabilization.
Rent comps 40 comps
| Address | Beds | Baths | Sqft | Rent | $/sqft | DOM | Units | Dist |
|---|---|---|---|---|---|---|---|---|
| 50008 Calle Oaxaca La Quinta, CA | 3.0 | 2.0 | 1591 | $13,500 | $8.49 | 43d | 1 | 0.06mi |
| 50075 Calle Rosarita La Quinta, CA | 3.0 | 3.5 | 1922 | $12,000 | $6.24 | 43d | 1 | 0.12mi |
| 77662 Avenida Madrugada La Quinta, CA | 3.0 | 3.0 | 1922 | $4,000 | $2.08 | 43d | 1 | 0.21mi |
| 76993 Calle Mazatlan La Quinta, CA | 3.0 | 3.5 | 2000 | $9,000 | $4.50 | 43d | 1 | 0.31mi |
| 77010 Avenida Fernando La Quinta, CA | 3.0 | 3.0 | 2885 | $7,500 | $2.60 | 43d | 1 | 0.41mi |
| 49845 Lago Dr La Quinta, CA | 3.0 | 3.0 | 2332 | $10,000 | $4.29 | 24d | 1 | 0.42mi |
| 78174 Calle Norte La Quinta, CA | 3.0 | 3.0 | 2613 | $5,300 | $2.03 | 43d | 1 | 0.50mi |
| 78191 Cll Norte La Quinta, CA | 2.0 | 2.0 | 2023 | $5,000 | $2.47 | 17d | 1 | 0.51mi |
| 51225 Avenida Ramirez La Quinta, CA | 3.0 | 2.0 | 1476 | $6,000 | $4.07 | 43d | 1 | 0.59mi |
| 78133 Calle Norte La Quinta, CA | 2.0 | 2.0 | 1555 | $4,500 | $2.89 | 43d | 1 | 0.61mi |
| 51260 Avenida Vallejo La Quinta, CA | 3.0 | 2.0 | 1713 | $2,595 | $1.51 | 21d | 1 | 0.63mi |
| 51116 Avenida Mendoza La Quinta, CA | 4.0 | 4.5 | 2239 | $25,000 | $11.17 | 43d | 1 | 0.63mi |
| 51200 Avenida Diaz La Quinta, CA | 3.0 | 4.0 | 1899 | $8,000 | $4.21 | 43d | 1 | 0.65mi |
| 51120 Avenida Navarro La Quinta, CA | 4.0 | 4.5 | 2250 | $25,000 | $11.11 | 43d | 1 | 0.70mi |
| 77713 Tradition Dr La Quinta, CA | 3.0 | 3.0 | 1706 | $5,500 | $3.22 | 24d | 1 | 0.78mi |
| 77777 Tradition Dr Unit B La Quinta, CA | 3.0 | 3.0 | 1706 | $6,950 | $4.07 | 43d | 1 | 0.84mi |
| 78322 Calle Las Ramblas La Quinta, CA | 3.0 | 3.0 | 2093 | $7,000 | $3.34 | 3d | 1 | 0.85mi |
| 78328 Calle Las Ramblas La Quinta, CA | 3.0 | 3.0 | 2412 | $4,200 | $1.74 | 43d | 1 | 0.86mi |
| 48721 Santa Ursula St La Quinta, CA | 3.0 | 2.5 | 2659 | $17,000 | $6.39 | 43d | 1 | 0.86mi |
| 77772 Tradition Dr La Quinta, CA | 3.0 | 3.5 | 1961 | $6,975 | $3.56 | 43d | 1 | 0.89mi |
| 51800 Avenida Juarez La Quinta, CA | 3.0 | 2.0 | 1943 | $3,299 | $1.70 | 43d | 1 | 0.92mi |
| 78440 Calle Felipe La Quinta, CA | 3.0 | 3.0 | 2037 | $3,300 | $1.62 | 12d | 1 | 0.92mi |
| 49810 Avenida Montero La Quinta, CA | 3.0 | 3.0 | 2980 | $4,999 | $1.68 | 20d | 1 | 0.94mi |
| 49810 Avenida Montero La Quinta, CA | 3.0 | 3.0 | 2980 | $4,999 | $1.68 | 21d | 1 | 0.94mi |
| 48625 Calle Esperanza La Quinta, CA | 3.0 | 2.0 | 1852 | $2,999 | $1.62 | 24d | 1 | 0.96mi |
| 78481 Calle Felipe La Quinta, CA | 3.0 | 2.0 | 2168 | $5,000 | $2.31 | 43d | 1 | 0.97mi |
| 51880 Avenida Madero La Quinta, CA | 3.0 | 2.0 | 1661 | $3,500 | $2.11 | 43d | 1 | 0.98mi |
| 52035 Avenida Diaz La Quinta, CA | 4.0 | 2.0 | 1886 | $3,500 | $1.86 | 43d | 1 | 1.04mi |
| 48602 Paseo Tarazo La Quinta, CA | 2.0 | 2.0 | 1562 | $3,100 | $1.98 | 43d | 1 | 1.04mi |
| 52123 Avenida Diaz La Quinta, CA | 3.0 | 3.0 | 1761 | $5,500 | $3.12 | 43d | 1 | 1.07mi |
| 48540 Via Amistad La Quinta, CA | 3.0 | 2.0 | 2001 | $4,500 | $2.25 | 43d | 1 | 1.07mi |
| 52225 Avenida Obregon La Quinta, CA | 3.0 | 2.0 | 1611 | $5,200 | $3.23 | 43d | 1 | 1.11mi |
| 51315 Calle Kalima La Quinta, CA | 3.0 | 2.0 | 1916 | $3,500 | $1.83 | 43d | 1 | 1.14mi |
| 52221 Avenida Villa La Quinta, CA | 4.0 | 4.0 | 1676 | $2,850 | $1.70 | 24d | 1 | 1.14mi |
| 78655 Via Sonata La Quinta, CA | 4.0 | 3.0 | 2222 | $6,500 | $2.93 | 44d | 1 | 1.16mi |
| 78655 Via Sonata La Quinta, CA | 4.0 | 3.0 | 2222 | $6,500 | $2.93 | 24d | 1 | 1.16mi |
| 77211 Calle Sonora La Quinta, CA | 3.0 | 2.0 | 1700 | $7,900 | $4.65 | 43d | 1 | 1.16mi |
| 49035 Tango Ct La Quinta, CA | 4.0 | 3.0 | 2004 | $6,500 | $3.24 | 5d | 1 | 1.18mi |
| 49035 Tango Ct La Quinta, CA | 4.0 | 2.5 | 2004 | $6,500 | $3.24 | 43d | 1 | 1.18mi |
| 48110 Calle Seranas La Quinta, CA | 3.0 | 2.0 | 1581 | $5,500 | $3.48 | 43d | 1 | 1.18mi |
HOA detail condo
- Monthly dues
- $780 · $9,360/yr
- Assessments
- None detected in remarks — confirm with the listing agent.
Listing history 3 events
-
2026-05-08historical Active Under Contract 1613-char remark
-
2026-04-29$499,900 Active 1613-char remark
-
1987-02-04soldstatus $215,000
ⓘ Source: listings_history table (triggers on properties + properties_extension) + one-shot
backfill from property_details.listing_events for pre-trigger history.
Tax reassessment forecast CA · Resets to sale price
- Current annual tax
- $5,935 · $495/mo
- Projected year-2 tax
- $5,935 · $495/mo
- Expected delta
- $0/yr ($0/mo · 0.0%)
ⓘ Screening estimate from a state-policy table — verify with the county assessor before closing.
Climate risk First Street
- Flood 1/10 Low FEMA zone X (unshaded) · 0% chance over 30 yrs
- Wildfire 5/10 Major
- Heat 9/10 Extreme 7 d/yr ≥113°F today · 19 d/yr by 30 yrs out
- Wind 1/10 Low
- Air quality 4/10 Moderate 4 unhealthy d/yr today · 5 by 30 yrs out
Nearby sold comps map
Loading sold comps map…
Walkable amenities ~0.75 mi
Loading nearby amenities…
Taxation est. · year 1
- Rental income
- $65,309
- − Mortgage interest
- −$28,002
- − Property taxes
- −$5,935
- − Insurance
- −$2,500
- − Repairs & maintenance
- −$5,225
- − Management
- −$5,225
- − HOA
- −$9,360
- − Depreciation
- −$14,543
- Taxable loss
- −$5,480
- Est. tax savings @ 24.0%
- +$1,315
- After-tax cash flow
- $3,656/yr
For passive investors: Depreciation is non-cash, so a rental often shows a tax loss while cash-flowing — sheltering income. Rental losses are passive: they offset passive income freely, and up to $25,000/yr can offset ordinary (W-2) income if you actively participate and your MAGI is under $100k (phasing out to $0 by $150k); unused losses carry forward. On sale, claimed depreciation is recaptured at up to 25%, and gains may owe capital-gains tax (a 1031 exchange can defer both). Figures are a year-1 estimate at your 24.0% rate — not tax advice; consult a CPA.
Schools (NCES district)
- District
- Desert Sands Unified
- NCES district ID
- 0611110
- Math proficiency
- 31% ▼ -4.00%
- Reading proficiency
- 56% ▲ 7.00%
- Median HH income
- $54,957
- Composite
- 37.77/100
- National rank
- #4346
- State rank
- #199 of 517 in CA
Livability — La Quinta
- Score
- 58/100
- State rank
- #694
- US rank
- #21080
Category grades
Schools grade is shown separately in the Schools card above.
Census & demographics
- Census place
- La Quinta, CA
- County
- Riverside County · 2,287,001 people
- City population
- 38,666
- Metro
- Riverside-San Bernardino-Ontario, CA
- Population (ZIP)
- 38,666
- Household income
- $99,277
- Rent vs Own
- Severe rent burden
- 1078.0
Population outlook (Riverside County) Hauer SSP2
- Today (2025)
- 2,664,475 people
- By 2030
- 2,802,692 · +5.2%
- By 2040
- 3,050,904 · +14.5%
- By 2050
- 3,256,783 · +22.2%
- By 2075
- 3,655,058 · +37.2%
- By 2100
- 3,766,594 · +41.4%
Race, ethnicity, and origin ACS 2023
- Neighborhood character
- Diverse neighborhood (Simpson 0.57)
- Race & ethnicity
- White 54% Hispanic / Latino 37% Two or more races 19% Asian 4% Native American 1% Black 1%
- Hispanic origin (detail)
- Mexican 34%
- Common ancestry
- Romanian 2% Lithuanian 2% Slovak 1%
- Foreign-born
- 15% · Canada, China, Vietnam
- Languages at home
- 71% English-only · Spanish 24% Tagalog/Filipino 1% Chinese 1%
Political lean MEDSL · Riverside
- 2024 margin
- Toss-up / Even · D 48.0% · R 49.3% · Other 2.6%
- 2008→2024 swing
- -3.6pp toward R · 2008: 2.3pp · 2024: -1.3pp
- All cycles
- 2024: R+1.3 2020: D+8.0 2016: D+4.3 2012: R+0.4 2008: D+2.3
Not yet ingested
- Civics
- —
Market trends
- HPI YoY
- ▼ -263.65%
- Current HPI
- 281.8665
- Rent YoY
- ▲ 6.45%
- Metro
- Riverside-San Bernardino-Ontario, CA
- State GDP YoY
- ▲ 3.21%
- F500 in state
- 116
Industry mix (Fortune 500 HQ in CA)
| Industry | F500 HQs | Revenue |
|---|---|---|
| Technology | 27 | $1,492B |
|
||
| Financial Services | 3 | $174B |
|
||
| Retail | 3 | $44B |
|
||
| Insurance | 3 | $26B |
|
||
| Media / Entertainment | 2 | $115B |
|
||
| Pharmaceuticals / Biotech | 2 | $62B |
|
||
Price history
+134.9% since first listed6 events — show timeline
- 2026-05-26 Sold (Public Records) $505,000 Public Records
- 2026-05-26 Sold (MLS) $505,000 GPSMLS
- 2026-05-20 Pending — GPSMLS
- 2026-05-08 Contingent — GPSMLS
- 2026-04-29 Listed $499,900 GPSMLS
- 1987-02-04 Sold (Public Records) $215,000 Public Records
Property tax history
+2.2%/yrLatest (2025): $5,935 · +2.6% YoY. Source: county tax records.
Cash-flow waterfall
monthlySold comps — $/sqft
last 12 mo · ≤1 miLoading sold comps…