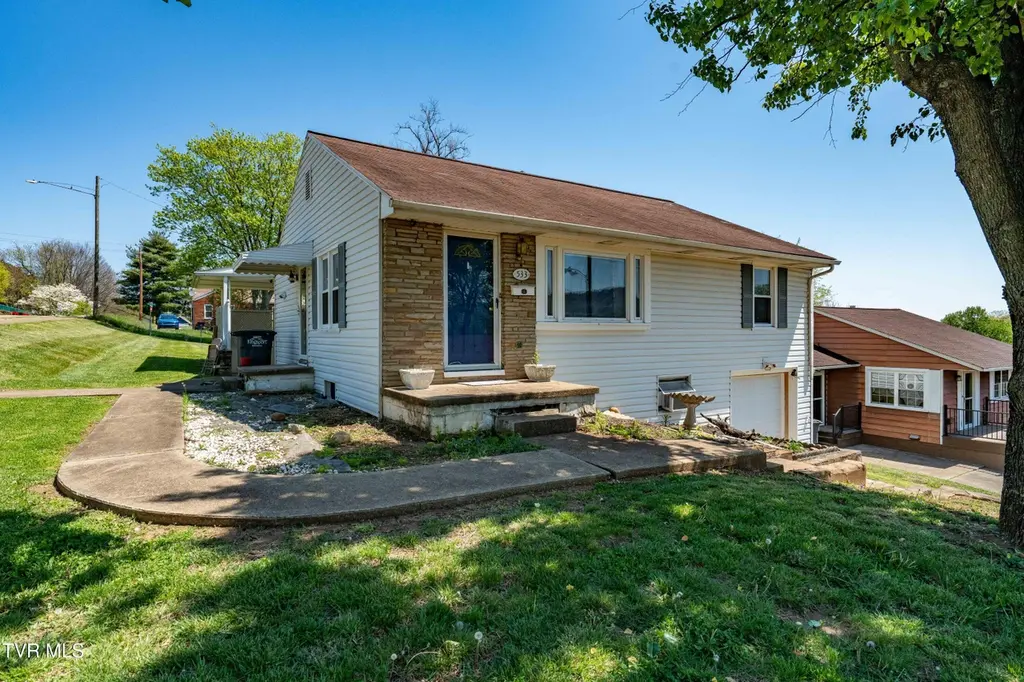
533 Bellvue Ave · Kingsport, TN
Flood risk 1/10 · Minimal
- FEMA flood zone
- X (unshaded)
- Chance of flooding over 30 yrs
- 0.0%
- Est. flood insurance / yr
- $473 – $860
Fire risk 1/10 · Minimal
- Est. fire insurance / yr
- $949 – $1,763
Heat risk 5/10 · Moderate
- Hot days now (above 101°F)
- 7 days/yr
- Hot days in 30 yrs
- 22 days/yr
Wind risk 2/10 · Minimal
- Chance of severe wind over 30 yrs
- —
Air-quality risk 1/10 · Minimal
- Unhealthy air days now
- 0 days/yr
- Unhealthy air days in 30 yrs
- 0 days/yr
Risk factors via First Street. Map © Google.
Why this score? — see what drove the B- grade
The composite is a weighted blend of 9 inputs, each scored 0–100. Each bar is that input's sub-score; the figure is the points it added to the 100-point composite (weight × sub-score).
- Cash flow +26.2/30.0
- ARV discount +15.0/15.0
- DSCR +8.8/10.0
- 1% rule +6.2/10.0
- Rent growth +4.5/5.0
- Livability +3.6/5.0
- Schools +3.0/10.0
- Condition / age +2.5/5.0
- Appreciation +0.0/10.0
$159,900
🖨 Deal sheet (PDF) 📄 Offer letter ✓ Due diligence
Listing remarks
Discover the potential of this charming home ideally situated in a highly desirable location. With just a touch of vision and care, this property offers an incredible opportunity to create the perfect cottage-style retreat tailored to your lifestyle. The main level is thoughtfully designed for convenient one-level living, featuring two generously sized bedrooms positioned off a central hallway that opens into a spacious, light-filled living area. A large eat-in kitchen serves as the heart of the home--perfect for everyday living and effortless entertaining. Upstairs, a walk-up attic provides abundant storage and exciting potential for future expansion or customization. The lower level adds
Key facts
- 7,405 sq ft lot
- Garage
- Built 1940
Property features AI
Exterior
- Parking: Driveway; 1-car garage
- Utilities: Public water; Public sewer; Natural gas available
- Home design: Single-family house; Residential property; Listed as fixer condition; Zoned R 1C
- Construction: Vinyl siding; Shingle roof; Built with a finished below-grade area (partially finished basement included)
- Exterior features: Covered patio/porch; Outbuilding on the property; Level to sloped topography
Interior
- Kitchen: Dishwasher; Electric range; Refrigerator
- Bedrooms: Total of 6 rooms (includes bedrooms and living spaces)
- Flooring: Vinyl flooring
- Bathrooms: 2 full bathrooms
- Heating & cooling: Heat pump for heating and cooling
- Interior features: Eat-in kitchen; Concrete basement (finished and partially finished)
- Laundry & utility: Washer hookup; Electric dryer hookup
Neighborhood map
What this means for you Summary
Snapshot
- This is a 2-bed/2.0-bath single-family listed at $160k.
Deal economics
- At list price, monthly cash flow is $406 ($5k/yr) — positive.
- The deal already cash-flows at list — no discount required.
- Meets the 1% rule at list price ($2k rent vs $160k).
- Cap rate 9.3% vs local median 3.8% in Kingsport — top-decile yield for the area; either an underpriced asset or a hidden risk that comps aren't pricing in. Stress-test before assuming the spread holds.
Location & tenants
- Location reads 71/100 on livability (#39 in TN) — a middle-class / working-renter tenant base. Strengths: cost of living A+, health & safety A+, housing A; Watch: amenities C-, crime F, commute F.
- Kingsport (urban): math 35% / reading 38% proficiency, ranked #26 of 139 in TN (top 19%) — families likely to look elsewhere, expect single-tenant / working-renter base with shorter leases.
- Zoned schools: Andrew Jackson Elementary School (math 27% / reading 23%, grade F, #541 of 952 statewide, top 57%, 496 students, 0% FRL); John Sevier Middle School (math 21% / reading 24%, grade F, #172 of 333 statewide, top 52%, 750 students, 0% FRL); Dobyns - Bennett High School (math 23% / reading 56%, grade F, #28 of 332 statewide, top 9%, 2,514 students, 0% FRL) — zoned schools average 0% FRL vs 47% district-wide (47 pts lower); this property's tenant base skews higher-income than the district average.
- Market conditions: Rents rising fast (+8.0%/yr); 239 active listings in the ZIP; 14 comparable units currently listed for rent nearby; rentals at typical pace (median 22d on market — plan ~3-4 weeks tenant-placement turnaround); 453 units permitted in Sullivan County in 2024 (6 in 5+ unit buildings).
- This rent runs 44% of the median local income ($49k/yr) — at the standard rent-burdened threshold; future hikes will face affordability resistance.
Forward outlook
- Local home prices are declining (-3.0%/yr); year-one equity from $1k of loan paydown is wiped out by about $5k of value loss. Plan a longer hold.
- Sullivan County population projected to shrink 5% by 2050 — rents likely to lag national; underwrite the cash flow, not the appreciation.
- At projected returns (-3.0% appreciation + 8.0% rent growth), your $45k cash investment doubles in ~8 years — after that, you're playing with house money.
Negotiation context
- Only 6 days on market — expect competitive offers; lowballing is unlikely to land.
- 2 sale attempts with the ask held roughly flat each time — persistent listings suggest the price (not the market) is what's stuck; bring a comps-based counter.
Risks & watch-outs
- Watch-outs: built in 1940 — expect roof / HVAC / electrical / plumbing capex.
- Climate carrying-cost: extreme-heat days projected 7→22/yr by 2055 (HVAC capex compounding) — expect insurance premiums to compound above CPI over the hold.
Questions for the listing agent
- Built in 1940 — when were the roof, HVAC, electrical panel, plumbing, and water heater last replaced?
- Is there a deadline driving the sale (1031 exchange, divorce, estate, relocation)? That informs how much negotiation room exists.
- Schools are D-rated, which usually means shorter tenancies and higher turnover. Who's the typical renter profile here, and what's been the actual vacancy rate?
- Crime grade is F in this area — have there been break-ins, vandalism, or insurance claims at this property in the last 3 years? What carrier currently insures it and at what premium?
- What's the average days-on-market for RENTAL listings here right now (not sales)? A rising rental-DOM trend means longer vacancies and softer asking-rent achievability than the comps imply.
- What's the recent tenant-quality profile in this submarket — average credit score on applications, eviction rate, late-payment / NSF rate, and stable-employment percentage? A property-management company in the area should have these aggregated.
- How much new for-sale + rental construction is in the pipeline within 1–3 miles? Heavy new supply typically softens prices + rents 12–24 months out; constrained supply supports both.
Investment metrics
- 1% rule
- 1.12% ✓
- Cap rate
- 9.34%
- Cash-on-cash
- 10.88%
- DSCR
- 1.48
- GRM
- 7.5
CMA / ARV
- ARV (on-the-fly)
- $256,592
- Comps found
- 12
Show comp detail 12 sales within ~0.75 mi
| Address | Dist | Beds/Ba | Sqft | Sold | Price | $/sf | Match |
|---|---|---|---|---|---|---|---|
| 533 Bellvue Ave | 0.00mi | 2/2.0 | 1,624 (0%) | 0mo | $160,000 | $99 | 100 |
| 611 Fairmont Ave | 0.09mi | 3/2.0 (+1) | 1,659 (+2%) | 2mo | $335,000 | $202 | 85 |
| 817 Mimosa Dr | 0.26mi | 3/2.0 (+1) | 1,537 (-5%) | 3mo | $268,000 | $174 | 71 |
| 709 Truxton Dr | 0.47mi | 3/2.0 (+1) | 1,648 (+2%) | 6mo | $218,000 | $132 | 65 |
| 414 Sullivan St | 0.65mi | 3/2.0 (+1) | 1,608 (-1%) | 2mo | $200,000 | $124 | 62 |
| 1016 Whippoorwill Ln | 0.44mi | 3/2.0 (+1) | 1,527 (-6%) | 4mo | $223,900 | $147 | 62 |
| 830 Fairview Ave | 0.36mi | 3/2.0 (+1) | 1,484 (-9%) | 3mo | $235,000 | $158 | 61 |
| 1109 Tay Sta | 0.47mi | 3/2.5 (+1) | 1,790 (+10%) | 8mo | $308,500 | $172 | 48 |
| 1461 Gress Mag Mtn | 0.65mi | 3/2.5 (+1) | 1,749 (+8%) | 4mo | $307,020 | $176 | 47 |
| 545 Bays View Rd | 0.59mi | 3/1.5 (+1) | 1,443 (-11%) | 3mo | $276,000 | $191 | 44 |
| 562 Lovedale Dr | 0.59mi | 3/1.0 (+1) | 1,437 (-12%) | 5mo | $162,000 | $113 | 40 |
| 418 Sullivan St | 0.64mi | 3/2.0 (+1) | 1,824 (+12%) | 8mo | $249,000 | $137 | 38 |
Match score weights: distance 35% · size 25% · config 20% · recency 20%. Top-matched comps best support the ARV.
Projected returns pro-forma
-3.0% appreciation · 7.95% rent growth · sell at horizon
- IRR
- 5.1%
- Equity multiple
- 1.21×
- Total profit
- $9,244
- Equity at exit
- $23,842
- IRR
- 18.4%
- Equity multiple
- 2.87×
- Total profit
- $83,636
- Equity at exit
- $13,825
Cash invested: $44,772 (down + closing). Projections, not guarantees.
Landlord ↔ Tenant lean methodology
- Overall (STATE)
- 87 Strongly Landlord-Friendly
- State Tennessee
- 87 Strongly Landlord-Friendly · R+13
- County
- — inherits STATE
- City
- — inherits STATE
ZIP-level market 37660
- Home prices YoY
- -24.2%
- Rents YoY
- 8.0%
- Active inventory
- 239
- Price-to-rent
- 7.5×
Monthly cashflow live
- Estimated rent
- $1,785 high interval (Pro) →
- Mortgage (P&I)
- −$839
- Tax from tax record
- −$99 /mo · $1,187/yr
- Insurance
- −$67
- HOA
- −$0
- Vacancy / Maint / Mgmt
- −$375
- Net cashflow
- $406
Break-even live
Sensitivity live
| Price | -10% $496 | -5% $451 | +0% $406 | +5% $361 | +10% $315 |
|---|---|---|---|---|---|
| Rent | -10% $265 | -5% $335 | +0% $406 | +5% $476 | +10% $547 |
| Rate | -1.0pp $486 | -0.5pp $447 | base $406 | +0.5pp $365 | +1.0pp $322 |
UW: 25.0% down · 7.5% · 30yr · 1.5% tax · 5.0% vac · 8.0% maint · 8.0% mgmt
Financing live
Cash to close
- Down payment
- $39,975
- Closing costs
- $4,797
- Reserves months
- —
- Total cash needed
- —
Loan-product check · same deal, 3 products live
Conventional
25% down · 7.5% · 30yr
- Down + closing
- —
- Monthly P&I
- —
- Monthly cashflow
- —
- DSCR
- —
- Eligible?
- —
Personal DTI + credit; lowest rate.
DSCR
20% down · 8.5% · 30yr
- Down + closing
- —
- Monthly P&I
- —
- Monthly cashflow
- —
- DSCR
- —
- Eligible?
- —
No personal income docs; deal must DSCR.
Hard money
10% down · 12.0% · 12mo
- Down + closing
- —
- Monthly P&I
- —
- Monthly cashflow
- —
- DSCR
- —
- Eligible?
- —
Short-term bridge; refi at stabilization.
Rent comps 14 comps
| Address | Beds | Baths | Sqft | Rent | $/sqft | DOM | Units | Dist |
|---|---|---|---|---|---|---|---|---|
| 1104 Tay Sta Kingsport, TN | 3.0 | 3.0 | 2136 | $2,250 | $1.05 | 21d | 1 | 0.50mi |
| 455 W Sullivan St Kingsport, TN | 1.0–3.0 | 1.0–2.0 | 988 | $1,647 | $1.67 | 14d | 16 | 0.53mi |
| 206 Hammond Ave Kingsport, TN | 3.0 | 1.0 | 1696 | $1,525 | $0.90 | 21d | 1 | 0.54mi |
| 1441 Gress Mag Mtn Kingsport, TN | 3.0 | 2.5 | 2218 | $2,200 | $0.99 | 21d | 1 | 0.63mi |
| 724 Teasel Dr Kingsport, TN | 1.0–2.0 | 1.0 | 927 | $999 | $1.08 | 21d | 1 | 0.76mi |
| 109 W Wanola Ave Kingsport, TN | 3.0 | 2.0 | 1600 | $2,300 | $1.44 | 14d | 1 | 0.88mi |
| 116 E Market St Unit 4 Kingsport, TN | 2.0 | 1.0 | 1090 | $1,395 | $1.28 | 21d | 1 | 0.97mi |
| 124 Bloomingdale Pike Kingsport, TN | 1.0–2.0 | 1.0–1.5 | 878 | $1,300 | $1.48 | 14d | 1 | 0.97mi |
| 1040 Tiptop Ave Kingsport, TN | 2.0–3.0 | 2.0 | 947 | $960 | $1.01 | 14d | 1 | 1.18mi |
| 453 E Main St Unit 700 Kingsport, TN | 2.0 | 2.0 | 1292 | $2,252 | $1.74 | 21d | 1 | 1.21mi |
| 453 E Main St #300 Kingsport, TN | 2.0 | 2.0 | 1292 | $2,172 | $1.68 | 21d | 1 | 1.21mi |
| 453 E Main St Unit 900 Kingsport, TN | 2.0 | 2.0 | 1247 | $2,240 | $1.80 | 21d | 1 | 1.21mi |
| 453 E Main St Kingsport, TN | 2.0 | 2.0 | 1350 | $2,875 | $2.13 | 21d | 1 | 1.21mi |
| 453 E Main St #400 Kingsport, TN | 2.0 | 2.0 | 1292 | $2,220 | $1.72 | 21d | 1 | 1.21mi |
Listing history 4 events
-
2026-05-04status Pending
-
2026-05-01status Active
-
2026-04-13status Pending
-
2026-04-10$159,900 Active
ⓘ Source: listings_history table (triggers on properties + properties_extension) + one-shot
backfill from property_details.listing_events for pre-trigger history.
Tax reassessment forecast TN · Resets to sale price
- Current annual tax
- $1,187 · $99/mo
- Projected year-2 tax
- $1,187 · $99/mo
- Expected delta
- $0/yr ($0/mo · 0.0%)
ⓘ Screening estimate from a state-policy table — verify with the county assessor before closing.
Climate risk First Street
- Flood 1/10 Low FEMA zone X (unshaded) · 0% chance over 30 yrs
- Wildfire 1/10 Low
- Heat 5/10 Major 7 d/yr ≥101°F today · 22 d/yr by 30 yrs out
- Wind 2/10 Low
- Air quality 1/10 Low 0 unhealthy d/yr today · 0 by 30 yrs out
Nearby sold comps map
Loading sold comps map…
Walkable amenities ~0.75 mi
Loading nearby amenities…
Taxation est. · year 1
- Rental income
- $21,418
- − Mortgage interest
- −$8,957
- − Property taxes
- −$1,187
- − Insurance
- −$800
- − Repairs & maintenance
- −$1,713
- − Management
- −$1,713
- − Depreciation
- −$4,652
- Taxable income
- $2,396
- Est. tax owed @ 24.0%
- −$575
- After-tax cash flow
- $4,296/yr
For passive investors: Depreciation is non-cash, so a rental often shows a tax loss while cash-flowing — sheltering income. Rental losses are passive: they offset passive income freely, and up to $25,000/yr can offset ordinary (W-2) income if you actively participate and your MAGI is under $100k (phasing out to $0 by $150k); unused losses carry forward. On sale, claimed depreciation is recaptured at up to 25%, and gains may owe capital-gains tax (a 1031 exchange can defer both). Figures are a year-1 estimate at your 24.0% rate — not tax advice; consult a CPA.
Schools (NCES district)
- District
- Kingsport
- NCES district ID
- 4702190
- Math proficiency
- 35% ▼ -12.00%
- Reading proficiency
- 38% ▼ -5.00%
- Median HH income
- $38,017
- Composite
- 30.44/100
- National rank
- #6233
- State rank
- #26 of 139 in TN
Livability — Kingsport
- Score
- 71/100
- State rank
- #39
- US rank
- #6587
Category grades
Schools grade is shown separately in the Schools card above.
Census & demographics
- Census place
- Kingsport, TN
- County
- Sullivan County · 121,987 people
- City population
- 83,493
- Metro
- Kingsport-Bristol, TN-VA
- Population (ZIP)
- 40,996
- Household income
- $49,191
- Rent vs Own
- Severe rent burden
- 1384.0
Population outlook (Sullivan County) Hauer SSP2
- Today (2025)
- 157,030 people
- By 2030
- 156,415 · -0.4%
- By 2040
- 153,778 · -2.1%
- By 2050
- 149,018 · -5.1%
- By 2075
- 138,068 · -12.1%
- By 2100
- 119,927 · -23.6%
Race, ethnicity, and origin ACS 2023
- Neighborhood character
- Predominantly White (88%)
- Race & ethnicity
- White 88% Two or more races 4% Black 4% Hispanic / Latino 3%
- Common ancestry
- Serbian 3% Slovak 3% Italian 1%
- Foreign-born
- 2% · Canada
- Languages at home
- 98% English-only · Spanish 2%
Political lean MEDSL · Sullivan
- 2024 margin
- Solid R (+55.0) · D 22.0% · R 77.0% · Other 1.0%
- 2008→2024 swing
- -13.6pp toward R · 2008: -41.3pp · 2024: -55.0pp
- All cycles
- 2024: R+55.0 2020: R+51.9 2016: R+56.2 2012: R+47.2 2008: R+41.3
Not yet ingested
- Civics
- —
Market trends
- HPI YoY
- ▼ -80.93%
- Current HPI
- 252.9821
- Rent YoY
- ▲ 7.95%
- Metro
- Kingsport-Bristol, TN-VA
- State GDP YoY
- ▲ 2.78%
- F500 in state
- 22
Industry mix (Fortune 500 HQ in TN)
| Industry | F500 HQs | Revenue |
|---|---|---|
| Healthcare | 3 | $91B |
|
||
| Retail | 3 | $72B |
|
||
| Transportation / Logistics | 1 | $88B |
|
||
| Paper / Packaging | 1 | $19B |
|
||
| Insurance | 1 | $13B |
|
||
| Energy | 1 | $12B |
|
||
Price history
4 events — show timeline
- 2026-05-04 Pending — TVRMLS
- 2026-05-01 Relisted — TVRMLS
- 2026-04-13 Pending — TVRMLS
- 2026-04-10 Listed $159,900 TVRMLS
Property tax history
+4.2%/yrLatest (2025): $1,187 · +37.1% YoY. Source: county tax records.
Cash-flow waterfall
monthlySold comps — $/sqft
last 12 mo · ≤1 miLoading sold comps…