 🏷️ Likely Rental
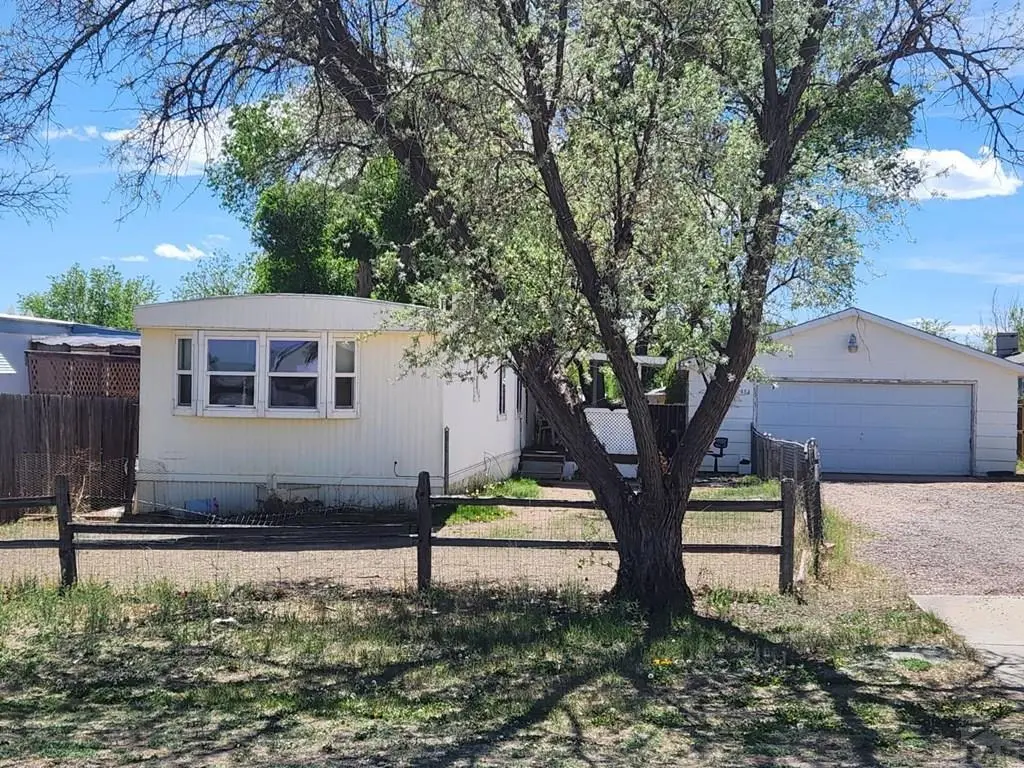
356 E Walton Dr · Pueblo West, CO
Flood risk 1/10 · Minimal
- FEMA flood zone
- X (unshaded)
- Chance of flooding over 30 yrs
- 0.0%
- Est. flood insurance / yr
- $473 – $860
Fire risk 5/10 · Moderate
- Est. fire insurance / yr
- $939 – $1,743
Heat risk 4/10 · Minor
- Hot days now (above 96°F)
- 6 days/yr
- Hot days in 30 yrs
- 16 days/yr
Wind risk 2/10 · Minimal
- Chance of severe wind over 30 yrs
- —
Air-quality risk 1/10 · Minimal
- Unhealthy air days now
- 0 days/yr
- Unhealthy air days in 30 yrs
- 0 days/yr
Risk factors via First Street. Map © Google.
Why this score? — see what drove the B grade
The composite is a weighted blend of 9 inputs, each scored 0–100. Each bar is that input's sub-score; the figure is the points it added to the 100-point composite (weight × sub-score).
- Cash flow +29.4/30.0
- ARV discount +15.0/15.0
- DSCR +10.0/10.0
- 1% rule +8.2/10.0
- Livability +3.2/5.0
- Schools +3.0/10.0
- Rent growth +2.5/5.0
- Condition / age +2.5/5.0
- Appreciation +0.0/10.0
$125,000
🖨 Deal sheet 📄 Offer letter ✓ Due diligence
Listing remarks
Lowest price residentiol property in Pueblo West. SOLD AS IS !! Seller in process of purging. CASH SALE only, no loans no owner carry. Tenant in place for new buyer to negotiate a new lease. 4 hour notice required on all showings. Needs some love but overall in decent shape and comes with all the appliances and a HUGE 2 car detached garage. Garage roof only 3 years old. Seller will make no repairs, as is. Interior photos to follow.
Key facts
- 6,534 sq ft lot
- 2 garage spots
- Built 1982
Property features AI
Finance
- HOA & community: No association amenities
Exterior
- Parking: Detached garage; 2 garage spaces
- Security: Smoke detector(s)
- Utilities: Public water; Public sewer
- Home design: Manufactured home (residential); Single-story
- Construction: Frame construction with metal siding; Composition roof
- Exterior features: Covered patio; Patio; Wood fencing; Irregular lot
Interior
- Kitchen: Range; Oven; Refrigerator
- Bedrooms: 2 main-level bedrooms
- Flooring: Carpet
- Bathrooms: 2 full bathrooms (both on main level)
- Heating & cooling: Natural gas forced-air heating; Evaporative cooling; Ceiling fans
- Interior features: Ceiling fans; Walk-in closet(s); Primary bedroom on main level; Double-pane windows; Smoke detectors
- Laundry & utility: Washer; Dryer; Laundry on main level
Neighborhood map
What this means for you Summary
Snapshot
- This is a 2-bed/2.0-bath manufactured listed at $125k.
Deal economics
- At list price, monthly cash flow is $442 ($5k/yr) — positive.
- The deal already cash-flows at list — no discount required.
- Meets the 1% rule at list price ($2k rent vs $125k).
- Recommended offer: $118k (6.0% below list) — sets the bar for market timing.
- Cap rate 10.5% vs local median 3.6% in Pueblo West — top-decile yield for the area; either an underpriced asset or a hidden risk that comps aren't pricing in. Stress-test before assuming the spread holds.
Location & tenants
- Location reads 63/100 on livability (#189 in CO) — a middle-class / working-renter tenant base. Strengths: housing A+, employment B+; Watch: health & safety C-, schools D+, crime F.
- Pueblo County School District 70 (suburban): math 24% / reading 43% proficiency, ranked #40 of 86 in CO (top 46%) — families likely to look elsewhere, expect single-tenant / working-renter base with shorter leases.
- Market conditions: Rents soft (-0.1%/yr); 633 active listings in the ZIP; 10 comparable units currently listed for rent nearby; rentals leasing fast (median 13d on market — plan ~1-2 weeks tenant-placement turnaround); solid renter incomes; 269 units permitted in Pueblo County in 2024 (0 in 5+ unit buildings).
Forward outlook
- Local home prices are declining (-3.0%/yr); year-one equity from $864 of loan paydown is wiped out by about $4k of value loss. Plan a longer hold.
- Pueblo County population projected at +10% by 2050 — modest demand growth; plan on rents tracking national, not racing it.
Negotiation context
- It's been on market 65 days — a 6% lower offer ($118k) is reasonable based on typical stale-listing flexibility.
- 3 sale attempts since 18y ago with the ask held roughly flat each time — persistent listings suggest the price (not the market) is what's stuck; bring a comps-based counter.
Risks & watch-outs
- Climate carrying-cost: moderate wildfire risk — expect insurance premiums to compound above CPI over the hold.
Questions for the listing agent
- It's been on market 65 days. Have you received any prior offers? Is the seller open to a 6% concession, seller financing, or rate buy-down credit?
- Why hasn't it sold? Are there any deal-killer items the seller is aware of (foundation, flood, title, zoning, code violations)?
- Is there a deadline driving the sale (1031 exchange, divorce, estate, relocation)? That informs how much negotiation room exists.
- Schools are D-rated, which usually means shorter tenancies and higher turnover. Who's the typical renter profile here, and what's been the actual vacancy rate?
- Crime grade is F in this area — have there been break-ins, vandalism, or insurance claims at this property in the last 3 years? What carrier currently insures it and at what premium?
- What's the average days-on-market for RENTAL listings here right now (not sales)? A rising rental-DOM trend means longer vacancies and softer asking-rent achievability than the comps imply.
- What's the recent tenant-quality profile in this submarket — average credit score on applications, eviction rate, late-payment / NSF rate, and stable-employment percentage? A property-management company in the area should have these aggregated.
- How much new for-sale + rental construction is in the pipeline within 1–3 miles? Heavy new supply typically softens prices + rents 12–24 months out; constrained supply supports both.
Investment metrics
- 1% rule
- 1.32% ✓
- Cap rate
- 10.53%
- Cash-on-cash
- 15.15%
- DSCR
- 1.67
- GRM
- 6.3
CMA / ARV
- ARV (on-the-fly)
- $157,584
- Comps found
- 11
Show comp detail 11 sales within ~0.75 mi
| Address | Dist | Beds/Ba | Sqft | Sold | Price | $/sf | Match |
|---|---|---|---|---|---|---|---|
| 376 E Stanley Dr | 0.08mi | 2/2.0 | 928 (-1%) | 1mo | $215,000 | $232 | 94 |
| 364 E Stanley Dr | 0.06mi | 3/2.0 (+1) | 960 (+2%) | 6mo | $67,000 | $70 | 84 |
| 270 E Stewart Dr | 0.25mi | 2/2.0 | 960 (+2%) | 2mo | $235,000 | $245 | 83 |
| 825 S Tolstoi Dr | 0.30mi | 3/2.0 (+1) | 938 (0%) | 6mo | $149,900 | $160 | 76 |
| 353 E Byrd Dr | 0.18mi | 3/2.0 (+1) | 1,064 (+13%) | 2mo | $180,000 | $169 | 63 |
| 256 E Byrd Dr | 0.24mi | 2/2.0 | 798 (-15%) | 8mo | $185,000 | $232 | 57 |
| 745 S Walton Dr | 0.44mi | 2/2.0 | 1,072 (+14%) | 8mo | $180,000 | $168 | 49 |
| 68 E Dante Pl | 0.52mi | 2/2.0 | 1,066 (+14%) | 8mo | $175,000 | $164 | 46 |
| 739 S Walton Dr | 0.43mi | 3/2.0 (+1) | 1,024 (+9%) | 20mo | $190,000 | $186 | 43 |
| 992 S Saki Dr | 0.74mi | 3/2.0 (+1) | 1,072 (+14%) | 5mo | $180,000 | $168 | 32 |
| 119 E Homer Dr | 0.46mi | 3/2.0 (+1) | 1,078 (+15%) | 20mo | $152,500 | $141 | 32 |
Match score weights: distance 35% · size 25% · config 20% · recency 20%. Top-matched comps best support the ARV.
Projected returns pro-forma
-3.0% appreciation · 0.0% rent growth · sell at horizon
- IRR
- 2.4%
- Equity multiple
- 1.09×
- Total profit
- $3,069
- Equity at exit
- $18,638
- IRR
- 8.8%
- Equity multiple
- 1.58×
- Total profit
- $20,294
- Equity at exit
- $10,808
Cash invested: $35,000 (down + closing). Projections, not guarantees.
Landlord ↔ Tenant lean methodology
- Overall (STATE)
- 38 Tenant-Leaning
- State Colorado
- 38 Tenant-Leaning · D+4
- County
- — inherits STATE
- City
- — inherits STATE
ZIP-level market 81007
- Home prices YoY
- -22.9%
- Rents YoY
- -0.1%
- Active inventory
- 633
- Price-to-rent
- 6.3×
Monthly cashflow live
- Estimated rent
- $1,653 high interval (Pro) →
- Mortgage (P&I)
- −$656
- Tax est. 1.5%
- −$156 /mo · $1,875/yr
- Insurance
- −$52
- HOA
- −$0
- Vacancy / Maint / Mgmt
- −$347
- Net cashflow
- $442
Break-even live
UW: 25.0% down · 7.5% · 30yr · 1.5% tax · 5.0% vac · 8.0% maint · 8.0% mgmt
Financing live
Cash to close
- Down payment
- $31,250
- Closing costs
- $3,750
- Reserves months
- —
- Total cash needed
- —
Loan-product check · same deal, 3 products live
Conventional
25% down · 7.5% · 30yr
- Down + closing
- —
- Monthly P&I
- —
- Monthly cashflow
- —
- DSCR
- —
- Eligible?
- —
Personal DTI + credit; lowest rate.
DSCR
20% down · 8.5% · 30yr
- Down + closing
- —
- Monthly P&I
- —
- Monthly cashflow
- —
- DSCR
- —
- Eligible?
- —
No personal income docs; deal must DSCR.
Hard money
10% down · 12.0% · 12mo
- Down + closing
- —
- Monthly P&I
- —
- Monthly cashflow
- —
- DSCR
- —
- Eligible?
- —
Short-term bridge; refi at stabilization.
Rent comps 10 comps
| Address | Beds | Baths | Sqft | Rent | $/sqft | DOM | Units | Dist |
|---|---|---|---|---|---|---|---|---|
| 655 S Inca Dr Pueblo, CO | 3.0 | 2.0 | 1008 | $2,000 | $1.98 | 13d | 1 | 0.52mi |
| 512 S Aguilar Dr Pueblo West, CO | 1.0–2.0 | 1.5 | 825 | $1,185 | $1.44 | 13d | 2 | 0.92mi |
| 692 E Hahns Peak Ave Pueblo West, CO | 3.0 | 2.0 | 1100 | $2,000 | $1.82 | 13d | 1 | 1.07mi |
| 690 E Hahns Peak Ave Pueblo, CO | 3.0 | 2.0 | 1100 | $2,000 | $1.82 | 13d | 1 | 1.07mi |
| 82 W Baldwyn Dr Unit 86 Pueblo West, CO | 3.0 | 2.0 | 1100 | $1,700 | $1.55 | 21d | 1 | 1.16mi |
| 82 W Baldwyn Dr #88 Pueblo, CO | 3.0 | 2.0 | 1100 | $1,700 | $1.55 | 13d | 1 | 1.16mi |
| 667 E Clarion Dr Unit D Pueblo West, CO | 2.0 | 1.0 | 900 | $1,400 | $1.56 | 13d | 1 | 1.24mi |
| 531 S Angus Ave Apt 11 Pueblo West, CO | 2.0 | 1.0 | 768 | $1,359 | $1.77 | 13d | 1 | 1.37mi |
| 531 S Angus Ave Apt 2 Pueblo West, CO | 2.0 | 1.0 | 768 | $1,299 | $1.69 | 13d | 1 | 1.39mi |
| 531 S Angus Ave Unit 13 Pueblo West, CO | 2.0 | 1.0 | 768 | $1,250 | $1.63 | 13d | 1 | 1.39mi |
Listing history 20 events
-
2026-06-19days on market $125,000 Active 65 DOM
-
2026-06-18days on market $125,000 Active 64 DOM
-
2026-06-17days on market $125,000 Active 63 DOM
-
2026-06-16days on market $125,000 Active 62 DOM
-
2026-06-15days on market $125,000 Active 61 DOM
-
2026-06-14days on market $125,000 Active 59 DOM
-
2026-06-13days on market $125,000 Active 58 DOM
-
2026-06-10days on market $125,000 Active 56 DOM
-
2026-06-09days on market $125,000 Active 55 DOM
-
2026-06-08days on market $125,000 Active 54 DOM
-
2026-06-07days on market $125,000 Active 53 DOM
-
2026-06-05days on market $125,000 Active 50 DOM
-
2026-06-03days on market $125,000 Active 49 DOM
-
2026-06-02days on market $125,000 Active 48 DOM
-
2026-06-01days on market $125,000 Active 47 DOM
-
2026-05-31days on market $125,000 Active 46 DOM
-
2026-05-30days on market $125,000 Active 45 DOM
-
2026-04-15$125,000 Active
-
2011-07-27$39,900
-
2008-07-23$69,900
ⓘ Source: listings_history table (triggers on properties + properties_extension) + one-shot
backfill from property_details.listing_events for pre-trigger history.
Climate risk First Street
- Flood 1/10 Low FEMA zone X (unshaded) · 0% chance over 30 yrs
- Wildfire 5/10 Major
- Heat 4/10 Moderate 6 d/yr ≥96°F today · 16 d/yr by 30 yrs out
- Wind 2/10 Low
- Air quality 1/10 Low 0 unhealthy d/yr today · 0 by 30 yrs out
Nearby sold comps map
Loading sold comps map…
Walkable amenities ~0.75 mi
Loading nearby amenities…
Taxation est. · year 1
- Rental income
- $19,834
- − Mortgage interest
- −$7,002
- − Property taxes
- −$1,875
- − Insurance
- −$625
- − Repairs & maintenance
- −$1,587
- − Management
- −$1,587
- − Depreciation
- −$3,636
- Taxable income
- $3,522
- Est. tax owed @ 24.0%
- −$845
- After-tax cash flow
- $4,457/yr
For passive investors: Depreciation is non-cash, so a rental often shows a tax loss while cash-flowing — sheltering income. Rental losses are passive: they offset passive income freely, and up to $25,000/yr can offset ordinary (W-2) income if you actively participate and your MAGI is under $100k (phasing out to $0 by $150k); unused losses carry forward. On sale, claimed depreciation is recaptured at up to 25%, and gains may owe capital-gains tax (a 1031 exchange can defer both). Figures are a year-1 estimate at your 24.0% rate — not tax advice; consult a CPA.
Schools (NCES district)
- District
- Pueblo County School District 70
- NCES district ID
- 0806150
- Math proficiency
- 24% ▼ -4.00%
- Reading proficiency
- 43% ▼ -2.00%
- Median HH income
- $59,438
- Composite
- 29.93/100
- National rank
- #6381
- State rank
- #40 of 86 in CO
Livability — Pueblo West
- Score
- 63/100
- State rank
- #189
- US rank
- #15760
Category grades
Schools grade is shown separately in the Schools card above.
Census & demographics
- Census place
- Pueblo West, CO
- County
- Pueblo County · 151,887 people
- Metro
- Pueblo, CO
- Population (ZIP)
- 35,690
- Household income
- $96,713
- Rent vs Own
- Severe rent burden
- 353.0
Population outlook (Pueblo County) Hauer SSP2
- Today (2025)
- 173,240 people
- By 2030
- 177,716 · +2.6%
- By 2040
- 185,125 · +6.9%
- By 2050
- 190,642 · +10.0%
- By 2075
- 201,611 · +16.4%
- By 2100
- 196,443 · +13.4%
Race, ethnicity, and origin ACS 2023
- Neighborhood character
- Predominantly White (65%)
- Race & ethnicity
- White 65% Hispanic / Latino 29% Two or more races 11% Asian 1% Black 1%
- Hispanic origin (detail)
- Mexican 19%
- Common ancestry
- Romanian 2% Lithuanian 2% Italian 2%
- Foreign-born
- 4% · Canada
- Languages at home
- 92% English-only · Spanish 7%
Political lean MEDSL · Pueblo
- 2024 margin
- Lean R (+5.1) · D 46.2% · R 51.3% · Other 2.5%
- 2008→2024 swing
- -20.1pp toward R · 2008: 15.0pp · 2024: -5.1pp
- All cycles
- 2024: R+5.1 2020: D+1.7 2016: D+0.3 2012: D+13.1 2008: D+15.0
Not yet ingested
- Civics
- —
Market trends
- HPI YoY
- ▼ -82.80%
- Current HPI
- 279.191
- Rent YoY
- ▼ -0.10%
- Metro
- Pueblo, CO
- State GDP YoY
- ▲ 1.95%
- F500 in state
- 14
Industry mix (Fortune 500 HQ in CO)
| Industry | F500 HQs | Revenue |
|---|---|---|
| Technology Distribution | 1 | $31B |
|
||
| Food / Agriculture | 1 | $18B |
|
||
| Packaging | 1 | $14B |
|
||
| Healthcare | 1 | $13B |
|
||
| Energy | 1 | $10B |
|
||
| Technology | 1 | $4B |
|
||
Price history
+78.8% since first listed3 events — show timeline
- 2026-04-15 Listed $125,000 PARMLS
- 2011-07-27 Listed $39,900 PARMLS
- 2008-07-23 Listed $69,900 PARMLS
Property tax history
-4.1%/yrLatest (2021): $110 · -25.7% YoY. Source: county tax records.
Cash-flow waterfall
monthlySold comps — $/sqft
last 12 mo · ≤1 miLoading sold comps…