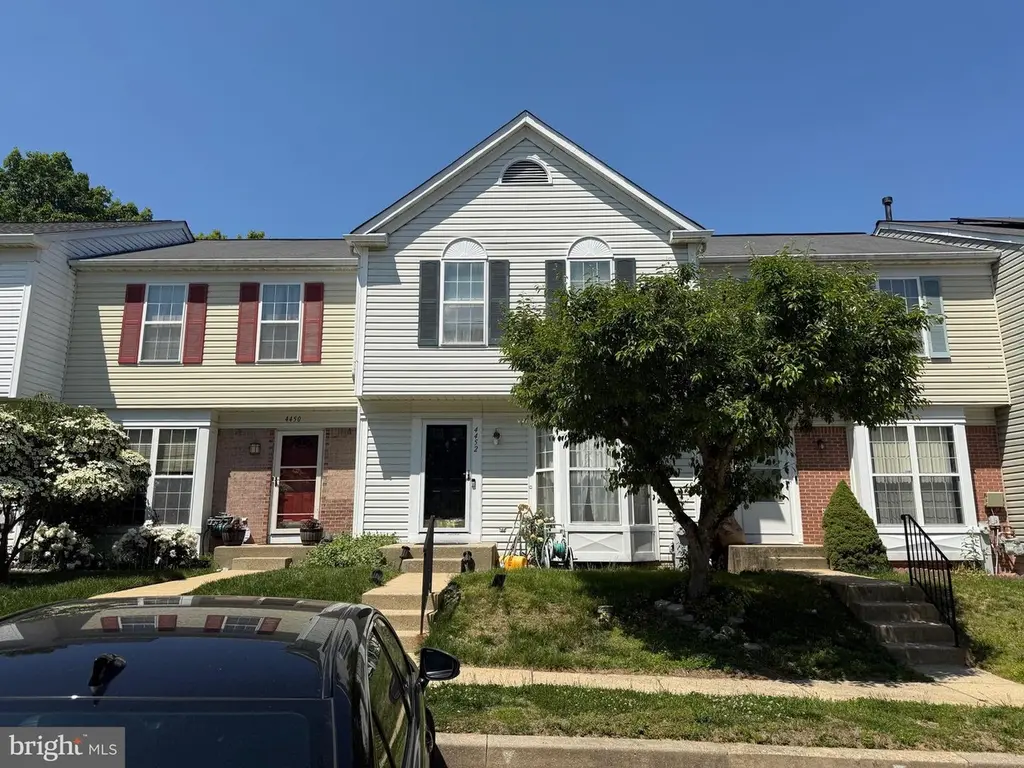
4452 Kentford Rd · Owings Mills, MD
Flood risk 1/10 · Minimal
- FEMA flood zone
- X (unshaded)
- Chance of flooding over 30 yrs
- 0.0%
- Est. flood insurance / yr
- $473 – $860
Fire risk 3/10 · Minor
- Est. fire insurance / yr
- $755 – $1,403
Heat risk 6/10 · Moderate
- Hot days now (above 103°F)
- 7 days/yr
- Hot days in 30 yrs
- 15 days/yr
Wind risk 4/10 · Minor
- Chance of severe wind over 30 yrs
- 16.0%
Air-quality risk 2/10 · Minimal
- Unhealthy air days now
- 1 days/yr
- Unhealthy air days in 30 yrs
- 2 days/yr
Risk factors via First Street. Map © Google.
Why this score? — see what drove the D+ grade
The composite is a weighted blend of 9 inputs, each scored 0–100. Each bar is that input's sub-score; the figure is the points it added to the 100-point composite (weight × sub-score).
- ARV discount +14.6/15.0
- Cash flow +12.2/30.0
- 1% rule +4.3/10.0
- Livability +4.0/5.0
- DSCR +3.6/10.0
- Rent growth +3.2/5.0
- Condition / age +2.5/5.0
- Schools +2.3/10.0
- Appreciation +0.0/10.0
$275,000
🖨 Deal sheet 📄 Offer letter ✓ Due diligence
Listing remarks
3 level home with numerous overflow parking. Lots of potential. The home qualifies for the MMCT (majority minority census tract) Program. No PMI, 620 minimum credit score, $5000 grant at settlement, $5,000 community uplift program (Baltimore MSA) for down payment in addition to the grant of $5000. Both first-time buyers and repeat buyers are eligible. Ask me.
Key facts
- $90 HOA
- Built 1996
- Listed 9 days
Property features AI
Finance
- Other: Ownership is fee simple
- HOA & community: HOA fee of $90 per month
Exterior
- Parking: Off-street parking
- Utilities: Public water; Public sewer; Cooling: other
- Home design: Interior townhouse/rowhouse; Vinyl siding
- Construction: Slab foundation; Above-grade and below-grade structures
- Exterior features: No tidal water
Interior
- Bedrooms: Three bedrooms on the upper level
- Bathrooms: Two full bathrooms (all upper levels); One half bathroom on the main level
- Heating & cooling: Heat pump(s); Central heating fuel; 60+ gallon hot water tank
- Interior features: Basement with connecting stairway; Living area measured per assessor
Neighborhood map
What this means for you Summary
Snapshot
- This is a 3-bed/2.5-bath townhouse listed at $275k.
Deal economics
- At list price, monthly cash flow is $-57 ($-682/yr) — negative.
- To cash-flow at today's rent, offer at most $265k (3.7% below list).
- To meet the 1% rule (rent ≥ 1% of price), the offer needs to be $256k (7.1% below list).
- Recommended offer: $256k (7.1% below list) — sets the bar for 1% rule.
- Cap rate 6.0% vs local median 3.9% in Owings Mills — top-decile yield for the area; either an underpriced asset or a hidden risk that comps aren't pricing in. Stress-test before assuming the spread holds.
Location & tenants
- Location reads 79/100 on livability (#57 in MD, #2,037 nationally) — a middle-class / working-renter tenant base. Strengths: commute A+, employment A+, housing A+; Watch: cost of living C-, amenities D, schools D-.
- Baltimore County Public Schools (suburban): math 15% / reading 34% proficiency, ranked #11 of 24 in MD (top 46%) — low school quality limits family demand, transient renter base, plan for 1-2y turnover.
- Market conditions: Rents rising (+2.9%/yr); 170 active listings in the ZIP; 40 comparable units currently listed for rent nearby; rentals at typical pace (median 24d on market — plan ~3-4 weeks tenant-placement turnaround); 40% of comp listings sitting > 30 days — soft ceiling on asking rent; solid renter incomes; 1,511 units permitted in Baltimore County in 2024 (643 in 5+ unit buildings).
- This rent runs 30% of the median local income ($102k/yr) — at the standard rent-burdened threshold; future hikes will face affordability resistance.
Forward outlook
- Local home prices are declining (-3.0%/yr); year-one equity from $2k of loan paydown is wiped out by about $8k of value loss. Plan a longer hold.
- Baltimore County population projected at +12% by 2050 — modest demand growth; plan on rents tracking national, not racing it.
Negotiation context
- Only 10 days on market — expect competitive offers; lowballing is unlikely to land.
- 2 sale attempts since 23y ago with the ask held roughly flat each time — persistent listings suggest the price (not the market) is what's stuck; bring a comps-based counter.
- Current owner paid $165k; list at $275k implies a 67% gain — meaningful room to come down on a strong offer.
Risks & watch-outs
- Climate carrying-cost: extreme-heat days projected 7→15/yr by 2055 (HVAC capex compounding) — expect insurance premiums to compound above CPI over the hold.
Questions for the listing agent
- What do current leases actually rent for vs. the listed asking? Can we see a recent rent roll and the last 12 months of T-12 income?
- What does the HOA fee cover, when was the last increase, and are there any pending special assessments or reserve-fund shortfalls?
- Is there a deadline driving the sale (1031 exchange, divorce, estate, relocation)? That informs how much negotiation room exists.
- Schools are D-rated, which usually means shorter tenancies and higher turnover. Who's the typical renter profile here, and what's been the actual vacancy rate?
- Crime grade is D in this area — have there been break-ins, vandalism, or insurance claims at this property in the last 3 years? What carrier currently insures it and at what premium?
- The area grade is low — what's the realistic commute time and amenity access for the typical tenant pool here? Any planned neighborhood developments (good or bad) we should know about?
- What's the average days-on-market for RENTAL listings here right now (not sales)? A rising rental-DOM trend means longer vacancies and softer asking-rent achievability than the comps imply.
- What's the recent tenant-quality profile in this submarket — average credit score on applications, eviction rate, late-payment / NSF rate, and stable-employment percentage? A property-management company in the area should have these aggregated.
- How much new for-sale + rental construction is in the pipeline within 1–3 miles? Heavy new supply typically softens prices + rents 12–24 months out; constrained supply supports both.
Investment metrics
- 1% rule
- 0.93% ✗
- Cap rate
- 6.04%
- Cash-on-cash
- -0.89%
- DSCR
- 0.96
- GRM
- 9.0
CMA / ARV
- ARV (on-the-fly)
- $326,308
- Comps found
- 12
Show comp detail 12 sales within ~0.75 mi
| Address | Dist | Beds/Ba | Sqft | Sold | Price | $/sf | Match |
|---|---|---|---|---|---|---|---|
| 4427 Kentford Rd | 0.06mi | 3/3.0 | 1,652 (-2%) | 0mo | $380,000 | $230 | 92 |
| 9500 Side Brook Rd #304 | 0.38mi | 2/2.5 (-1) | 1,610 (-4%) | 6mo | $329,000 | $204 | 65 |
| 4500 Chaucer Way #403 | 0.52mi | 2/2.0 (-1) | 1,642 (-2%) | 2mo | $290,000 | $177 | 64 |
| 9905 Bon Haven Ln | 0.47mi | 3/2.5 | 1,540 (-8%) | 7mo | $324,900 | $211 | 58 |
| 16 Cypress Grv | 0.30mi | 3/3.5 | 1,856 (+10%) | 10mo | $369,000 | $199 | 57 |
| 9 Bannock Ct | 0.74mi | 3/2.5 | 1,744 (+4%) | 4mo | $255,000 | $146 | 56 |
| 4600 Alcott Way #401 | 0.54mi | 2/2.0 (-1) | 1,809 (+8%) | 4mo | $225,000 | $124 | 52 |
| 9537 Branchleigh Rd | 0.70mi | 3/2.5 | 1,600 (-5%) | 10mo | $310,000 | $194 | 51 |
| 4133 Brown Bark Cir | 0.68mi | 3/2.5 | 1,824 (+8%) | 8mo | $350,000 | $192 | 48 |
| 13 Aspen Glen Ct | 0.30mi | 4/3.5 (+1) | 1,920 (+14%) | 11mo | $360,000 | $188 | 44 |
| 4313 Plinlimmon Dr | 0.65mi | 4/3.5 (+1) | 1,848 (+10%) | 3mo | $499,995 | $271 | 42 |
| 4606 Mews Dr | 0.74mi | 3/3.0 | 1,934 (+15%) | 4mo | $320,000 | $165 | 36 |
Match score weights: distance 35% · size 25% · config 20% · recency 20%. Top-matched comps best support the ARV.
Projected returns pro-forma
-3.0% appreciation · 2.87% rent growth · sell at horizon
- IRR
- -17.8%
- Equity multiple
- 0.37×
- Total profit
- $-48,369
- Equity at exit
- $41,003
- IRR
- -10.2%
- Equity multiple
- 0.38×
- Total profit
- $-47,552
- Equity at exit
- $23,777
Cash invested: $77,000 (down + closing). Projections, not guarantees.
Landlord ↔ Tenant lean methodology
- Overall (STATE)
- 27 Tenant-Leaning
- State Maryland
- 27 Tenant-Leaning · D+14
- County
- — inherits STATE
- City
- — inherits STATE
ZIP-level market 21117
- Rents YoY
- 2.9%
- Active inventory
- 170
- Price-to-rent
- 9.0×
Monthly cashflow live
- Estimated rent
- $2,556 high interval (Pro) →
- Mortgage (P&I)
- −$1,442
- Tax from tax record
- −$429 /mo · $5,150/yr
- Insurance
- −$115
- HOA
- −$90
- Vacancy / Maint / Mgmt
- −$537
- Net cashflow
- $-57
Break-even live
UW: 25.0% down · 7.5% · 30yr · 1.5% tax · 5.0% vac · 8.0% maint · 8.0% mgmt
Financing live
Cash to close
- Down payment
- $68,750
- Closing costs
- $8,250
- Reserves months
- —
- Total cash needed
- —
Loan-product check · same deal, 3 products live
Conventional
25% down · 7.5% · 30yr
- Down + closing
- —
- Monthly P&I
- —
- Monthly cashflow
- —
- DSCR
- —
- Eligible?
- —
Personal DTI + credit; lowest rate.
DSCR
20% down · 8.5% · 30yr
- Down + closing
- —
- Monthly P&I
- —
- Monthly cashflow
- —
- DSCR
- —
- Eligible?
- —
No personal income docs; deal must DSCR.
Hard money
10% down · 12.0% · 12mo
- Down + closing
- —
- Monthly P&I
- —
- Monthly cashflow
- —
- DSCR
- —
- Eligible?
- —
Short-term bridge; refi at stabilization.
Rent comps 40 comps
| Address | Beds | Baths | Sqft | Rent | $/sqft | DOM | Units | Dist |
|---|---|---|---|---|---|---|---|---|
| 4603 Lathe Rd Owings Mills, MD | 2.0 | 1.0 | 2100 | $2,600 | $1.24 | 5d | 1 | 0.13mi |
| 4700 Winterset Way Owings Mills, MD | 2.0–3.0 | 1.0–2.0 | 1118 | $2,431 | $2.17 | 2d | 18 | 0.17mi |
| 9711 Bon Haven Ln Owings Mills, MD | 3.0 | 2.5 | 1572 | $2,800 | $1.78 | 44d | 1 | 0.28mi |
| 16 Cypress Grove Ct Owings Mills, MD | 3.0 | 3.5 | 1856 | $3,200 | $1.72 | 44d | 1 | 0.30mi |
| 9821 Bon Haven Ln Owings Mills, MD | 3.0 | 2.5 | 1576 | $2,650 | $1.68 | 44d | 1 | 0.41mi |
| 4810 Coyle Rd Owings Mills, MD | 2.0–3.0 | 2.0 | 1792 | $2,930 | $1.64 | 24d | 9 | 0.53mi |
| 4604 Owings Run Rd Owings Mills, MD | 1.0–3.0 | 2.0 | 1102 | $2,374 | $2.15 | 2d | 22 | 0.60mi |
| 4606 Cascade Mills Dr Owings Mills, MD | 1.0–2.0 | 1.0–2.0 | 1300 | $2,407 | $1.85 | 2d | 19 | 0.61mi |
| 9421 Adelaide Ln Owings Mills, MD | 3.0 | 2.5 | 2236 | $2,899 | $1.30 | 24d | 1 | 0.64mi |
| 9454 James Macgowan Ln #447 Owings Mills, MD | 2.0 | 2.5 | 1708 | $2,850 | $1.67 | 44d | 1 | 0.64mi |
| 4300 Flint Hill Dr Owings Mills, MD | 1.0–3.0 | 1.0–2.0 | 1050 | $2,527 | $2.41 | 2d | 30 | 0.67mi |
| 4108 Springsleigh Rd Randallstown, MD | 3.0 | 2.0 | 1752 | $2,295 | $1.31 | 22d | 1 | 0.69mi |
| 4112 Brown Bark Cir Randallstown, MD | 3.0 | 2.5 | 1824 | $2,959 | $1.62 | 11d | 1 | 0.73mi |
| 4254 Cayuga Rd Randallstown, MD | 3.0 | 4.0 | 1760 | $2,400 | $1.36 | 44d | 1 | 0.76mi |
| 9324 Town Place Dr Owings Mills, MD | 2.0 | 2.5 | 1760 | $2,400 | $1.36 | 24d | 1 | 0.81mi |
| 9902 Cervidae Ln Randallstown, MD | 1.0–3.0 | 1.0–2.0 | 1257 | $2,026 | $1.61 | 2d | 22 | 0.84mi |
| 5212 Stone Shop Cir Owings Mills, MD | 2.0 | 2.0 | 1130 | $1,900 | $1.68 | 24d | 1 | 0.91mi |
| 4983 Lockard Dr Owings Mills, MD | 3.0 | 2.5 | 1654 | $2,600 | $1.57 | 3d | 1 | 0.95mi |
| 3901 Noyes Cir Randallstown, MD | 1.0–3.0 | 1.0–3.0 | 1196 | $2,254 | $1.88 | 19d | 27 | 0.98mi |
| 4733 Buxton Cir Owings Mills, MD | 3.0 | 4.0 | 1752 | $2,700 | $1.54 | 44d | 1 | 1.00mi |
| 4200 Deer Park Rd Unit 1 Randallstown, MD | 4.0 | 2.0 | 1200 | $2,400 | $2.00 | 3d | 1 | 1.02mi |
| 3971 Red Deer Cir Randallstown, MD | 3.0 | 3.5 | 1400 | $2,400 | $1.71 | 12d | 1 | 1.03mi |
| 9357 Owings Choice Ct Owings Mills, MD | 3.0 | 2.5 | 2000 | $2,750 | $1.38 | 44d | 1 | 1.04mi |
| 4826 Buxton Cir Owings Mills, MD | 3.0 | 2.5 | 1595 | $2,700 | $1.69 | 44d | 1 | 1.05mi |
| 9204 Appleford Cir Owings Mills, MD | 1.0–3.0 | 1.0–2.5 | 1001 | $2,551 | $2.55 | 2d | 22 | 1.06mi |
| 4717 Wainwright Cir Owings Mills, MD | 4.0 | 3.5 | 2112 | $3,500 | $1.66 | 44d | 1 | 1.08mi |
| 9745 Reese Farm Rd Owings Mills, MD | 2.0 | 2.0 | 1193 | $2,125 | $1.78 | 44d | 1 | 1.15mi |
| 9401 Groveton Cir Owings Mills, MD | 1.0–3.0 | 1.0–2.0 | 1158 | $2,800 | $2.42 | 2d | 15 | 1.15mi |
| 3 Rebecca Ln Owings Mills, MD | 3.0 | 2.5 | 1730 | $2,775 | $1.60 | 44d | 1 | 1.15mi |
| 9210 Leigh Choice Ct Owings Mills, MD | 3.0 | 2.5 | 1607 | $2,640 | $1.64 | 44d | 1 | 1.16mi |
| 4925 Riders Ct #4925 Owings Mills, MD | 2.0 | 2.0 | 1193 | $1,900 | $1.59 | 44d | 1 | 1.16mi |
| 9224 Owings Choice Ct Owings Mills, MD | 3.0 | 2.5 | 1480 | $2,400 | $1.62 | 22d | 1 | 1.18mi |
| 3806 Byxbee Rd Randallstown, MD | 2.0 | 1.5 | 1764 | $2,450 | $1.39 | 44d | 1 | 1.23mi |
| 9102 Sandra Ct Randallstown, MD | 4.0 | 2.0 | 1600 | $2,650 | $1.66 | 20d | 1 | 1.24mi |
| 9101 Amber Oaks Way Owings Mills, MD | 2.0 | 1.0 | 1302 | $1,850 | $1.42 | 44d | 1 | 1.30mi |
| 100 Chase Mill Cir Owings Mills, MD | 1.0–3.0 | 1.0–2.0 | 939 | $2,550 | $2.71 | 2d | 12 | 1.36mi |
| 3715 Peace Chance Dr Randallstown, MD | 3.0 | 2.5 | 1960 | $2,950 | $1.51 | 18d | 1 | 1.42mi |
| 4700 Riverstone Dr Owings Mills, MD | 1.0–3.0 | 1.0–2.0 | 1055 | $2,555 | $2.42 | 2d | 24 | 1.42mi |
| 9317 Lykens Ct Randallstown, MD | 4.0 | 3.5 | 2104 | $3,499 | $1.66 | 44d | 1 | 1.43mi |
| 8813 Stone Ridge Cir #202 Pikesville, MD | 2.0 | 2.0 | 1208 | $2,200 | $1.82 | 16d | 1 | 1.43mi |
HOA detail
- Monthly dues
- $90 · $1,080/yr
Listing history 6 events
-
2026-05-16$275,000 Active
-
2003-05-09soldstatus $165,000
-
2003-04-30soldstatus $165,000
-
2003-04-04historical
-
2003-03-25$164,900
-
1996-06-10soldstatus $243,280
ⓘ Source: listings_history table (triggers on properties + properties_extension) + one-shot
backfill from property_details.listing_events for pre-trigger history.
Tax reassessment forecast MD · Partial reset (capped growth)
- Current annual tax
- $5,150 · $429/mo
- Projected year-2 tax
- $5,150 · $429/mo
- Expected delta
- $0/yr ($0/mo · 0.0%)
ⓘ Screening estimate from a state-policy table — verify with the county assessor before closing.
Climate risk First Street
- Flood 1/10 Low FEMA zone X (unshaded) · 0% chance over 30 yrs
- Wildfire 3/10 Moderate
- Heat 6/10 Major 7 d/yr ≥103°F today · 15 d/yr by 30 yrs out
- Wind 4/10 Moderate 16% chance of damaging wind over 30 yrs
- Air quality 2/10 Low 1 unhealthy d/yr today · 2 by 30 yrs out
Nearby sold comps map
Loading sold comps map…
Walkable amenities ~0.75 mi
Loading nearby amenities…
Taxation est. · year 1
- Rental income
- $30,669
- − Mortgage interest
- −$15,404
- − Property taxes
- −$5,150
- − Insurance
- −$1,375
- − Repairs & maintenance
- −$2,453
- − Management
- −$2,453
- − HOA
- −$1,080
- − Depreciation
- −$8,000
- Taxable loss
- −$5,247
- Est. tax savings @ 24.0%
- +$1,259
- After-tax cash flow
- $577/yr
For passive investors: Depreciation is non-cash, so a rental often shows a tax loss while cash-flowing — sheltering income. Rental losses are passive: they offset passive income freely, and up to $25,000/yr can offset ordinary (W-2) income if you actively participate and your MAGI is under $100k (phasing out to $0 by $150k); unused losses carry forward. On sale, claimed depreciation is recaptured at up to 25%, and gains may owe capital-gains tax (a 1031 exchange can defer both). Figures are a year-1 estimate at your 24.0% rate — not tax advice; consult a CPA.
Schools (NCES district)
- District
- Baltimore County Public Schools
- NCES district ID
- 2400120
- Math proficiency
- 15% ▼ -16.00%
- Reading proficiency
- 34% ▼ -5.00%
- Median HH income
- $66,746
- Composite
- 23.17/100
- National rank
- #7948
- State rank
- #11 of 24 in MD
Livability — Owings Mills
- Score
- 79/100
- State rank
- #57
- US rank
- #2037
Category grades
Schools grade is shown separately in the Schools card above.
Census & demographics
- Census place
- Owings Mills, MD
- County
- Baltimore County · 769,527 people
- City population
- 62,816
- Metro
- Baltimore-Columbia-Towson, MD
- Population (ZIP)
- 62,816
- Household income
- $101,831
- Rent vs Own
- Severe rent burden
- 2285.0
Population outlook (Baltimore County) Hauer SSP2
- Today (2025)
- 885,518 people
- By 2030
- 909,272 · +2.7%
- By 2040
- 951,547 · +7.5%
- By 2050
- 990,955 · +11.9%
- By 2075
- 1,086,411 · +22.7%
- By 2100
- 1,135,078 · +28.2%
Race, ethnicity, and origin ACS 2023
- Neighborhood character
- Diverse neighborhood (Simpson 0.62)
- Race & ethnicity
- Black 53% White 30% Hispanic / Latino 8% Two or more races 6% Asian 4%
- Hispanic origin (detail)
- Mexican 1% Puerto Rican 1%
- Common ancestry
- Romanian 2% Scotch-Irish 2% Lithuanian 1%
- Foreign-born
- 17% · Canada, South Korea
- Languages at home
- 83% English-only · Spanish 5% Other Indo-European 3% Russian/Polish/Slavic 3%
Political lean MEDSL · Baltimore
- 2024 margin
- Strong D (+24.5) · D 61.0% · R 36.5% · Other 2.5%
- 2008→2024 swing
- +9.9pp toward D · 2008: 14.6pp · 2024: 24.5pp
- All cycles
- 2024: D+24.5 2020: D+27.0 2016: D+17.4 2012: D+16.4 2008: D+14.6
Not yet ingested
- Civics
- —
Market trends
- HPI YoY
- ▼ -184.00%
- Current HPI
- 229.4095
- Rent YoY
- ▲ 2.87%
- Metro
- Baltimore-Columbia-Towson, MD
- State GDP YoY
- ▲ 2.97%
- F500 in state
- 12
Industry mix (Fortune 500 HQ in MD)
| Industry | F500 HQs | Revenue |
|---|---|---|
| Aerospace / Defense | 1 | $71B |
|
||
| Utilities | 1 | $25B |
|
||
| Hotels | 1 | $24B |
|
||
| Consumer Goods | 1 | $7B |
|
||
| Real Estate | 1 | $6B |
|
||
| Chemicals | 1 | $2B |
|
||
Price history
+13.0% since first listed6 events — show timeline
- 2026-05-16 Listed $275,000 BRIGHT MLS
- 2003-05-09 Sold (Public Records) $165,000 Public Records
- 2003-04-30 Sold (MLS) $165,000 MRIS
- 2003-04-04 Delisted — MRIS
- 2003-03-25 Listed $164,900 MRIS
- 1996-06-10 Sold (Public Records) $243,280 Public Records
Property tax history
+4.7%/yrLatest (2025): $5,150 · +31.2% YoY. Source: county tax records.
Cash-flow waterfall
monthlySold comps — $/sqft
last 12 mo · ≤1 miLoading sold comps…