 🔨 Auction
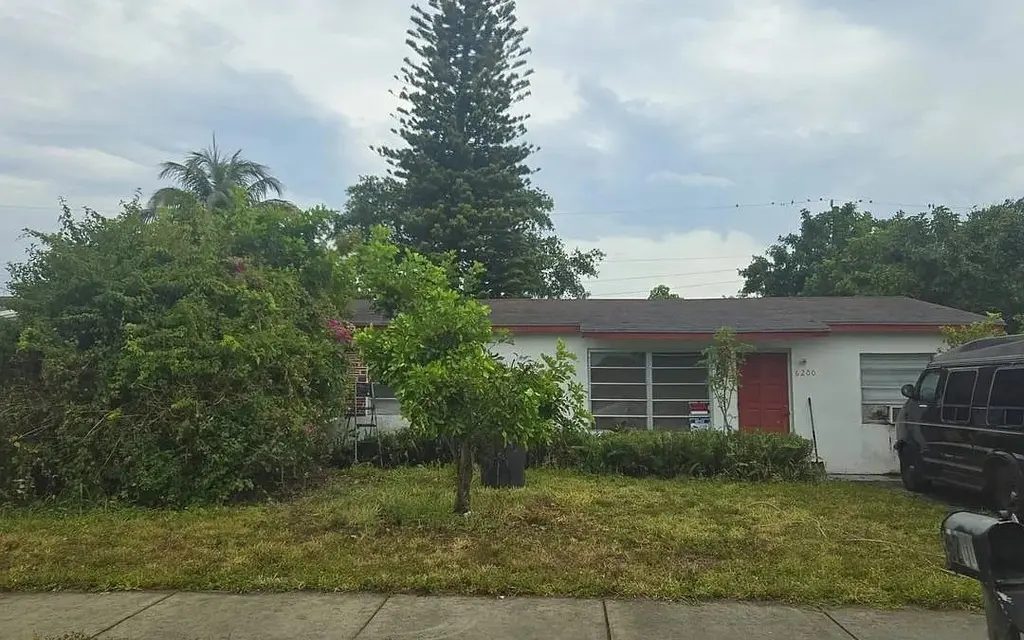
6200 SW 16th St · North Lauderdale, FL
Flood risk 1/10 · Minimal
- FEMA flood zone
- AH
- Chance of flooding over 30 yrs
- 0.0%
- Est. flood insurance / yr
- $1,142 – $2,507
Fire risk 1/10 · Minimal
- Est. fire insurance / yr
- $947 – $1,759
Heat risk 10/10 · Severe
- Hot days now (above 106°F)
- 7 days/yr
- Hot days in 30 yrs
- 26 days/yr
Wind risk 10/10 · Severe
- Chance of severe wind over 30 yrs
- 99.0%
Air-quality risk 3/10 · Minor
- Unhealthy air days now
- 3 days/yr
- Unhealthy air days in 30 yrs
- 3 days/yr
Risk factors via First Street. Map © Google.
Why this score? — see what drove the F grade
The composite is a weighted blend of 9 inputs, each scored 0–100. Each bar is that input's sub-score; the figure is the points it added to the 100-point composite (weight × sub-score).
- ARV discount +7.5/15.0
- Cash flow +7.0/30.0
- Schools +4.1/10.0
- Livability +3.8/5.0
- Condition / age +2.5/5.0
- Rent growth +2.3/5.0
- 1% rule +1.9/10.0
- DSCR +1.2/10.0
- Appreciation +0.0/10.0
$5,000
🖨 Deal sheet (PDF) 📄 Offer letter ✓ Due diligence
Listing remarks
Foreclosure Auction Ends June 09, 2026 at 10:00 AM EST. Discover this inviting 3-bedroom, 2-bathroom single-family home, offering a great opportunity in the desirable North Lauderdale area. The list price is the opening bid for the online auction. Sold As-is. Explore more details and submit your bid through Federa.
Key facts
- Garage
- Built 1958
- Listed 7 days
Property features AI
Finance
- Other: Property located at 6200 SW 16th St, Pompano Beach, FL 33068; Directions: From FL-7, head west on SW 16th St; the property is on the right at 6200 SW 16th St.
Exterior
- Parking: Garage with 1 space
- Home design: Residential property
- Exterior features: Lot in RS-5 zoning
Interior
- Bathrooms: 2 full bathrooms
- Interior features: Single-story layout
Neighborhood map
What this means for you Summary
Snapshot
- This is a 3-bed/2.0-bath single-family listed at $5k.
Deal economics
- At list price, monthly cash flow is $-720 ($-9k/yr) — negative.
- The deal already cash-flows at list — no discount required.
- Meets the 1% rule at list price ($3k rent vs $5k).
Location & tenants
- Location reads 76/100 on livability (#230 in FL, #3,635 nationally) — a middle-class / working-renter tenant base. Strengths: housing A+, health & safety A+, cost of living A; Watch: commute C-, employment D, amenities F.
- Broward (suburban): math 42% / reading 53% proficiency, ranked #46 of 73 in FL (top 63%) — families likely to look elsewhere, expect single-tenant / working-renter base with shorter leases.
- Zoned schools: Nova Blanche Forman Elementary (math 35% / reading 55%, grade D-, #1,271 of 2,144 statewide, top 60%, 769 students, 72% FRL); Nova Middle School (math 44% / reading 53%, grade C-, #274 of 571 statewide, top 50%, 1,284 students, 68% FRL); Nova High School (math 22% / reading 56%, grade F, #312 of 667 statewide, top 48%, 2,227 students, 59% FRL) — zoned schools average 66% FRL vs 51% district-wide (15 pts higher); higher-poverty schools than district average — tighter screening recommended.
- Market conditions: Rents soft (-0.7%/yr); 300 active listings in the ZIP; 40 comparable units currently listed for rent nearby; rentals at typical pace (median 26d on market — plan ~3-4 weeks tenant-placement turnaround); 2,111 units permitted in Broward County in 2024 (1,265 in 5+ unit buildings).
- At $2,709/mo this rent would consume 51% of the median local household income ($64k/yr) (locally 3073% of renters already pay >50% of income on rent) — very limited rent-growth headroom before tenants either downsize or default.
Forward outlook
- Local home prices are declining (-3.0%/yr); year-one equity from $3k of loan paydown is wiped out by about $12k of value loss. Plan a longer hold.
- Broward County population projected at +34% by 2050 — long-run rental-demand tailwind backs the buy-and-hold thesis.
Negotiation context
- Only 8 days on market — expect competitive offers; lowballing is unlikely to land.
Risks & watch-outs
- Watch-outs: property tax is 117.5% of price; flood insurance adds $152/mo; built in 1958 — expect roof / HVAC / electrical / plumbing capex.
- Climate carrying-cost: in FEMA flood zone AH (mandatory federal flood insurance); severe wind risk, 99% chance of damaging wind over 30y; extreme-heat days projected 7→26/yr by 2055 (HVAC capex compounding) — expect insurance premiums to compound above CPI over the hold.
Questions for the listing agent
- What do current leases actually rent for vs. the listed asking? Can we see a recent rent roll and the last 12 months of T-12 income?
- Built in 1958 — when were the roof, HVAC, electrical panel, plumbing, and water heater last replaced?
- Property tax is high relative to price — has the assessment been appealed recently, and will the sale trigger a re-assessment?
- What's the actual annual flood-insurance premium (NFIP or private), and is the property in a SFHA with mandatory coverage?
- Is there a deadline driving the sale (1031 exchange, divorce, estate, relocation)? That informs how much negotiation room exists.
- The area grade is low — what's the realistic commute time and amenity access for the typical tenant pool here? Any planned neighborhood developments (good or bad) we should know about?
- What's the average days-on-market for RENTAL listings here right now (not sales)? A rising rental-DOM trend means longer vacancies and softer asking-rent achievability than the comps imply.
- What's the recent tenant-quality profile in this submarket — average credit score on applications, eviction rate, late-payment / NSF rate, and stable-employment percentage? A property-management company in the area should have these aggregated.
- How much new for-sale + rental construction is in the pipeline within 1–3 miles? Heavy new supply typically softens prices + rents 12–24 months out; constrained supply supports both.
Investment metrics
- 1% rule
- 0.69% ✗
- Cap rate
- 4.55%
- Cash-on-cash
- -6.21%
- DSCR
- 0.72
- GRM
- 12.1
CMA / ARV
- ARV (on-the-fly)
- $391,830
- Comps found
- 8
Show comp detail 8 sales within ~0.75 mi
| Address | Dist | Beds/Ba | Sqft | Sold | Price | $/sf | Match |
|---|---|---|---|---|---|---|---|
| 6231 SW 18th Pl | 0.22mi | 3/2.0 | 1,179 (+6%) | 20mo | $385,000 | $327 | 63 |
| 6890 SW 16th Ct | 0.59mi | 3/2.0 | 1,056 (-5%) | 8mo | $325,000 | $308 | 58 |
| 6500 SW 15th Ct | 0.29mi | 4/2.0 (+1) | 1,190 (+7%) | 15mo | $441,500 | $371 | 57 |
| 5961 NW 42nd Ave | 0.53mi | 3/1.0 | 1,018 (-8%) | 2mo | $359,000 | $353 | 56 |
| 6210 Kimberly Blvd | 0.70mi | 4/2.0 (+1) | 1,132 (+2%) | 5mo | $440,000 | $389 | 55 |
| 1520 SW 68th Way | 0.50mi | 2/1.0 (-1) | 1,010 (-9%) | 1mo | $315,000 | $312 | 52 |
| 6470 SW 16th St | 0.28mi | 2/1.0 (-1) | 1,050 (-5%) | 22mo | $340,000 | $324 | 50 |
| 4360 NW 61st St | 0.48mi | 3/2.0 | 1,025 (-8%) | 21mo | $410,000 | $400 | 48 |
Match score weights: distance 35% · size 25% · config 20% · recency 20%. Top-matched comps best support the ARV.
Projected returns pro-forma
-3.0% appreciation · 0.0% rent growth · sell at horizon
- IRR
- -33.7%
- Equity multiple
- -0.07×
- Total profit
- $-117,145
- Equity at exit
- $58,423
- IRR
- -65.9%
- Equity multiple
- -0.74×
- Total profit
- $-191,178
- Equity at exit
- $33,878
Cash invested: $109,712 (down + closing). Projections, not guarantees.
Landlord ↔ Tenant lean methodology
- Overall (STATE)
- 87 Strongly Landlord-Friendly
- State Florida
- 87 Strongly Landlord-Friendly · R+3
- County
- — inherits STATE
- City
- — inherits STATE
ZIP-level market 33068
- Rents YoY
- -0.7%
- Active inventory
- 300
- Price-to-rent
- 0.2×
Monthly cashflow live
- Estimated rent
- $2,709 high interval (Pro) →
- Mortgage (P&I)
- −$2,055
- Tax est. 1.5%
- −$490 /mo · $5,877/yr
- Insurance
- −$163
- Flood insurance flood zone
- −$152 /mo · $1,824/yr
- HOA
- −$0
- Vacancy / Maint / Mgmt
- −$569
- Net cashflow
- $-720
Break-even live
Sensitivity live
| Price | -10% $-449 | -5% $-584 | +0% $-720 | +5% $-855 | +10% $-991 |
|---|---|---|---|---|---|
| Rent | -10% $-934 | -5% $-827 | +0% $-720 | +5% $-613 | +10% $-506 |
| Rate | -1.0pp $-523 | -0.5pp $-620 | base $-720 | +0.5pp $-821 | +1.0pp $-925 |
UW: 25.0% down · 7.5% · 30yr · 1.5% tax · 5.0% vac · 8.0% maint · 8.0% mgmt
Financing live
Cash to close
- Down payment
- $97,958
- Closing costs
- $11,755
- Reserves months
- —
- Total cash needed
- —
Loan-product check · same deal, 3 products live
Conventional
25% down · 7.5% · 30yr
- Down + closing
- —
- Monthly P&I
- —
- Monthly cashflow
- —
- DSCR
- —
- Eligible?
- —
Personal DTI + credit; lowest rate.
DSCR
20% down · 8.5% · 30yr
- Down + closing
- —
- Monthly P&I
- —
- Monthly cashflow
- —
- DSCR
- —
- Eligible?
- —
No personal income docs; deal must DSCR.
Hard money
10% down · 12.0% · 12mo
- Down + closing
- —
- Monthly P&I
- —
- Monthly cashflow
- —
- DSCR
- —
- Eligible?
- —
Short-term bridge; refi at stabilization.
Rent comps 40 comps
| Address | Beds | Baths | Sqft | Rent | $/sqft | DOM | Units | Dist |
|---|---|---|---|---|---|---|---|---|
| 6081 SW 19th St North Lauderdale, FL | 2.0 | 2.5 | 1161 | $2,290 | $1.97 | 6d | 1 | 0.25mi |
| 6081 SW 19th St North Lauderdale, FL | 2.0 | 2.5 | 1161 | $2,499 | $2.15 | 26d | 1 | 0.25mi |
| 1720 SW 64th Ter North Lauderdale, FL | 3.0 | 2.0 | 1248 | $3,600 | $2.88 | 13d | 1 | 0.26mi |
| 129 San Remo Blvd #129 North Lauderdale, FL | 3.0 | 2.5 | 1403 | $2,600 | $1.85 | 26d | 1 | 0.28mi |
| 6060 SW 19th Ct North Lauderdale, FL | 2.0 | 3.0 | 1120 | $2,200 | $1.96 | 26d | 1 | 0.30mi |
| 6511 SW 15th Ct Pompano Beach, FL | 4.0 | 2.0 | 1190 | $3,250 | $2.73 | 26d | 1 | 0.32mi |
| 253 San Remo Blvd #253 North Lauderdale, FL | 3.0 | 2.5 | 1403 | $2,300 | $1.64 | 26d | 1 | 0.33mi |
| 224 San Remo Blvd Unit 224 North Lauderdale, FL | 3.0 | 2.5 | 1289 | $2,900 | $2.25 | 26d | 1 | 0.34mi |
| 1700 S State Road 7 North Lauderdale, FL | 1.0–3.0 | 1.0–2.0 | 1118 | $3,335 | $2.98 | 0d | 15 | 0.35mi |
| 1368 Seaview North Lauderdale, FL | 4.0 | 3.0 | 1492 | $3,400 | $2.28 | 26d | 1 | 0.36mi |
| 1954 SW 60th Ave Unit 1 North Lauderdale, FL | 2.0 | 2.0 | 1120 | $2,550 | $2.28 | 26d | 1 | 0.36mi |
| 1962 SW 60th Ave North Lauderdale, FL | 3.0 | 3.0 | 1280 | $2,500 | $1.95 | 21d | 1 | 0.38mi |
| 1358 Silverado North Lauderdale, FL | 4.0 | 2.5 | 1380 | $3,475 | $2.52 | 23d | 1 | 0.39mi |
| 6056 SW 19th Pl North Lauderdale, FL | 2.0 | 2.5 | 1161 | $2,350 | $2.02 | 26d | 1 | 0.39mi |
| 5413 SW 14th St North Lauderdale, FL | 3.0 | 2.5 | 1462 | $3,000 | $2.05 | 26d | 1 | 0.39mi |
| 6473 SW 19th St Pompano Beach, FL | 4.0 | 2.0 | 1484 | $2,800 | $1.89 | 26d | 1 | 0.40mi |
| 5600 SW 12th St North Lauderdale, FL | 1.0–3.0 | 1.0–2.0 | 892 | $2,795 | $3.13 | 20d | 3 | 0.47mi |
| 915 E Maple St North Lauderdale, FL | 3.0 | 2.0 | 1470 | $3,350 | $2.28 | 15d | 1 | 0.48mi |
| 1200 SW 52nd Ave North Lauderdale, FL | 3.0 | 2.0 | 1027 | $2,100 | $2.04 | 26d | 1 | 0.52mi |
| 6872 SW 15th St Pompano Beach, FL | 2.0 | 1.0 | 919 | $2,400 | $2.61 | 15d | 1 | 0.54mi |
| 1034 W Jasmine Ln North Lauderdale, FL | 3.0 | 2.0 | 1470 | $2,850 | $1.94 | 26d | 1 | 0.57mi |
| 5501 SW 11th St Margate, FL | 1.0–2.0 | 1.0 | 719 | $2,050 | $2.85 | 22d | 4 | 0.57mi |
| 1038 W Jasmine Ln North Lauderdale, FL | 3.0 | 2.0 | 1470 | $3,000 | $2.04 | 6d | 1 | 0.59mi |
| 6870 SW 18th Ct #6870 Pompano Beach, FL | 4.0 | 2.0 | 1346 | $3,700 | $2.75 | 26d | 1 | 0.63mi |
| 1982 SW 68th Ter North Lauderdale, FL | 2.0 | 1.0 | 775 | $2,300 | $2.97 | 23d | 1 | 0.66mi |
| 1982 SW 68th Ter North Lauderdale, FL | 2.0 | 1.0 | 775 | $2,100 | $2.71 | 9d | 1 | 0.66mi |
| 6533 Harbour Rd North Lauderdale, FL | 4.0 | 2.0 | 1180 | $3,850 | $3.26 | 26d | 1 | 0.68mi |
| 6551 Boulevard of Champions #6551 North Lauderdale, FL | 4.0 | 2.5 | 1472 | $2,600 | $1.77 | 9d | 1 | 0.69mi |
| 6551 Boulevard of Champions #6551 North Lauderdale, FL | 4.0 | 2.5 | 1472 | $2,600 | $1.77 | 26d | 1 | 0.69mi |
| 6963 SW 19th St Pompano Beach, FL | 2.0 | 1.0 | 1054 | $1,700 | $1.61 | 26d | 1 | 0.69mi |
| 1407 S Santa Catalina Cir North Lauderdale, FL | 2.0 | 2.5 | 1224 | $2,140 | $1.75 | 26d | 1 | 0.72mi |
| 1949 Cove Lake Rd North Lauderdale, FL | 2.0 | 2.0 | 1094 | $2,445 | $2.23 | 26d | 1 | 0.72mi |
| 1304 N Santa Catalina Cir #1304 North Lauderdale, FL | 2.0 | 2.5 | 1224 | $2,100 | $1.72 | 26d | 1 | 0.75mi |
| 1740 SW 70th Way North Lauderdale, FL | 2.0 | 1.0 | 775 | $2,000 | $2.58 | 13d | 1 | 0.75mi |
| 4717 NW 58th St Tamarac, FL | 2.0 | 2.0 | 1354 | $2,600 | $1.92 | 9d | 1 | 0.78mi |
| 6075 N Sabal Palm Blvd #210 Tamarac, FL | 2.0 | 2.0 | 970 | $1,900 | $1.96 | 22d | 1 | 0.85mi |
| 1812 Adventure Pl #1812 North Lauderdale, FL | 2.0 | 1.0 | 955 | $2,200 | $2.30 | 26d | 1 | 0.86mi |
| 1850 Adventure Pl North Lauderdale, FL | 3.0 | 2.0 | 1336 | $2,750 | $2.06 | 26d | 1 | 0.86mi |
| 715 Gardens Dr Pompano Beach, FL | 2.0 | 2.0 | 1000 | $2,150 | $2.15 | 23d | 1 | 0.88mi |
| 715 Gardens Dr #103 Pompano Beach, FL | 2.0 | 2.0 | 1000 | $2,150 | $2.15 | 7d | 1 | 0.88mi |
Listing history 7 events
-
2026-06-09days on market $5,000 Active 8 DOM
-
2026-06-08days on market $5,000 Active 7 DOM
-
2026-06-07days on market $5,000 Active 6 DOM
-
2026-06-04days on market $5,000 Active 3 DOM
-
2026-06-03days on market $5,000 Active 2 DOM
-
2026-06-01remarks 316-char remark
-
2026-06-01$5,000 Active 1 DOM
ⓘ Source: listings_history table (triggers on properties + properties_extension) + one-shot
backfill from property_details.listing_events for pre-trigger history.
Climate risk First Street
- Flood 1/10 Low FEMA zone AH · 0% chance over 30 yrs
- Wildfire 1/10 Low
- Heat 10/10 Extreme 7 d/yr ≥106°F today · 26 d/yr by 30 yrs out
- Wind 10/10 Extreme 99% chance of damaging wind over 30 yrs
- Air quality 3/10 Moderate 3 unhealthy d/yr today · 3 by 30 yrs out
Nearby sold comps map
Loading sold comps map…
Walkable amenities ~0.75 mi
Loading nearby amenities…
Taxation est. · year 1
- Rental income
- $32,507
- − Mortgage interest
- −$21,949
- − Property taxes
- −$5,877
- − Insurance
- −$3,784
- − Repairs & maintenance
- −$2,601
- − Management
- −$2,601
- − Depreciation
- −$11,399
- Taxable loss
- −$15,702
- Est. tax savings @ 24.0%
- +$3,769
- After-tax cash flow
- $-4,870/yr
For passive investors: Depreciation is non-cash, so a rental often shows a tax loss while cash-flowing — sheltering income. Rental losses are passive: they offset passive income freely, and up to $25,000/yr can offset ordinary (W-2) income if you actively participate and your MAGI is under $100k (phasing out to $0 by $150k); unused losses carry forward. On sale, claimed depreciation is recaptured at up to 25%, and gains may owe capital-gains tax (a 1031 exchange can defer both). Figures are a year-1 estimate at your 24.0% rate — not tax advice; consult a CPA.
Schools (NCES district)
- District
- Broward
- NCES district ID
- 1200180
- Math proficiency
- 42% ▼ -18.00%
- Reading proficiency
- 53% ▼ -5.00%
- Median HH income
- $52,139
- Composite
- 40.88/100
- National rank
- #3621
- State rank
- #46 of 73 in FL
Livability — North Lauderdale
- Score
- 76/100
- State rank
- #230
- US rank
- #3635
Category grades
Schools grade is shown separately in the Schools card above.
Census & demographics
- Census place
- North Lauderdale, FL
- County
- Broward County · 1,963,430 people
- City population
- 54,439
- Metro
- Miami-Fort Lauderdale-Pompano Beach, FL
- Population (ZIP)
- 54,439
- Household income
- $64,051
- Rent vs Own
- Severe rent burden
- 3073.0
Population outlook (Broward County) Hauer SSP2
- Today (2025)
- 2,207,033 people
- By 2030
- 2,360,704 · +7.0%
- By 2040
- 2,661,208 · +20.6%
- By 2050
- 2,946,698 · +33.5%
- By 2075
- 3,602,273 · +63.2%
- By 2100
- 3,970,984 · +79.9%
Race, ethnicity, and origin ACS 2023
- Neighborhood character
- Diverse neighborhood (Simpson 0.61)
- Race & ethnicity
- Black 58% Hispanic / Latino 21% Two or more races 13% White 11% Asian 4%
- Hispanic origin (detail)
- Mexican 3% Puerto Rican 4% Cuban 1% Dominican 3%
- Common ancestry
- Hispanic 17% Estonian 1% Lithuanian 1%
- Foreign-born
- 47% · Canada, Jamaica, Vietnam
- Languages at home
- 59% English-only · Spanish 19% French/Haitian/Cajun 15% Other Indo-European 2%
Political lean MEDSL · Broward
- 2024 margin
- D (+17.0) · D 58.0% · R 41.0%
- 2008→2024 swing
- -17.8pp toward R · 2008: 34.7pp · 2024: 17.0pp
- All cycles
- 2024: D+17.0 2020: D+29.8 2016: D+35.0 2012: D+34.9 2008: D+34.7
Not yet ingested
- Civics
- —
Market trends
- HPI YoY
- ▼ -317.60%
- Current HPI
- 426.2972
- Rent YoY
- ▼ -0.74%
- Metro
- Miami-Fort Lauderdale-Pompano Beach, FL
- State GDP YoY
- ▲ 3.28%
- F500 in state
- 36
Industry mix (Fortune 500 HQ in FL)
| Industry | F500 HQs | Revenue |
|---|---|---|
| Industrial Technology | 2 | $29B |
|
||
| Insurance | 2 | $17B |
|
||
| Retail | 1 | $60B |
|
||
| Technology Distribution | 1 | $58B |
|
||
| Homebuilding | 1 | $35B |
|
||
| Technology Manufacturing | 1 | $35B |
|
||
Price history
-51.0% since first listed6 events — show timeline
- 2026-06-01 Listed $5,000 NFMLS
- 2007-01-24 Sold (Public Records) $261,300 Public Records
- 2006-04-20 Sold (Public Records) $210,000 Public Records
- 2000-06-21 Sold (Public Records) $61,000 Public Records
- 1985-02-01 Sold (Public Records) $55,000 Public Records
- 1968-12-01 Sold (Public Records) $10,200 Public Records
Property tax history
+3.4%/yrLatest (2025): $2,662 · +2.6% YoY. Source: county tax records.
Cash-flow waterfall
monthlySold comps — $/sqft
last 12 mo · ≤1 miLoading sold comps…