 6-Plex
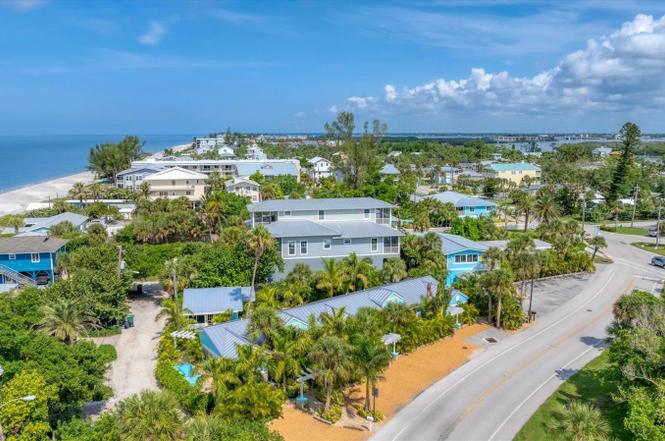
1288 Shore View Dr · Manasota Key, FL
Flood risk 10/10 · Severe
- FEMA flood zone
- AE
- Chance of flooding over 30 yrs
- 0.99%
- Est. flood insurance / yr
- $1,737 – $8,500
Fire risk 1/10 · Minimal
- Est. fire insurance / yr
- $947 – $1,759
Heat risk 10/10 · Severe
- Hot days now (above 107°F)
- 7 days/yr
- Hot days in 30 yrs
- 27 days/yr
Wind risk 10/10 · Severe
- Chance of severe wind over 30 yrs
- 99.0%
Air-quality risk 2/10 · Minimal
- Unhealthy air days now
- 1 days/yr
- Unhealthy air days in 30 yrs
- 1 days/yr
Risk factors via First Street. Map © Google.
Why this score? — see what drove the B- grade
The composite is a weighted blend of 9 inputs, each scored 0–100. Each bar is that input's sub-score; the figure is the points it added to the 100-point composite (weight × sub-score).
- Cash flow +29.3/30.0
- DSCR +10.0/10.0
- 1% rule +8.2/10.0
- ARV discount +7.5/15.0
- Rent growth +4.8/5.0
- Schools +4.6/10.0
- Livability +3.2/5.0
- Condition / age +2.5/5.0
- Appreciation +0.0/10.0
$1,200,000
🖨 Deal sheet (PDF) 📄 Offer letter ✓ Due diligence
Multi-family units
County records classify this as Multi-Family (5+ Unit). Listing-text estimate: 6 units. confirmed
5+ unit building — per-unit beds/baths from public records are typically unavailable; the breakdown below (if shown) is an estimate from the listing text.
Listing remarks
Investors are you looking for a multi-family unit to rehab? Now is your opportunity to invest on Manasota Key. These units are being sold "AS IS" Post Hurricane. Offered here is a Six unit property, walking distance to the beach. This is a rare chance for investors looking to expand their real estate portfolio on picturesque Manasota Key. Experience stunning sunrises over Lemon Bay and vibrant sunsets over the Gulf of Mexico. The pristine white-sand beaches of Manasota Key are just moments away, offering endless opportunities for exploration. Local restaurants offering fresh seafood and live music complete the experience, making this property the ultimate slice of paradise. All lo
Key facts
- 8,236 sq ft lot
- Built 1956
- Listed 265 days
Neighborhood map
What this means for you Summary
Snapshot
- This is a 6 × 5-bed/6.0-bath units multifamily listed at $1.20M.
Deal economics
- At list price, monthly cash flow is $4k ($45k/yr) — positive. Per door: $629/mo.
- The deal already cash-flows at list — no discount required.
- Meets the 1% rule at list price ($16k rent vs $1.20M).
- Recommended offer: $1.06M (12.0% below list) — sets the bar for market timing.
Location & tenants
- Location reads 64/100 on livability (#668 in FL) — a middle-class / working-renter tenant base. Strengths: crime A+, employment A+, housing A+; Watch: amenities F, commute F, cost of living F.
- Charlotte (suburban): math 54% / reading 54% proficiency, ranked #22 of 73 in FL (top 30%) — acceptable for families but not a draw, mixed tenant base, ~2y average lease.
- Zoned schools: L. A. Ainger Middle School (math 65% / reading 53%, grade B, #144 of 571 statewide, top 26%, 720 students, 40% FRL); Lemon Bay High School (math 50% / reading 56%, grade C-, #148 of 667 statewide, top 23%, 1,360 students, 28% FRL) — zoned schools average 34% FRL vs 54% district-wide (19 pts lower); this property's tenant base skews higher-income than the district average.
- Market conditions: Rents rising fast (+9.0%/yr); 726 active listings in the ZIP; solid renter incomes; 4,585 units permitted in Charlotte County in 2024 (703 in 5+ unit buildings).
- At $15,816/mo this rent would consume 250% of the median local household income ($76k/yr) (locally 290% of renters already pay >50% of income on rent) — very limited rent-growth headroom before tenants either downsize or default.
Forward outlook
- Local home prices are declining (-3.0%/yr); year-one equity from $8k of loan paydown is wiped out by about $36k of value loss. Plan a longer hold.
- Charlotte County population projected at +24% by 2050 — long-run rental-demand tailwind backs the buy-and-hold thesis.
- At projected returns (-3.0% appreciation + 8.0% rent growth), your $336k cash investment doubles in ~7 years — after that, you're playing with house money.
Negotiation context
- It's been on market 265 days — a 12% lower offer ($1.06M) is reasonable based on typical stale-listing flexibility.
- 6 sale attempts since 20y ago; this cycle's ask has dropped $500k (29%) from the opening price — seller is motivated, your offer sets the floor, not the list.
Risks & watch-outs
- Watch-outs: flood insurance adds $427/mo; built in 1956 — expect roof / HVAC / electrical / plumbing capex.
- Climate carrying-cost: in FEMA flood zone AE (mandatory federal flood insurance); severe wind risk, 99% chance of damaging wind over 30y; extreme-heat days projected 7→27/yr by 2055 (HVAC capex compounding) — expect insurance premiums to compound above CPI over the hold.
Questions for the listing agent
- It's been on market 265 days. Have you received any prior offers? Is the seller open to a 12% concession, seller financing, or rate buy-down credit?
- Can we see the unit-by-unit rent roll, current vacancy, and any below-market leases? What's the average tenancy length?
- What capital expenditures (roof, boiler, parking lot, exteriors) have been made in the last 5 years, and what's planned in the next 2?
- Built in 1956 — when were the roof, HVAC, electrical panel, plumbing, and water heater last replaced?
- What's the actual annual flood-insurance premium (NFIP or private), and is the property in a SFHA with mandatory coverage?
- Why hasn't it sold? Are there any deal-killer items the seller is aware of (foundation, flood, title, zoning, code violations)?
- Is there a deadline driving the sale (1031 exchange, divorce, estate, relocation)? That informs how much negotiation room exists.
- Schools are F-rated, which usually means shorter tenancies and higher turnover. Who's the typical renter profile here, and what's been the actual vacancy rate?
- What's the average days-on-market for RENTAL listings here right now (not sales)? A rising rental-DOM trend means longer vacancies and softer asking-rent achievability than the comps imply.
- What's the recent tenant-quality profile in this submarket — average credit score on applications, eviction rate, late-payment / NSF rate, and stable-employment percentage? A property-management company in the area should have these aggregated.
- How much new apartment / multifamily construction is in the pipeline within 1–3 miles? Heavy new supply (>2% of stock underway) typically softens rents 12–24 months out; light construction supports rent growth.
Investment metrics
- 1% rule
- 1.32% ✓
- Cap rate
- 10.49%
- Cash-on-cash
- 15.01%
- DSCR
- 1.67
- GRM
- 6.3
CMA / ARV
No comps found within radius.
Projected returns pro-forma
-3.0% appreciation · 8.0% rent growth · sell at horizon
- IRR
- 9.3%
- Equity multiple
- 1.39×
- Total profit
- $130,076
- Equity at exit
- $178,924
- IRR
- 22.4%
- Equity multiple
- 3.40×
- Total profit
- $805,335
- Equity at exit
- $103,754
Cash invested: $336,000 (down + closing). Projections, not guarantees.
Landlord ↔ Tenant lean methodology
- Overall (STATE)
- 87 Strongly Landlord-Friendly
- State Florida
- 87 Strongly Landlord-Friendly · R+3
- County
- — inherits STATE
- City
- — inherits STATE
ZIP-level market 34223
- Home prices YoY
- -34.2%
- Rents YoY
- 9.0%
- Active inventory
- 726
- Price-to-rent
- 37.9×
Monthly cashflow live
- Estimated rent
- $15,816 medium interval (Pro) →
- Mortgage (P&I)
- −$6,293
- Tax est. 1.5%
- −$1,500 /mo · $18,000/yr
- Insurance
- −$500
- Flood insurance flood zone
- −$427 /mo · $5,118/yr
- HOA
- −$0
- Lot rent
- −$0
- Vacancy / Maint / Mgmt
- −$3,321
- Net cashflow
- $3,775
Break-even live
Sensitivity live
| Price | -10% $4,604 | -5% $4,190 | +0% $3,775 | +5% $3,361 | +10% $2,946 |
|---|---|---|---|---|---|
| Rent | -10% $2,526 | -5% $3,150 | +0% $3,775 | +5% $4,400 | +10% $5,025 |
| Rate | -1.0pp $4,379 | -0.5pp $4,080 | base $3,775 | +0.5pp $3,464 | +1.0pp $3,148 |
6-unit breakdown (identical units grouped — click to expand)
| Units | Beds | Baths | Est. rent |
|---|---|---|---|
| 6× units | 5 | 6 | $15,816 |
| #1 | 5 | 6 | $2,636 |
| #2 | 5 | 6 | $2,636 |
| #3 | 5 | 6 | $2,636 |
| #4 | 5 | 6 | $2,636 |
| #5 | 5 | 6 | $2,636 |
| #6 | 5 | 6 | $2,636 |
| Total (6 units) | $15,816 | ||
UW: 25.0% down · 7.5% · 30yr · 1.5% tax · 5.0% vac · 8.0% maint · 8.0% mgmt
Financing live
Cash to close
- Down payment
- $300,000
- Closing costs
- $36,000
- Reserves months
- —
- Total cash needed
- —
Loan-product check · same deal, 3 products live
Conventional
25% down · 7.5% · 30yr
- Down + closing
- —
- Monthly P&I
- —
- Monthly cashflow
- —
- DSCR
- —
- Eligible?
- —
Personal DTI + credit; lowest rate.
DSCR
20% down · 8.5% · 30yr
- Down + closing
- —
- Monthly P&I
- —
- Monthly cashflow
- —
- DSCR
- —
- Eligible?
- —
No personal income docs; deal must DSCR.
Hard money
10% down · 12.0% · 12mo
- Down + closing
- —
- Monthly P&I
- —
- Monthly cashflow
- —
- DSCR
- —
- Eligible?
- —
Short-term bridge; refi at stabilization.
Listing history 17 events
-
2026-02-02status Pending
-
2026-01-07status Active
-
2025-07-02status Pending
-
2025-07-02historical
-
2025-04-21price $3,900,000
-
2025-03-31price $1,200,000
-
2024-12-18price $4,700,000
-
2024-12-18price $1,600,000
-
2024-11-06price $5,000,000
-
2024-11-05$1,700,000 Active
-
2024-09-20$5,500,000 Active
-
2011-08-12historical
-
2011-01-18$375,000
-
2008-02-19historical
-
2008-02-18historical
-
2006-12-14$1,548,000
-
2006-12-14$1,548,000
ⓘ Source: listings_history table (triggers on properties + properties_extension) + one-shot
backfill from property_details.listing_events for pre-trigger history.
Climate risk First Street
- Flood 10/10 Extreme FEMA zone AE · 99% chance over 30 yrs
- Wildfire 1/10 Low
- Heat 10/10 Extreme 7 d/yr ≥107°F today · 27 d/yr by 30 yrs out
- Wind 10/10 Extreme 99% chance of damaging wind over 30 yrs
- Air quality 2/10 Low 1 unhealthy d/yr today · 1 by 30 yrs out
Nearby sold comps map
Loading sold comps map…
Walkable amenities ~0.75 mi
Loading nearby amenities…
Taxation est. · year 1
- Rental income
- $189,792
- − Mortgage interest
- −$67,219
- − Property taxes
- −$18,000
- − Insurance
- −$11,118
- − Repairs & maintenance
- −$15,183
- − Management
- −$15,183
- − Depreciation
- −$34,909
- Taxable income
- $28,179
- Est. tax owed @ 24.0%
- −$6,763
- After-tax cash flow
- $38,539/yr
For passive investors: Depreciation is non-cash, so a rental often shows a tax loss while cash-flowing — sheltering income. Rental losses are passive: they offset passive income freely, and up to $25,000/yr can offset ordinary (W-2) income if you actively participate and your MAGI is under $100k (phasing out to $0 by $150k); unused losses carry forward. On sale, claimed depreciation is recaptured at up to 25%, and gains may owe capital-gains tax (a 1031 exchange can defer both). Figures are a year-1 estimate at your 24.0% rate — not tax advice; consult a CPA.
Schools (NCES district)
- District
- Charlotte
- NCES district ID
- 1200240
- Math proficiency
- 54% ▼ -6.00%
- Reading proficiency
- 54% ▼ -1.00%
- Median HH income
- $44,864
- Composite
- 45.62/100
- National rank
- #2586
- State rank
- #22 of 73 in FL
Livability — Manasota Key
- Score
- 64/100
- State rank
- #668
- US rank
- #13702
Category grades
Schools grade is shown separately in the Schools card above.
Census & demographics
- Census place
- Manasota Key, FL
- County
- Sarasota County · 448,376 people
- Metro
- North Port-Sarasota-Bradenton, FL
- Population (ZIP)
- 19,884
- Household income
- $76,016
- Rent vs Own
- Severe rent burden
- 290.0
Population outlook (Charlotte County) Hauer SSP2
- Today (2025)
- 198,646 people
- By 2030
- 210,507 · +6.0%
- By 2040
- 230,857 · +16.2%
- By 2050
- 247,148 · +24.4%
- By 2075
- 281,777 · +41.8%
- By 2100
- 293,609 · +47.8%
Race, ethnicity, and origin ACS 2023
- Neighborhood character
- Predominantly White (94%)
- Race & ethnicity
- White 94% Two or more races 3% Hispanic / Latino 3% Asian 1%
- Common ancestry
- Romanian 7% Lithuanian 4% Iranian 2%
- Foreign-born
- 9% · Canada
- Languages at home
- 94% English-only · German/W. Germanic 2% Spanish 1% Other Indo-European 1%
Political lean MEDSL · Charlotte
- 2024 margin
- Solid R (+34.0) · D 32.7% · R 66.7%
- 2008→2024 swing
- -26.7pp toward R · 2008: -7.2pp · 2024: -34.0pp
- All cycles
- 2024: R+34.0 2020: R+26.6 2016: R+27.8 2012: R+14.3 2008: R+7.2
Not yet ingested
- Civics
- —
Market trends
- HPI YoY
- ▼ -146.26%
- Current HPI
- 281.0529
- Rent YoY
- ▲ 9.02%
- Metro
- North Port-Sarasota-Bradenton, FL
- State GDP YoY
- ▲ 3.28%
- F500 in state
- 36
Industry mix (Fortune 500 HQ in FL)
| Industry | F500 HQs | Revenue |
|---|---|---|
| Industrial Technology | 2 | $29B |
|
||
| Insurance | 2 | $17B |
|
||
| Retail | 1 | $60B |
|
||
| Technology Distribution | 1 | $58B |
|
||
| Homebuilding | 1 | $35B |
|
||
| Technology Manufacturing | 1 | $35B |
|
||
Price history
+151.9% since first listed17 events — show timeline
- 2026-02-02 Pending — Stellar MLS as Distributed by MLS Grid
- 2026-01-07 Relisted — Stellar MLS as Distributed by MLS Grid
- 2025-07-02 Pending — Stellar MLS as Distributed by MLS Grid
- 2025-07-02 Listing Removed — Stellar MLS as Distributed by MLS Grid
- 2025-04-21 Price Changed $3,900,000 Stellar MLS as Distributed by MLS Grid
- 2025-03-31 Price Changed $1,200,000 Stellar MLS as Distributed by MLS Grid
- 2024-12-18 Price Changed $4,700,000 Stellar MLS as Distributed by MLS Grid
- 2024-12-18 Price Changed $1,600,000 Stellar MLS as Distributed by MLS Grid
- 2024-11-06 Price Changed $5,000,000 Stellar MLS as Distributed by MLS Grid
- 2024-11-05 Listed $1,700,000 Stellar MLS as Distributed by MLS Grid
- 2024-09-20 Listed $5,500,000 Stellar MLS as Distributed by MLS Grid
- 2011-08-12 Listing Removed — Stellar MLS as Distributed by MLS Grid
- 2011-01-18 Listed $375,000 Stellar MLS as Distributed by MLS Grid
- 2008-02-19 Listing Removed — Stellar MLS as Distributed by MLS Grid
- 2008-02-18 Listing Removed — Stellar MLS as Distributed by MLS Grid
- 2006-12-14 Listed $1,548,000 Stellar MLS as Distributed by MLS Grid
- 2006-12-14 Listed $1,548,000 Stellar MLS as Distributed by MLS Grid
Cash-flow waterfall
monthlySold comps — $/sqft
last 12 mo · ≤1 miLoading sold comps…