 Triplex
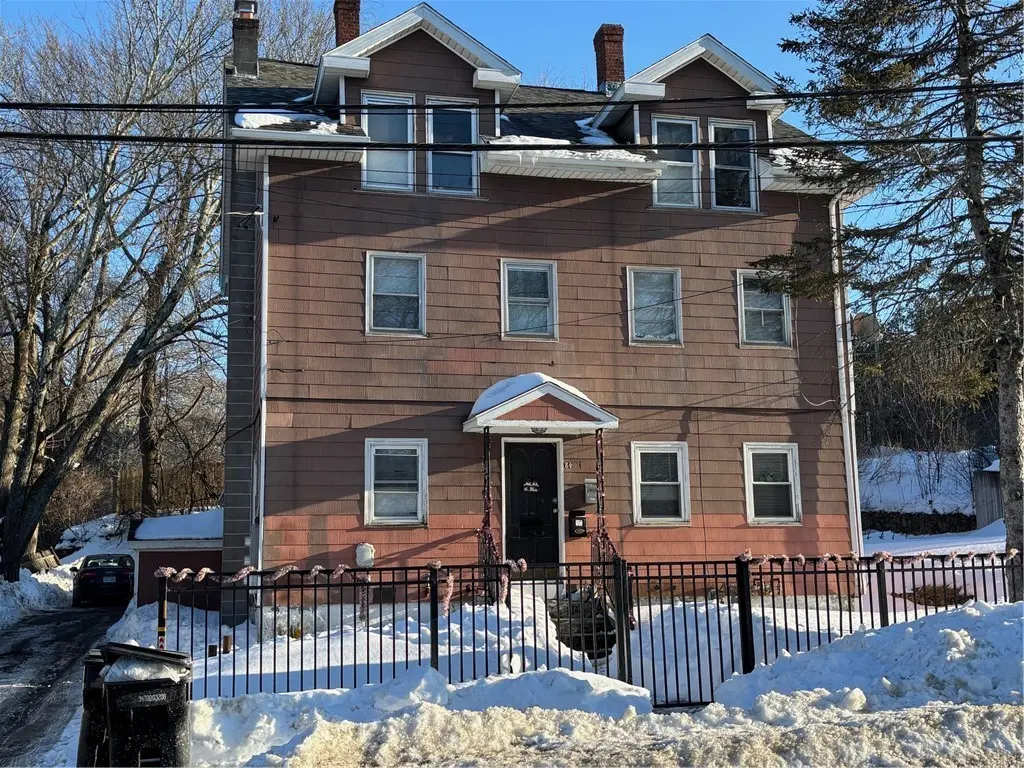
84 Saint Paul St · North Smithfield, RI
Flood risk 1/10 · Minimal
- FEMA flood zone
- X (unshaded)
- Chance of flooding over 30 yrs
- 0.0%
- Est. flood insurance / yr
- $473 – $860
Fire risk 3/10 · Minor
- Est. fire insurance / yr
- $835 – $1,551
Heat risk 4/10 · Minor
- Hot days now (above 95°F)
- 7 days/yr
- Hot days in 30 yrs
- 15 days/yr
Wind risk 6/10 · Moderate
- Chance of severe wind over 30 yrs
- 64.0%
Air-quality risk 2/10 · Minimal
- Unhealthy air days now
- 1 days/yr
- Unhealthy air days in 30 yrs
- 2 days/yr
Risk factors via First Street. Map © Google.
Why this score? — see what drove the C- grade
The composite is a weighted blend of 9 inputs, each scored 0–100. Each bar is that input's sub-score; the figure is the points it added to the 100-point composite (weight × sub-score).
- Cash flow +22.6/30.0
- DSCR +7.2/10.0
- ARV discount +7.1/15.0
- 1% rule +5.3/10.0
- Schools +4.2/10.0
- Rent growth +2.5/5.0
- Livability +2.5/5.0
- Condition / age +2.5/5.0
- Appreciation +0.0/10.0
$579,000
🖨 Deal sheet (PDF) 📄 Offer letter ✓ Due diligence
Multi-family units
County records classify this as Multi-Family (2-4 Unit). Listing-text estimate: 3 units. confirmed
Listing remarks MLS
Three-family property offering strong value-add potential in desirable North Smithfield. This classic 1900 multi-family features two spacious 3-bedroom, 1-bath units, each with washer and dryer connections, plus a unique loft-style 2-bedroom, 1-bath third unit. With a desirable unit mix and flexible heating systems (oil and gas), this property presents an excellent opportunity for investors looking to renovate, increase rents, and build equity. Ideal for owner-occupants seeking rental income or investors expanding their portfolio. Conveniently located with easy access to major routes connecting Rhode Island, Massachusetts, and Connecticut, this property offers long-term upside in a strong commuter location. Priced to reflect condition and ready for its next chapter. * * Tenants and pets on premises * *
Key facts
- Loft-style apartment
- 0.24 acre lot
- 6 parking spots
Tags
Neighborhood map
What this means for you Summary
Snapshot
- This is a 3 × 3-bed/?-bath units multifamily listed at $579k.
Deal economics
- At list price, monthly cash flow is $982 ($12k/yr) — positive. Per door: $327/mo.
- The deal already cash-flows at list — no discount required.
- Meets the 1% rule at list price ($6k rent vs $579k).
- Recommended offer: $527k (9.0% below list) — sets the bar for market timing.
Location & tenants
- Location reads: area grade C — affects rentability + tenant quality, not the cash-flow math above.
- North Smithfield (suburban): math 36% / reading 56% proficiency, ranked #8 of 39 in RI (top 20%) — families likely to look elsewhere, expect single-tenant / working-renter base with shorter leases; only 12% free/reduced lunch — higher-income household profile.
- Market conditions: 62 active listings in the ZIP; 776 units permitted in Providence County in 2024 (229 in 5+ unit buildings).
Forward outlook
- Local home prices are declining (-3.0%/yr); year-one equity from $4k of loan paydown is wiped out by about $17k of value loss. Plan a longer hold.
- Providence County population projected at +5% by 2050 — modest demand growth; plan on rents tracking national, not racing it.
Negotiation context
- It's been on market 116 days — a 9% lower offer ($527k) is reasonable based on typical stale-listing flexibility.
- 9 sale attempts since 21y ago with the ask held roughly flat each time — persistent listings suggest the price (not the market) is what's stuck; bring a comps-based counter.
- Current owner paid $94k; list at $579k implies a 516% gain — meaningful room to come down on a strong offer.
Risks & watch-outs
- Watch-outs: built in 1900 — expect roof / HVAC / electrical / plumbing capex.
- Climate carrying-cost: major wind risk, 64% chance of damaging wind over 30y — expect insurance premiums to compound above CPI over the hold.
Questions for the listing agent
- It's been on market 116 days. Have you received any prior offers? Is the seller open to a 9% concession, seller financing, or rate buy-down credit?
- Can we see the unit-by-unit rent roll, current vacancy, and any below-market leases? What's the average tenancy length?
- What capital expenditures (roof, boiler, parking lot, exteriors) have been made in the last 5 years, and what's planned in the next 2?
- Built in 1900 — when were the roof, HVAC, electrical panel, plumbing, and water heater last replaced?
- Why hasn't it sold? Are there any deal-killer items the seller is aware of (foundation, flood, title, zoning, code violations)?
- Is there a deadline driving the sale (1031 exchange, divorce, estate, relocation)? That informs how much negotiation room exists.
- What's the average days-on-market for RENTAL listings here right now (not sales)? A rising rental-DOM trend means longer vacancies and softer asking-rent achievability than the comps imply.
- What's the recent tenant-quality profile in this submarket — average credit score on applications, eviction rate, late-payment / NSF rate, and stable-employment percentage? A property-management company in the area should have these aggregated.
- How much new apartment / multifamily construction is in the pipeline within 1–3 miles? Heavy new supply (>2% of stock underway) typically softens rents 12–24 months out; light construction supports rent growth.
Investment metrics
- 1% rule
- 1.03% ✓
- Cap rate
- 8.33%
- Cash-on-cash
- 7.27%
- DSCR
- 1.32
- GRM
- 8.1
CMA / ARV
- ARV (median comp)
- $573,592
- List price
- $579,000
- Delta
- 0.94%
- Verdict
- FAIR
- Comps
- 20 within 1.0 mi
Projected returns pro-forma
-3.0% appreciation · 3.0% rent growth · sell at horizon
- IRR
- -5.2%
- Equity multiple
- 0.81×
- Total profit
- $-31,314
- Equity at exit
- $86,331
- IRR
- 4.5%
- Equity multiple
- 1.33×
- Total profit
- $53,044
- Equity at exit
- $50,061
Cash invested: $162,120 (down + closing). Projections, not guarantees.
Landlord ↔ Tenant lean methodology
- Overall (STATE)
- 31 Tenant-Leaning
- State Rhode Island
- 31 Tenant-Leaning · D+8
- County
- — inherits STATE
- City
- — inherits STATE
ZIP-level market 02896
- Home prices YoY
- -31.5%
- Active inventory
- 62
- Price-to-rent
- 24.2×
Monthly cashflow live
- Estimated rent
- $5,989 high interval (Pro) →
- Mortgage (P&I)
- −$3,036
- Tax from tax record
- −$471 /mo · $5,655/yr
- Insurance
- −$241
- HOA
- −$0
- Vacancy / Maint / Mgmt
- −$1,258
- Net cashflow
- $982
Break-even live
Sensitivity live
| Price | -10% $1,310 | -5% $1,146 | +0% $982 | +5% $819 | +10% $655 |
|---|---|---|---|---|---|
| Rent | -10% $509 | -5% $746 | +0% $982 | +5% $1,219 | +10% $1,456 |
| Rate | -1.0pp $1,274 | -0.5pp $1,130 | base $982 | +0.5pp $832 | +1.0pp $680 |
3-unit breakdown (identical units grouped — click to expand)
| Units | Beds | Baths | Est. rent |
|---|---|---|---|
| 3× units | 3 | — | $5,988 |
| #1 | 3 | — | $1,996 |
| #2 | 3 | — | $1,996 |
| #3 | 3 | — | $1,996 |
| Total (3 units) | $5,989 | ||
UW: 25.0% down · 7.5% · 30yr · 1.5% tax · 5.0% vac · 8.0% maint · 8.0% mgmt
Financing live
Cash to close
- Down payment
- $144,750
- Closing costs
- $17,370
- Reserves months
- —
- Total cash needed
- —
Loan-product check · same deal, 3 products live
Conventional
25% down · 7.5% · 30yr
- Down + closing
- —
- Monthly P&I
- —
- Monthly cashflow
- —
- DSCR
- —
- Eligible?
- —
Personal DTI + credit; lowest rate.
DSCR
20% down · 8.5% · 30yr
- Down + closing
- —
- Monthly P&I
- —
- Monthly cashflow
- —
- DSCR
- —
- Eligible?
- —
No personal income docs; deal must DSCR.
Hard money
10% down · 12.0% · 12mo
- Down + closing
- —
- Monthly P&I
- —
- Monthly cashflow
- —
- DSCR
- —
- Eligible?
- —
Short-term bridge; refi at stabilization.
Listing history 30 events
-
2026-06-01days on market $579,000 Active 116 DOM
-
2026-05-31days on market $579,000 Active 115 DOM
-
2026-03-06price $579,000 815-char remark
Show marketing remark (815 chars)
Three-family property offering strong value-add potential in desirable North Smithfield. This classic 1900 multi-family features two spacious 3-bedroom, 1-bath units, each with washer and dryer connections, plus a unique loft-style 2-bedroom, 1-bath third unit. With a desirable unit mix and flexible heating systems (oil and gas), this property presents an excellent opportunity for investors looking to renovate, increase rents, and build equity. Ideal for owner-occupants seeking rental income or investors expanding their portfolio. Conveniently located with easy access to major routes connecting Rhode Island, Massachusetts, and Connecticut, this property offers long-term upside in a strong commuter location. Priced to reflect condition and ready for its next chapter. * * Tenants and pets on premises * *
-
2026-02-02$599,000 Active 815-char remark
Show marketing remark (815 chars)
Three-family property offering strong value-add potential in desirable North Smithfield. This classic 1900 multi-family features two spacious 3-bedroom, 1-bath units, each with washer and dryer connections, plus a unique loft-style 2-bedroom, 1-bath third unit. With a desirable unit mix and flexible heating systems (oil and gas), this property presents an excellent opportunity for investors looking to renovate, increase rents, and build equity. Ideal for owner-occupants seeking rental income or investors expanding their portfolio. Conveniently located with easy access to major routes connecting Rhode Island, Massachusetts, and Connecticut, this property offers long-term upside in a strong commuter location. Priced to reflect condition and ready for its next chapter. * * Tenants and pets on premises * *
-
2016-11-08price $329,900
-
2016-11-08price $319,900
-
2016-09-16soldstatus $94,000 Sold
-
2016-07-29status Pending
-
2016-07-12$99,900 Active - New
-
2016-07-11historical
-
2016-06-18price $119,900
-
2016-06-01price $129,900
-
2016-04-30$134,900 Active - New
-
2010-01-24historical
-
2008-09-19$239,000
-
2007-05-03historical
-
2006-05-03$359,000
-
2006-03-15soldstatus $305,000
-
2006-03-15soldstatus $305,000
-
2006-03-15soldstatus $305,000
-
2006-03-15soldstatus $305,000
-
2006-01-24historical
-
2005-12-23historical
-
2005-12-13$299,900
-
2005-12-12$299,900
-
2005-08-03historical
-
2005-07-07historical
-
2005-07-07$324,900
-
2005-04-08$349,900
-
2004-04-21soldstatus $204,000
ⓘ Source: listings_history table (triggers on properties + properties_extension) + one-shot
backfill from property_details.listing_events for pre-trigger history.
Tax reassessment forecast RI · Partial reset (capped growth)
- Current annual tax
- $5,655 · $471/mo
- Projected year-2 tax
- $7,546 · $629/mo
- Expected delta
- +$1,891/yr (+$158/mo · 33.4%)
ⓘ Screening estimate from a state-policy table — verify with the county assessor before closing.
Climate risk First Street
- Flood 1/10 Low FEMA zone X (unshaded) · 0% chance over 30 yrs
- Wildfire 3/10 Moderate
- Heat 4/10 Moderate 7 d/yr ≥95°F today · 15 d/yr by 30 yrs out
- Wind 6/10 Major 64% chance of damaging wind over 30 yrs
- Air quality 2/10 Low 1 unhealthy d/yr today · 2 by 30 yrs out
Nearby sold comps map
Loading sold comps map…
Walkable amenities ~0.75 mi
Loading nearby amenities…
Taxation est. · year 1
- Rental income
- $71,868
- − Mortgage interest
- −$32,433
- − Property taxes
- −$5,655
- − Insurance
- −$2,895
- − Repairs & maintenance
- −$5,749
- − Management
- −$5,749
- − Depreciation
- −$16,844
- Taxable income
- $2,542
- Est. tax owed @ 24.0%
- −$610
- After-tax cash flow
- $11,179/yr
For passive investors: Depreciation is non-cash, so a rental often shows a tax loss while cash-flowing — sheltering income. Rental losses are passive: they offset passive income freely, and up to $25,000/yr can offset ordinary (W-2) income if you actively participate and your MAGI is under $100k (phasing out to $0 by $150k); unused losses carry forward. On sale, claimed depreciation is recaptured at up to 25%, and gains may owe capital-gains tax (a 1031 exchange can defer both). Figures are a year-1 estimate at your 24.0% rate — not tax advice; consult a CPA.
Schools (NCES district)
- District
- North Smithfield
- NCES district ID
- 4400810
- Math proficiency
- 36% ▼ -14.00%
- Reading proficiency
- 56% ▼ -6.00%
- Median HH income
- $76,012
- Composite
- 41.87/100
- National rank
- #3374
- State rank
- #8 of 39 in RI
Livability — North Smithfield
No livability data for this city. (Only ~50 U.S. cities are tracked.)
Census & demographics
- City population
- 355
- Population (ZIP)
- 11,683
Population outlook (Providence County) Hauer SSP2
- Today (2025)
- 653,469 people
- By 2030
- 660,819 · +1.1%
- By 2040
- 672,747 · +3.0%
- By 2050
- 683,741 · +4.6%
- By 2075
- 720,435 · +10.2%
- By 2100
- 741,582 · +13.5%
Race, ethnicity, and origin ACS 2023
- Neighborhood character
- Predominantly White (94%)
- Race & ethnicity
- White 94% Hispanic / Latino 3% Two or more races 2%
- Common ancestry
- Lithuanian 23% Russian 6% Romanian 5%
- Foreign-born
- 4% · Canada, Jamaica
- Languages at home
- 93% English-only · French/Haitian/Cajun 2% Spanish 1% Russian/Polish/Slavic 1%
Political lean MEDSL · Providence
- 2024 margin
- D (+14.4) · D 56.1% · R 41.7% · Other 2.2%
- 2008→2024 swing
- -20.0pp toward R · 2008: 34.4pp · 2024: 14.4pp
- All cycles
- 2024: D+14.4 2020: D+22.9 2016: D+21.2 2012: D+34.9 2008: D+34.4
Not yet ingested
- Civics
- —
Market trends
- HPI YoY
- ▼ -135.81%
- Current HPI
- 295.1705
- Rent YoY
- —
- Metro
- —
- State GDP YoY
- ▲ 2.25%
- F500 in state
- 10
Industry mix (Fortune 500 HQ in RI)
| Industry | F500 HQs | Revenue |
|---|---|---|
| Healthcare | 1 | $373B |
|
||
| Food Distribution | 1 | $31B |
|
||
| Aerospace / Defense | 1 | $14B |
|
||
| Financial Services | 1 | $8B |
|
||
| Consumer Goods | 1 | $4B |
|
||
Price history
+183.8% since first listed28 events — show timeline
- 2026-03-06 Price Changed $579,000 RIS
- 2026-02-02 Listed $599,000 RIS
- 2016-11-08 Price Changed $319,900 RIS
- 2016-11-08 Price Changed $329,900 RIS
- 2016-09-16 Sold (MLS) $94,000 RIS
- 2016-07-29 Pending — RIS
- 2016-07-12 Listed $99,900 RIS
- 2016-07-11 Listing Removed — RIS
- 2016-06-18 Price Changed $119,900 RIS
- 2016-06-01 Price Changed $129,900 RIS
- 2016-04-30 Listed $134,900 RIS
- 2010-01-24 Listing Removed — RIS
- 2008-09-19 Listed $239,000 RIS
- 2007-05-03 Listing Removed — RIS
- 2006-05-03 Listed $359,000 RIS
- 2006-03-15 Sold (Public Records) $305,000 Public Records
- 2006-03-15 Sold (Public Records) $305,000 Public Records
- 2006-03-15 Sold (MLS) $305,000 RIS
- 2006-03-15 Sold (MLS) $305,000 MLS PIN
- 2006-01-24 Listing Removed — MLS PIN
- 2005-12-23 Listing Removed — RIS
- 2005-12-13 Listed $299,900 MLS PIN
- 2005-12-12 Listed $299,900 RIS
- 2005-08-03 Listing Removed — RIS
- 2005-07-07 Listed $324,900 RIS
- 2005-07-07 Listing Removed — RIS
- 2005-04-08 Listed $349,900 RIS
- 2004-04-21 Sold (Public Records) $204,000 Public Records
Property tax history
+3.5%/yrLatest (2025): $5,655 · +34.3% YoY. Source: county tax records.
Cash-flow waterfall
monthlySold comps — $/sqft
last 12 mo · ≤1 miLoading sold comps…