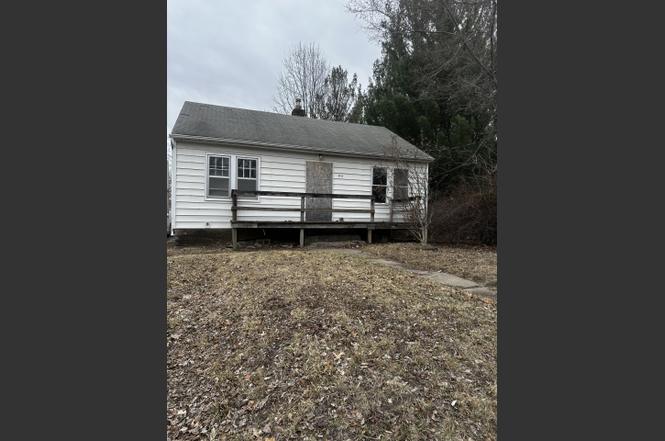
4013 2nd Ave · Des Moines, IA
Flood risk 1/10 · Minimal
- FEMA flood zone
- X (unshaded)
- Chance of flooding over 30 yrs
- 0.0%
- Est. flood insurance / yr
- $473 – $860
Fire risk 3/10 · Minor
- Est. fire insurance / yr
- $902 – $1,676
Heat risk 3/10 · Minor
- Hot days now (above 103°F)
- 7 days/yr
- Hot days in 30 yrs
- 15 days/yr
Wind risk 2/10 · Minimal
- Chance of severe wind over 30 yrs
- —
Air-quality risk 2/10 · Minimal
- Unhealthy air days now
- 1 days/yr
- Unhealthy air days in 30 yrs
- 2 days/yr
Risk factors via First Street. Map © Google.
Why this score? — see what drove the B grade
The composite is a weighted blend of 9 inputs, each scored 0–100. Each bar is that input's sub-score; the figure is the points it added to the 100-point composite (weight × sub-score).
- Cash flow +30.0/30.0
- 1% rule +10.0/10.0
- DSCR +10.0/10.0
- ARV discount +7.5/15.0
- Rent growth +5.0/5.0
- Livability +4.0/5.0
- Schools +3.8/10.0
- Condition / age +2.5/5.0
- Appreciation +0.0/10.0
$32,500
🖨 Deal sheet (PDF) 📄 Offer letter ✓ Due diligence
Listing remarks
Have you been looking to add to your investment portfolio? This is the perfect opportunity!
Key facts
- 6,950 sq ft lot
- Garage
- Built 1939
Neighborhood map
What this means for you Summary
Snapshot
- This is a 2-bed/1.0-bath single-family listed at $32k.
Deal economics
- At list price, monthly cash flow is $644 ($8k/yr) — positive.
- The deal already cash-flows at list — no discount required.
- Meets the 1% rule at list price ($1k rent vs $32k).
- Cap rate 30.1% vs local median 3.1% in Des Moines — top-decile yield for the area; either an underpriced asset or a hidden risk that comps aren't pricing in. Stress-test before assuming the spread holds.
Location & tenants
- Location reads 81/100 on livability (#63 in IA, #1,432 nationally) — a professional / high-income tenant draw. Strengths: commute A+, cost of living A+, housing A+; Watch: employment C-, crime F.
- Des Moines Independent Community School District (urban): math 43% / reading 46% proficiency, ranked #289 of 289 in IA (top 100%) — families likely to look elsewhere, expect single-tenant / working-renter base with shorter leases; 63% free/reduced lunch — lower-income household profile, screen leases tightly.
- Zoned schools: Madison Elementary School (math 37% / reading 32%, grade F, #595 of 616 statewide, top 97%, 243 students, 90% FRL); Harding Middle School (math 31% / reading 30%, grade F, #245 of 246 statewide, top 100%, 655 students, 90% FRL); North High School (math 33% / reading 45%, grade F, #326 of 336 statewide, top 97%, 1,458 students, 87% FRL) — zoned schools average 89% FRL vs 63% district-wide (26 pts higher); higher-poverty schools than district average — tighter screening recommended.
- Market conditions: Rents rising fast (+13.1%/yr); 156 active listings in the ZIP; 10 comparable units currently listed for rent nearby; rentals at typical pace (median 26d on market — plan ~3-4 weeks tenant-placement turnaround); 40% of comp listings sitting > 30 days — soft ceiling on asking rent; 2,953 units permitted in Polk County in 2024 (540 in 5+ unit buildings).
Forward outlook
- Local home prices are declining (-3.0%/yr); year-one equity from $225 of loan paydown is wiped out by about $975 of value loss. Plan a longer hold.
- Polk County population projected at +37% by 2050 — long-run rental-demand tailwind backs the buy-and-hold thesis.
- At projected returns (-3.0% appreciation + 8.0% rent growth), your $9k cash investment doubles in ~2 years — after that, you're playing with house money.
Negotiation context
- Only 12 days on market — expect competitive offers; lowballing is unlikely to land.
Risks & watch-outs
- Watch-outs: built in 1939 — expect roof / HVAC / electrical / plumbing capex.
Questions for the listing agent
- Built in 1939 — when were the roof, HVAC, electrical panel, plumbing, and water heater last replaced?
- Is there a deadline driving the sale (1031 exchange, divorce, estate, relocation)? That informs how much negotiation room exists.
- Schools are D-rated, which usually means shorter tenancies and higher turnover. Who's the typical renter profile here, and what's been the actual vacancy rate?
- Crime grade is F in this area — have there been break-ins, vandalism, or insurance claims at this property in the last 3 years? What carrier currently insures it and at what premium?
- What's the average days-on-market for RENTAL listings here right now (not sales)? A rising rental-DOM trend means longer vacancies and softer asking-rent achievability than the comps imply.
- What's the recent tenant-quality profile in this submarket — average credit score on applications, eviction rate, late-payment / NSF rate, and stable-employment percentage? A property-management company in the area should have these aggregated.
- How much new for-sale + rental construction is in the pipeline within 1–3 miles? Heavy new supply typically softens prices + rents 12–24 months out; constrained supply supports both.
Investment metrics
- 1% rule
- 3.38% ✓
- Cap rate
- 30.06%
- Cash-on-cash
- 84.87%
- DSCR
- 4.78
- GRM
- 2.5
CMA / ARV
- ARV (on-the-fly)
- $177,750
- Comps found
- 12
Show comp detail 12 sales within ~0.75 mi
| Address | Dist | Beds/Ba | Sqft | Sold | Price | $/sf | Match |
|---|---|---|---|---|---|---|---|
| 3906 Cornell St | 0.26mi | 2/1.0 | 768 (-3%) | 1mo | $85,000 | $111 | 82 |
| 921 Madison Ave | 0.57mi | 2/1.0 | 780 (-1%) | 1mo | $192,400 | $247 | 70 |
| 4012 7th St | 0.34mi | 2/2.0 | 734 (-7%) | 0mo | $165,000 | $225 | 68 |
| 616 E Ovid Ave | 0.70mi | 2/1.0 | 780 (-1%) | 1mo | $185,000 | $237 | 65 |
| 511 Ovid Ave | 0.58mi | 2/1.0 | 736 (-7%) | 0mo | $152,500 | $207 | 62 |
| 3308 Cambridge St | 0.59mi | 3/1.0 (+1) | 816 (+3%) | 1mo | $169,900 | $208 | 61 |
| 3914 E 8th St | 0.58mi | 2/1.5 | 744 (-6%) | 1mo | $175,000 | $235 | 61 |
| 4030 8th Pl | 0.47mi | 3/1.5 (+1) | 842 (+7%) | 1mo | $171,000 | $203 | 59 |
| 796 E Aurora Ave | 0.65mi | 2/1.0 | 843 (+7%) | 1mo | $158,000 | $187 | 58 |
| 3701 Amherst St | 0.56mi | 2/1.0 | 704 (-11%) | 1mo | $118,500 | $168 | 55 |
| 3809 11th St | 0.68mi | 3/1.5 (+1) | 857 (+8%) | 1mo | $239,900 | $280 | 46 |
| 1106 Douglas Ave | 0.73mi | 2/2.0 | 884 (+12%) | 0mo | $226,685 | $256 | 42 |
Match score weights: distance 35% · size 25% · config 20% · recency 20%. Top-matched comps best support the ARV.
Projected returns pro-forma
-3.0% appreciation · 8.0% rent growth · sell at horizon
- IRR
- 90.9%
- Equity multiple
- 5.57×
- Total profit
- $41,550
- Equity at exit
- $4,846
- IRR
- 94.9%
- Equity multiple
- 13.69×
- Total profit
- $115,466
- Equity at exit
- $2,810
Cash invested: $9,100 (down + closing). Projections, not guarantees.
Landlord ↔ Tenant lean methodology
- Overall (STATE)
- 83 Strongly Landlord-Friendly
- State Iowa
- 83 Strongly Landlord-Friendly · R+6
- County
- — inherits STATE
- City
- — inherits STATE
ZIP-level market 50313
- Rents YoY
- 13.1%
- Active inventory
- 156
- Price-to-rent
- 2.5×
Monthly cashflow live
- Estimated rent
- $1,099 high interval (Pro) →
- Mortgage (P&I)
- −$170
- Tax est. 1.5%
- −$41 /mo · $488/yr
- Insurance
- −$14
- HOA
- −$0
- Vacancy / Maint / Mgmt
- −$231
- Net cashflow
- $644
Break-even live
Sensitivity live
| Price | -10% $666 | -5% $655 | +0% $644 | +5% $632 | +10% $621 |
|---|---|---|---|---|---|
| Rent | -10% $557 | -5% $600 | +0% $644 | +5% $687 | +10% $730 |
| Rate | -1.0pp $660 | -0.5pp $652 | base $644 | +0.5pp $635 | +1.0pp $627 |
UW: 25.0% down · 7.5% · 30yr · 1.5% tax · 5.0% vac · 8.0% maint · 8.0% mgmt
Financing live
Cash to close
- Down payment
- $8,125
- Closing costs
- $975
- Reserves months
- —
- Total cash needed
- —
Loan-product check · same deal, 3 products live
Conventional
25% down · 7.5% · 30yr
- Down + closing
- —
- Monthly P&I
- —
- Monthly cashflow
- —
- DSCR
- —
- Eligible?
- —
Personal DTI + credit; lowest rate.
DSCR
20% down · 8.5% · 30yr
- Down + closing
- —
- Monthly P&I
- —
- Monthly cashflow
- —
- DSCR
- —
- Eligible?
- —
No personal income docs; deal must DSCR.
Hard money
10% down · 12.0% · 12mo
- Down + closing
- —
- Monthly P&I
- —
- Monthly cashflow
- —
- DSCR
- —
- Eligible?
- —
Short-term bridge; refi at stabilization.
Rent comps 10 comps
| Address | Beds | Baths | Sqft | Rent | $/sqft | DOM | Units | Dist |
|---|---|---|---|---|---|---|---|---|
| 4124 3rd St Des Moines, IA | 3.0 | 1.0 | 996 | $1,595 | $1.60 | 16d | 1 | 0.15mi |
| 3905 8th St Des Moines, IA | 1.0 | 1.0 | 675 | $895 | $1.33 | 25d | 1 | 0.40mi |
| 3623 Cambridge St Des Moines, IA | 2.0 | 1.0 | 732 | $1,145 | $1.56 | 21d | 1 | 0.43mi |
| 3419 1st St Unit 2 Des Moines, IA | 1.0 | 1.0 | 546 | $650 | $1.19 | 46d | 1 | 0.52mi |
| 1108 E Seneca Ave Apt 5 Des Moines, IA | 1.0 | 1.0 | 680 | $647 | $0.95 | 25d | 1 | 0.80mi |
| 1108 E Seneca Ave Apt 1 Des Moines, IA | 1.0 | 1.0 | 680 | $647 | $0.95 | 46d | 1 | 0.81mi |
| 1124 E Seneca Ave Apt 8 Des Moines, IA | 1.0 | 1.0 | 550 | $597 | $1.09 | 46d | 1 | 0.83mi |
| 1124 E Seneca Ave Apt 6 Des Moines, IA | 1.0 | 1.0 | 550 | $597 | $1.09 | 25d | 1 | 0.83mi |
| 3103 E 7th St Des Moines, IA | 2.0 | 1.0 | 960 | $1,200 | $1.25 | 46d | 1 | 0.92mi |
| 3315 E 15th St Des Moines, IA | 1.0 | 1.0 | 610 | $785 | $1.29 | 23d | 2 | 1.33mi |
Listing history 2 events
-
2026-03-23status Pending
-
2026-03-10$32,500 Active
ⓘ Source: listings_history table (triggers on properties + properties_extension) + one-shot
backfill from property_details.listing_events for pre-trigger history.
Climate risk First Street
- Flood 1/10 Low FEMA zone X (unshaded) · 0% chance over 30 yrs
- Wildfire 3/10 Moderate
- Heat 3/10 Moderate 7 d/yr ≥103°F today · 15 d/yr by 30 yrs out
- Wind 2/10 Low
- Air quality 2/10 Low 1 unhealthy d/yr today · 2 by 30 yrs out
Nearby sold comps map
Loading sold comps map…
Walkable amenities ~0.75 mi
Loading nearby amenities…
Taxation est. · year 1
- Rental income
- $13,188
- − Mortgage interest
- −$1,821
- − Property taxes
- −$488
- − Insurance
- −$162
- − Repairs & maintenance
- −$1,055
- − Management
- −$1,055
- − Depreciation
- −$945
- Taxable income
- $7,662
- Est. tax owed @ 24.0%
- −$1,839
- After-tax cash flow
- $5,884/yr
For passive investors: Depreciation is non-cash, so a rental often shows a tax loss while cash-flowing — sheltering income. Rental losses are passive: they offset passive income freely, and up to $25,000/yr can offset ordinary (W-2) income if you actively participate and your MAGI is under $100k (phasing out to $0 by $150k); unused losses carry forward. On sale, claimed depreciation is recaptured at up to 25%, and gains may owe capital-gains tax (a 1031 exchange can defer both). Figures are a year-1 estimate at your 24.0% rate — not tax advice; consult a CPA.
Schools (NCES district)
- District
- Des Moines Independent Community School District
- NCES district ID
- 1908970
- Math proficiency
- 43% ▼ -6.00%
- Reading proficiency
- 46% ▼ -1.00%
- Median HH income
- $45,905
- Composite
- 37.83/100
- National rank
- #4331
- State rank
- #289 of 289 in IA
Livability — Des Moines
- Score
- 81/100
- State rank
- #63
- US rank
- #1432
Category grades
Schools grade is shown separately in the Schools card above.
Census & demographics
- Census place
- Des Moines, IA
- County
- Polk County · 453,298 people
- City population
- 203,612
- Metro
- Des Moines-West Des Moines, IA
- Population (ZIP)
- 17,440
- Household income
- $68,361
- Rent vs Own
- Severe rent burden
- 454.0
Population outlook (Polk County) Hauer SSP2
- Today (2025)
- 548,042 people
- By 2030
- 588,557 · +7.4%
- By 2040
- 670,629 · +22.4%
- By 2050
- 752,830 · +37.4%
- By 2075
- 955,069 · +74.3%
- By 2100
- 1,115,436 · +103.5%
Race, ethnicity, and origin ACS 2023
- Neighborhood character
- Diverse neighborhood (Simpson 0.58)
- Race & ethnicity
- White 61% Hispanic / Latino 17% Black 11% Two or more races 8% Asian 6%
- Hispanic origin (detail)
- Mexican 11%
- Common ancestry
- Iranian 3% Portuguese 2% Scotch-Irish 2%
- Foreign-born
- 16% · Canada, Philippines, Vietnam
- Languages at home
- 75% English-only · Spanish 14% Other Asian/Pacific 4% Russian/Polish/Slavic 1%
Political lean MEDSL · Polk
- 2024 margin
- D (+10.9) · D 54.8% · R 43.9% · Other 1.3%
- 2008→2024 swing
- -3.7pp toward R · 2008: 14.6pp · 2024: 10.9pp
- All cycles
- 2024: D+10.9 2020: D+15.2 2016: D+11.5 2012: D+14.2 2008: D+14.6
Not yet ingested
- Civics
- —
Market trends
- HPI YoY
- ▼ -162.17%
- Current HPI
- 285.5708
- Rent YoY
- ▲ 13.11%
- Metro
- Des Moines-West Des Moines, IA
- State GDP YoY
- ▲ 2.48%
- F500 in state
- 4
Industry mix (Fortune 500 HQ in IA)
| Industry | F500 HQs | Revenue |
|---|---|---|
| Financial Services | 1 | $16B |
|
||
| Retail / Convenience | 1 | $15B |
|
||
Price history
2 events — show timeline
- 2026-03-23 Pending — DMMLS
- 2026-03-10 Listed $32,500 DMMLS
Property tax history
+3.3%/yrLatest (2025): $2,198 · +2.0% YoY. Source: county tax records.
Cash-flow waterfall
monthlySold comps — $/sqft
last 12 mo · ≤1 miLoading sold comps…