1425 Curlew Ave Unit 2-1 · Naples, FL
Flood risk 9/10 · Severe
- FEMA flood zone
- AE
- Chance of flooding over 30 yrs
- 0.99%
- Est. flood insurance / yr
- $1,737 – $8,500
Fire risk 3/10 · Minor
- Est. fire insurance / yr
- $947 – $1,759
Heat risk 10/10 · Severe
- Hot days now (above 107°F)
- 7 days/yr
- Hot days in 30 yrs
- 26 days/yr
Wind risk 10/10 · Severe
- Chance of severe wind over 30 yrs
- 99.0%
Air-quality risk 3/10 · Minor
- Unhealthy air days now
- 3 days/yr
- Unhealthy air days in 30 yrs
- 3 days/yr
Risk factors via First Street. Map © Google.
Why this score? — see what drove the C+ grade
The composite is a weighted blend of 9 inputs, each scored 0–100. Each bar is that input's sub-score; the figure is the points it added to the 100-point composite (weight × sub-score).
- Cash flow +19.4/30.0
- 1% rule +7.7/10.0
- ARV discount +7.5/15.0
- Appreciation +7.0/10.0
- DSCR +6.1/10.0
- Schools +5.0/10.0
- Rent growth +4.7/5.0
- Livability +4.0/5.0
- Condition / age +2.5/5.0
$429,900
🖨 Deal sheet (PDF) 📄 Offer letter ✓ Due diligence
Listing remarks
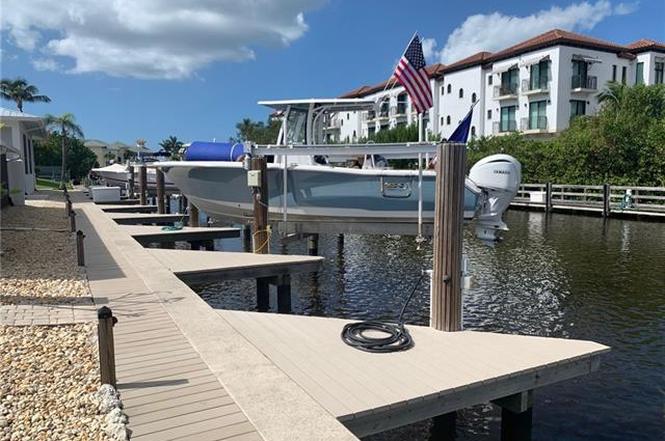
.This charming, Renovated, first-floor, 2-bedroom, 2-bath end-unit condo comes with an assigned boat dock for up to a 25 feet boat, seawall was replaced in 2020. Good for 50 years. Perfect for those seeking a serene escape. The contemporary kitchen features new white cabinetry, sleek quartz countertops, modern cabinet pulls, custom lighting. Updates throughout include Impact Windows, New A/C system, New Roof and modern finishes in the updated master bath. Enjoy endless aquatic adventures with direct access for boating and fishing enthusiasts, right at your doorstep, adding a new dimension to your Naples, FL lifestyle. Located close to pristine beaches, renowned downtown restaurants, shoppin
Key facts
- New a c system
- Assigned boat dock
- Seawall replaced
Tags
Property features AI
Finance
- Other: Deeded property restrictions: limited number vehicles, no commercial, no RV
- Financial info: Total annual recurring fees reported
- HOA & community: Mandatory homeowners association; Quarterly condo fee (reported quarterly); Maintenance covers insurance, irrigation water, lawn/land maintenance, legal/accounting, manager, master association fee, reserves, and water; Professional management; Community type: Boating; Amenities included: extra storage
Exterior
- Parking: 2 assigned parking spaces; Parking lot view
- Security: Owned private security system
- Utilities: Central water; Central sewer; Cable available
- Home design: Residential property; Low rise (1–3) building; 1 story / ranch; Rear exposure facing north; Located in the Oyster Bay development; Gulf access with no bridges; canal width approximately 31–80 feet
- Construction: Concrete block construction; Stucco exterior finish; Built in 1970; Built-up/flat and metal roof options; Single hung and sliding windows; Impact resistant doors and windows; Foundation: (not specified)
- Exterior features: Deck; Patio; Privacy wall; Seawall; Boat dock (private) with boat slip and composite dock; Dock includes electricity and water; Fish cleaning station; Sidewalk; Streetlight
Interior
- Kitchen: Pantry; Dishwasher; Microwave; Refrigerator
- Bedrooms: 2 bedrooms; Primary and/or bedrooms on the first floor
- Flooring: Tile flooring
- Bathrooms: 2 full bathrooms; Master bath with combo tub and shower
- Heating & cooling: Central electric cooling
- Interior features: Cable prewire; Pantry; Smoke detectors; Window coverings; Great room floor plan; Dining area within living room; Open porch/lanai; Storage
- Laundry & utility: Washer and dryer in residence
Neighborhood map
What this means for you Summary
Snapshot
- This is a 2-bed/2.0-bath condo listed at $430k.
Deal economics
- At list price, monthly cash flow is $57 ($684/yr) — positive.
- The deal already cash-flows at list — no discount required.
- Meets the 1% rule at list price ($5k rent vs $430k).
- Recommended offer: $378k (12.0% below list) — sets the bar for market timing.
Location & tenants
- Location reads 80/100 on livability (#126 in FL, #1,903 nationally) — a professional / high-income tenant draw. Strengths: crime A+, amenities A+, employment A+; Watch: commute D+, cost of living F.
- Market conditions: Rents rising fast (+8.8%/yr); 614 active listings in the ZIP; 40 comparable units currently listed for rent nearby; rentals at typical pace (median 22d on market — plan ~3-4 weeks tenant-placement turnaround); high-income renter base; 3,520 units permitted in Collier County in 2024 (959 in 5+ unit buildings).
- At $5,447/mo this rent would consume 50% of the median local household income ($131k/yr) (locally 333% of renters already pay >50% of income on rent) — very limited rent-growth headroom before tenants either downsize or default.
Forward outlook
- In year one you build about $21k of equity ($3k loan paydown + $18k appreciation (4.1% local appreciation)).
- Collier County population projected at +30% by 2050 — long-run rental-demand tailwind backs the buy-and-hold thesis.
- At projected returns (4.1% appreciation + 8.0% rent growth), your $120k cash investment doubles in ~5 years — after that, you're playing with house money.
- By year 2, paydown + projected appreciation supports a ~$33k cash-out refi (75% LTV) — recoverable capital for the next deal without selling this one.
Negotiation context
- It's been on market 163 days — a 12% lower offer ($378k) is reasonable based on typical stale-listing flexibility.
- 3 sale attempts since 2y ago with the ask held roughly flat each time — persistent listings suggest the price (not the market) is what's stuck; bring a comps-based counter.
Risks & watch-outs
- Watch-outs: flood insurance adds $427/mo.
- Climate carrying-cost: in FEMA flood zone AE (mandatory federal flood insurance); severe wind risk, 99% chance of damaging wind over 30y; extreme-heat days projected 7→26/yr by 2055 (HVAC capex compounding) — expect insurance premiums to compound above CPI over the hold.
Questions for the listing agent
- It's been on market 163 days. Have you received any prior offers? Is the seller open to a 12% concession, seller financing, or rate buy-down credit?
- Built in 1970 — when were the roof, HVAC, electrical panel, plumbing, and water heater last replaced?
- What's the actual annual flood-insurance premium (NFIP or private), and is the property in a SFHA with mandatory coverage?
- What does the HOA fee cover, when was the last increase, and are there any pending special assessments or reserve-fund shortfalls?
- Any open or pending special assessments — roof, HVAC, plumbing, elevator, façade? What's the per-unit balance and payoff schedule, and is the seller paying it off at close or rolling it to the buyer?
- Why hasn't it sold? Are there any deal-killer items the seller is aware of (foundation, flood, title, zoning, code violations)?
- Is there a deadline driving the sale (1031 exchange, divorce, estate, relocation)? That informs how much negotiation room exists.
- Schools are B-rated — typically a magnet for longer-tenancy family renters. What's the average tenant stay here, and is there a school-zone premium baked into asking?
- What's the average days-on-market for RENTAL listings here right now (not sales)? A rising rental-DOM trend means longer vacancies and softer asking-rent achievability than the comps imply.
- What's the recent tenant-quality profile in this submarket — average credit score on applications, eviction rate, late-payment / NSF rate, and stable-employment percentage? A property-management company in the area should have these aggregated.
- How much new apartment / multifamily construction is in the pipeline within 1–3 miles? Heavy new supply (>2% of stock underway) typically softens rents 12–24 months out; light construction supports rent growth.
Investment metrics
- 1% rule
- 1.27% ✓
- Cap rate
- 7.64%
- Cash-on-cash
- 4.82%
- DSCR
- 1.21
- GRM
- 6.6
CMA / ARV
No comps found within radius.
Projected returns pro-forma
4.08% appreciation · 8.0% rent growth · sell at horizon
- IRR
- 14.6%
- Equity multiple
- 1.92×
- Total profit
- $110,230
- Equity at exit
- $220,067
- IRR
- 18.8%
- Equity multiple
- 4.43×
- Total profit
- $412,527
- Equity at exit
- $361,624
Cash invested: $120,372 (down + closing). Projections, not guarantees.
Landlord ↔ Tenant lean methodology
- Overall (STATE)
- 87 Strongly Landlord-Friendly
- State Florida
- 87 Strongly Landlord-Friendly · R+3
- County
- — inherits STATE
- City
- — inherits STATE
ZIP-level market 34102
- Home prices YoY
- 1.3%
- Rents YoY
- 8.8%
- Active inventory
- 614
- Price-to-rent
- 6.6×
Monthly cashflow live
- Estimated rent
- $5,447 high interval (Pro) →
- Mortgage (P&I)
- −$2,254
- Tax est. 1.5%
- −$537 /mo · $6,448/yr
- Insurance
- −$179
- Flood insurance flood zone
- −$427 /mo · $5,118/yr
- HOA
- −$849
- Vacancy / Maint / Mgmt
- −$1,144
- Net cashflow
- $57
Break-even live
Sensitivity live
| Price | -10% $354 | -5% $206 | +0% $57 | +5% $-92 | +10% $-240 |
|---|---|---|---|---|---|
| Rent | -10% $-373 | -5% $-158 | +0% $57 | +5% $272 | +10% $487 |
| Rate | -1.0pp $273 | -0.5pp $166 | base $57 | +0.5pp $-54 | +1.0pp $-168 |
UW: 25.0% down · 7.5% · 30yr · 1.5% tax · 5.0% vac · 8.0% maint · 8.0% mgmt
Financing live
Cash to close
- Down payment
- $107,475
- Closing costs
- $12,897
- Reserves months
- —
- Total cash needed
- —
Loan-product check · same deal, 3 products live
Conventional
25% down · 7.5% · 30yr
- Down + closing
- —
- Monthly P&I
- —
- Monthly cashflow
- —
- DSCR
- —
- Eligible?
- —
Personal DTI + credit; lowest rate.
DSCR
20% down · 8.5% · 30yr
- Down + closing
- —
- Monthly P&I
- —
- Monthly cashflow
- —
- DSCR
- —
- Eligible?
- —
No personal income docs; deal must DSCR.
Hard money
10% down · 12.0% · 12mo
- Down + closing
- —
- Monthly P&I
- —
- Monthly cashflow
- —
- DSCR
- —
- Eligible?
- —
Short-term bridge; refi at stabilization.
Rent comps 40 comps
| Address | Beds | Baths | Sqft | Rent | $/sqft | DOM | Units | Dist |
|---|---|---|---|---|---|---|---|---|
| 1395 Curlew Ave Unit 4-3 Naples, FL | 2.0 | 2.0 | 975 | $7,000 | $7.18 | 24d | 1 | 0.01mi |
| 1435 Curlew Ave #1 Naples, FL | 2.0 | 2.0 | 975 | $2,850 | $2.92 | 22d | 1 | 0.04mi |
| 1435 Curlew Ave #1 Naples, FL | 2.0 | 2.0 | 975 | $2,850 | $2.92 | 24d | 1 | 0.04mi |
| 803 River Point Dr Unit 201B Naples, FL | 1.0 | 1.0 | 715 | $2,300 | $3.22 | 24d | 1 | 0.13mi |
| 805 River Point Dr Unit 307C Naples, FL | 1.0 | 1.0 | 816 | $2,700 | $3.31 | 24d | 1 | 0.13mi |
| 801 River Point Dr Unit 303A Naples, FL | 1.0 | 1.0 | 815 | $5,000 | $6.13 | 22d | 1 | 0.16mi |
| 1100 8th Ave S Naples, FL | 2.0 | 2.0 | 1218 | $9,000 | $7.39 | 14d | 5 | 0.31mi |
| 1555 Blue Point Ave Unit 3 Naples, FL | 2.0 | 2.0 | 1025 | $1,745 | $1.70 | 14d | 1 | 0.34mi |
| 1155 Sandpiper St Naples, FL | 2.0 | 2.0 | 1062 | $3,950 | $3.72 | 22d | 3 | 0.38mi |
| 1155 Sandpiper St Naples, FL | 2.0 | 2.0 | 1062 | $4,050 | $3.81 | 24d | 2 | 0.38mi |
| 1950 Mayfair ST Unit 716 Naples, FL | 1.0 | 1.0 | 710 | $3,330 | $4.69 | 14d | 1 | 0.40mi |
| 1950 Mayfair ST Unit 921 Naples, FL | 1.0 | 1.0 | 710 | $3,420 | $4.82 | 14d | 1 | 0.40mi |
| 1950 Mayfair ST Unit 1021 Naples, FL | 1.0 | 1.0 | 710 | $3,520 | $4.96 | 14d | 1 | 0.40mi |
| 1950 Mayfair ST Unit 802 Naples, FL | 1.0 | 1.0 | 710 | $3,355 | $4.73 | 14d | 1 | 0.40mi |
| 1950 Mayfair ST Unit 817 Naples, FL | 1.0 | 1.0 | 710 | $3,295 | $4.64 | 14d | 1 | 0.40mi |
| 1950 Mayfair ST Unit 901 Naples, FL | 2.0 | 2.0 | 1025 | $4,560 | $4.45 | 14d | 1 | 0.40mi |
| 1950 Mayfair ST Unit 1027 Naples, FL | 1.0 | 1.0 | 888 | $3,525 | $3.97 | 14d | 1 | 0.40mi |
| 980 7th Ave S Naples, FL | 1.0 | 1.0 | 540 | $7,500 | $13.89 | 24d | 2 | 0.41mi |
| 1535 Chesapeake Ave Unit A2 Naples, FL | 2.0 | 2.0 | 1080 | $2,000 | $1.85 | 24d | 1 | 0.41mi |
| 1686 Blue Point Ave Naples, FL | 2.0 | 2.0 | 1057 | $5,500 | $5.20 | 14d | 2 | 0.42mi |
| 450 Bayfront Pl Naples, FL | 1.0–3.0 | 1.0–2.5 | 1324 | $8,750 | $6.61 | 24d | 6 | 0.42mi |
| 950 7th Ave S #23 Naples, FL | 1.0 | 1.0 | 631 | $3,250 | $5.15 | 14d | 1 | 0.42mi |
| 1360 Chesapeake Ave Unit 1372 Naples, FL | 1.0 | 1.0 | 600 | $1,850 | $3.08 | 24d | 1 | 0.42mi |
| 1950 Mayfair St Naples, FL | 3.0 | 1.0–3.5 | 1514 | $8,752 | $5.78 | 14d | 109 | 0.44mi |
| 1605 Chesapeake Ave #2 Naples, FL | 2.0 | 1.0 | 850 | $2,300 | $2.71 | 24d | 1 | 0.44mi |
| 410 Bayfront Pl Naples, FL | 1.0–3.0 | 1.0–2.0 | 1242 | $7,875 | $6.34 | 24d | 6 | 0.44mi |
| 1751 Smugglers Cv Unit 2 1 Naples, FL | 2.0 | 1.0 | 800 | $1,995 | $2.49 | 14d | 1 | 0.45mi |
| 12 Knights Bridge Rd Unit A32 Naples, FL | 2.0 | 2.0 | 1095 | $3,200 | $2.92 | 22d | 1 | 0.58mi |
| 2134 Palm St Naples, FL | 1.0 | 1.0 | 600 | $7,500 | $12.50 | 24d | 1 | 0.60mi |
| 1549 Sandpiper St #36 Naples, FL | 2.0 | 2.0 | 1073 | $2,195 | $2.05 | 24d | 1 | 0.61mi |
| 960 7th St S #103 Naples, FL | 1.0 | 1.0 | 534 | $5,000 | $9.36 | 24d | 1 | 0.64mi |
| 636 Broad Ave S Unit 1259386P Naples, FL | 2.0 | 2.0 | 882 | $4,307 | $4.88 | 14d | 1 | 0.71mi |
| 609 12th Ave S #609 Naples, FL | 2.0 | 2.0 | 860 | $8,000 | $9.30 | 24d | 1 | 0.73mi |
| 546 Broad Ave S #546 Naples, FL | 2.0 | 2.0 | 890 | $4,800 | $5.39 | 24d | 1 | 0.79mi |
| 101 8th St S Naples, FL | 1.0 | 1.0–2.0 | 940 | $12,600 | $13.40 | 14d | 4 | 0.81mi |
| 101 8th St S Naples, FL | 1.0 | 1.0–2.0 | 940 | $12,600 | $13.40 | 24d | 4 | 0.81mi |
| 3001 Sandpiper Bay Cir Unit B106 Naples, FL | 2.0 | 2.0 | 1100 | $1,950 | $1.77 | 14d | 1 | 0.84mi |
| 540 4th Ave S #13 Naples, FL | 1.0 | 1.0 | 580 | $5,000 | $8.62 | 24d | 1 | 0.85mi |
| 766 Central Ave Naples, FL | 2.0–3.0 | 2.0 | 943 | $5,000 | $5.30 | 14d | 4 | 0.86mi |
| 766 Central Ave Naples, FL | 2.0–3.0 | 2.0 | 855 | $6,300 | $7.37 | 22d | 3 | 0.86mi |
HOA detail condo
- Monthly dues
- $849 · $10,188/yr
- Assessments
- None detected in remarks — confirm with the listing agent.
Listing history 20 events
-
2026-06-18days on market $429,900 Active 163 DOM
-
2026-06-17days on market $429,900 Active 162 DOM
-
2026-06-16days on market $429,900 Active 161 DOM
-
2026-06-15days on market $429,900 Active 160 DOM
-
2026-06-14days on market $429,900 Active 158 DOM
-
2026-06-10days on market $429,900 Active 155 DOM
-
2026-06-09days on market $429,900 Active 154 DOM
-
2026-06-08days on market $429,900 Active 153 DOM
-
2026-06-07days on market $429,900 Active 152 DOM
-
2026-06-03days on market $429,900 Active 148 DOM
-
2026-06-02days on market $429,900 Active 147 DOM
-
2026-06-01days on market $429,900 Active 146 DOM
-
2026-05-31days on market $429,900 Active 145 DOM
-
2026-05-30days on market $429,900 Active 144 DOM
-
2026-01-06$429,900 Active
-
2025-06-30historical
-
2025-03-28price $499,900
-
2024-11-21status Active
-
2024-11-14historical
-
2024-10-24$545,000 Active
ⓘ Source: listings_history table (triggers on properties + properties_extension) + one-shot
backfill from property_details.listing_events for pre-trigger history.
Climate risk First Street
- Flood 9/10 Extreme FEMA zone AE · 99% chance over 30 yrs
- Wildfire 3/10 Moderate
- Heat 10/10 Extreme 7 d/yr ≥107°F today · 26 d/yr by 30 yrs out
- Wind 10/10 Extreme 99% chance of damaging wind over 30 yrs
- Air quality 3/10 Moderate 3 unhealthy d/yr today · 3 by 30 yrs out
Nearby sold comps map
Loading sold comps map…
Walkable amenities ~0.75 mi
Loading nearby amenities…
Taxation est. · year 1
- Rental income
- $65,369
- − Mortgage interest
- −$24,081
- − Property taxes
- −$6,448
- − Insurance
- −$7,268
- − Repairs & maintenance
- −$5,230
- − Management
- −$5,230
- − HOA
- −$10,188
- − Depreciation
- −$12,506
- Taxable loss
- −$5,582
- Est. tax savings @ 24.0%
- +$1,340
- After-tax cash flow
- $2,023/yr
For passive investors: Depreciation is non-cash, so a rental often shows a tax loss while cash-flowing — sheltering income. Rental losses are passive: they offset passive income freely, and up to $25,000/yr can offset ordinary (W-2) income if you actively participate and your MAGI is under $100k (phasing out to $0 by $150k); unused losses carry forward. On sale, claimed depreciation is recaptured at up to 25%, and gains may owe capital-gains tax (a 1031 exchange can defer both). Figures are a year-1 estimate at your 24.0% rate — not tax advice; consult a CPA.
Schools (NCES district)
No district data.
Livability — Naples
- Score
- 80/100
- State rank
- #126
- US rank
- #1903
Category grades
Schools grade is shown separately in the Schools card above.
Census & demographics
- Census place
- Naples, FL
- County
- Collier County · 396,295 people
- City population
- 344,941
- Metro
- Naples-Marco Island, FL
- Population (ZIP)
- 11,179
- Household income
- $130,929
- Rent vs Own
- Severe rent burden
- 333.0
Population outlook (Collier County) Hauer SSP2
- Today (2025)
- 420,858 people
- By 2030
- 450,054 · +6.9%
- By 2040
- 502,232 · +19.3%
- By 2050
- 544,932 · +29.5%
- By 2075
- 627,203 · +49.0%
- By 2100
- 659,015 · +56.6%
Race, ethnicity, and origin ACS 2023
- Neighborhood character
- Predominantly White (79%)
- Race & ethnicity
- White 79% Hispanic / Latino 9% Two or more races 8% Black 8% Asian 1%
- Hispanic origin (detail)
- Cuban 6%
- Common ancestry
- Hispanic 4% Lithuanian 4% Romanian 4%
- Foreign-born
- 17% · Canada, China
- Languages at home
- 87% English-only · Spanish 7% French/Haitian/Cajun 4% German/W. Germanic 1%
Political lean MEDSL · Collier
- 2024 margin
- Solid R (+33.1) · D 33.1% · R 66.2%
- 2008→2024 swing
- -10.6pp toward R · 2008: -22.5pp · 2024: -33.1pp
- All cycles
- 2024: R+33.1 2020: R+24.7 2016: R+26.0 2012: R+30.1 2008: R+22.5
Not yet ingested
- Civics
- —
Market trends
- HPI YoY
- ▲ 4.08%
- Current HPI
- 328.2755
- Rent YoY
- ▲ 8.75%
- Metro
- Naples-Marco Island, FL
- State GDP YoY
- ▲ 3.28%
- F500 in state
- 36
Industry mix (Fortune 500 HQ in FL)
| Industry | F500 HQs | Revenue |
|---|---|---|
| Industrial Technology | 2 | $29B |
|
||
| Insurance | 2 | $17B |
|
||
| Retail | 1 | $60B |
|
||
| Technology Distribution | 1 | $58B |
|
||
| Homebuilding | 1 | $35B |
|
||
| Technology Manufacturing | 1 | $35B |
|
||
Price history
-21.1% since first listed6 events — show timeline
- 2026-01-06 Listed $429,900 NAPLESMLS
- 2025-06-30 Listing Removed — NAPLESMLS
- 2025-03-28 Price Changed $499,900 NAPLESMLS
- 2024-11-21 Relisted — NAPLESMLS
- 2024-11-14 Listing Removed — NAPLESMLS
- 2024-10-24 Listed $545,000 NAPLESMLS
Cash-flow waterfall
monthlySold comps — $/sqft
last 12 mo · ≤1 miLoading sold comps…