 5-Plex
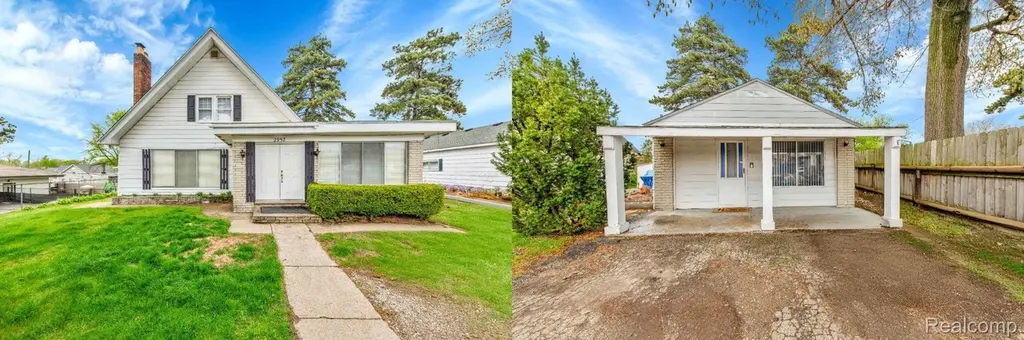
2952 PRYNNE St · Keego Harbor, MI
Flood risk 1/10 · Minimal
- FEMA flood zone
- X (unshaded)
- Chance of flooding over 30 yrs
- 0.0%
- Est. flood insurance / yr
- $473 – $860
Fire risk 1/10 · Minimal
- Est. fire insurance / yr
- $784 – $1,456
Heat risk 2/10 · Minimal
- Hot days now (above 97°F)
- 7 days/yr
- Hot days in 30 yrs
- 15 days/yr
Wind risk 2/10 · Minimal
- Chance of severe wind over 30 yrs
- —
Air-quality risk 3/10 · Minor
- Unhealthy air days now
- 2 days/yr
- Unhealthy air days in 30 yrs
- 4 days/yr
Risk factors via First Street. Map © Google.
Why this score? — see what drove the C+ grade
The composite is a weighted blend of 9 inputs, each scored 0–100. Each bar is that input's sub-score; the figure is the points it added to the 100-point composite (weight × sub-score).
- Cash flow +23.0/30.0
- ARV discount +7.5/15.0
- DSCR +7.4/10.0
- 1% rule +5.4/10.0
- Appreciation +5.0/10.0
- Schools +4.5/10.0
- Livability +3.9/5.0
- Rent growth +2.5/5.0
- Condition / age +2.5/5.0
$525,000
🖨 Deal sheet (PDF) 📄 Offer letter ✓ Due diligence
Multi-family units
County records classify this as Multi-Family (5+ Unit). Listing-text estimate: 5 units. confirmed
5+ unit building — per-unit beds/baths from public records are typically unavailable; the breakdown below (if shown) is an estimate from the listing text.
Listing remarks
This is a fantastic opportunity to own this multi-tenant property with two buildings on two commercial lots, offering a total of five units. Ideal for investors seeking steady income and long-term value, the property is located in the West Bloomfield School District and is currently fully occupied. The property has been well-maintained, with replacements made as needed. Some units have newer flooring, and all have separate entrances. Each unit features its own thermostat, with the heating system set up in zones. The roof is under 10 years old, and new water heaters were installed in 2023. The standalone building includes a two-car garage attached in the back alleyway, currently utilized by
Key facts
- Newer flooring
- Five units
- Own thermostat
Tags
Property features AI
Finance
- Financial info: Multi-family with 5 total units; Reported total expenses: $18,654; Reported net operating income: $24,446; Reported rents by unit: $800, $700, $600, $600, $950
- HOA & community: Private entry listed as a community amenity
Exterior
- Utilities: Public water; Natural gas; Electric included for some leases; Heat included for some leases; Water included for some leases
- Home design: Multi-family property; Ranch style; 1 story; Built in 1927; Frontage approximately 93 feet; Located in a city (Keego Harbor), north of Orchard Lake Road and east of Cass Lake Road
- Construction: Slab foundation
- Exterior features: Aluminum, brick and stone exterior; Fenced yard; Porch; Exterior balcony; Private road access
Interior
- Bathrooms: 5 full bathrooms
- Heating & cooling: Baseboard heating; Hot water heating; Zoned heating; Window air conditioning units; Natural gas water heater
- Interior features: Private entry
Neighborhood map
What this means for you Summary
Snapshot
- This is a 5 × 2-bed/1-bath units multifamily listed at $525k.
Deal economics
- At list price, monthly cash flow is $934 ($11k/yr) — positive. Per door: $187/mo.
- The deal already cash-flows at list — no discount required.
- Meets the 1% rule at list price ($5k rent vs $525k).
- Cap rate 8.4% vs local median 3.8% in Keego Harbor — top-decile yield for the area; either an underpriced asset or a hidden risk that comps aren't pricing in. Stress-test before assuming the spread holds.
Location & tenants
- Location reads 78/100 on livability (#110 in MI, #2,643 nationally) — a middle-class / working-renter tenant base. Strengths: crime A+, cost of living A+, housing A+; Watch: amenities D-, commute F.
- West Bloomfield School District (suburban): math 42% / reading 55% proficiency, ranked #83 of 540 in MI (top 15%) — families likely to look elsewhere, expect single-tenant / working-renter base with shorter leases.
- Zoned schools: Roosevelt Elementary School (math 48% / reading 61%, grade C, #276 of 1,397 statewide, top 22%, 356 students, 49% FRL); West Bloomfield Middle School (math 46% / reading 55%, grade C, #110 of 493 statewide, top 23%, 941 students, 42% FRL); West Bloomfield High School (math 40% / reading 61%, grade D+, #146 of 713 statewide, top 21%, 1,652 students, 34% FRL) — zoned schools average 42% FRL vs 23% district-wide (19 pts higher); higher-poverty schools than district average — tighter screening recommended.
- Market conditions: 1 active listings in the ZIP; 5 comparable units currently listed for rent nearby; rentals leasing fast (median 4d on market — plan ~1-2 weeks tenant-placement turnaround); 2,614 units permitted in Oakland County in 2024 (721 in 5+ unit buildings).
Forward outlook
- In year one you build about $19k of equity ($4k loan paydown + $16k appreciation (3.0% local appreciation)).
- Oakland County population projected at +10% by 2050 — modest demand growth; plan on rents tracking national, not racing it.
- At projected returns (3.0% appreciation + 3.0% rent growth), your $147k cash investment doubles in ~5 years — after that, you're playing with house money.
- By year 2, paydown + projected appreciation supports a ~$32k cash-out refi (75% LTV) — recoverable capital for the next deal without selling this one.
Negotiation context
- Only 12 days on market — expect competitive offers; lowballing is unlikely to land.
- 3 sale attempts with the ask held roughly flat each time — persistent listings suggest the price (not the market) is what's stuck; bring a comps-based counter.
- Current owner paid $70k; list at $525k implies a 650% gain — meaningful room to come down on a strong offer.
Risks & watch-outs
- Watch-outs: built in 1927 — expect roof / HVAC / electrical / plumbing capex.
Questions for the listing agent
- Can we see the unit-by-unit rent roll, current vacancy, and any below-market leases? What's the average tenancy length?
- What capital expenditures (roof, boiler, parking lot, exteriors) have been made in the last 5 years, and what's planned in the next 2?
- Built in 1927 — when were the roof, HVAC, electrical panel, plumbing, and water heater last replaced?
- Is there a deadline driving the sale (1031 exchange, divorce, estate, relocation)? That informs how much negotiation room exists.
- What's the average days-on-market for RENTAL listings here right now (not sales)? A rising rental-DOM trend means longer vacancies and softer asking-rent achievability than the comps imply.
- What's the recent tenant-quality profile in this submarket — average credit score on applications, eviction rate, late-payment / NSF rate, and stable-employment percentage? A property-management company in the area should have these aggregated.
- How much new apartment / multifamily construction is in the pipeline within 1–3 miles? Heavy new supply (>2% of stock underway) typically softens rents 12–24 months out; light construction supports rent growth.
Investment metrics
- 1% rule
- 1.04% ✓
- Cap rate
- 8.43%
- Cash-on-cash
- 7.63%
- DSCR
- 1.34
- GRM
- 8.0
CMA / ARV
- ARV (median comp)
- $225,773
- List price
- $525,000
- Delta
- 121.46%
- Verdict
- OVERPRICED
- Comps
- 2 within 2.0 mi
Projected returns pro-forma
3.0% appreciation · 3.0% rent growth · sell at horizon
- IRR
- 14.6%
- Equity multiple
- 1.83×
- Total profit
- $122,679
- Equity at exit
- $236,063
- IRR
- 16.4%
- Equity multiple
- 3.40×
- Total profit
- $353,286
- Equity at exit
- $363,801
Cash invested: $147,000 (down + closing). Projections, not guarantees.
Landlord ↔ Tenant lean methodology
- Overall (STATE)
- 62 Landlord-Friendly
- State Michigan
- 62 Landlord-Friendly · EVEN
- County
- — inherits STATE
- City
- — inherits STATE
ZIP-level market 48320 1242
- Active inventory
- 1
- Price-to-rent
- 40.2×
Monthly cashflow live
- Estimated rent
- $5,439 medium interval (Pro) →
- Mortgage (P&I)
- −$2,753
- Tax from tax record
- −$390 /mo · $4,685/yr
- Insurance
- −$219
- HOA
- −$0
- Vacancy / Maint / Mgmt
- −$1,142
- Net cashflow
- $934
Break-even live
Sensitivity live
| Price | -10% $1,232 | -5% $1,083 | +0% $934 | +5% $786 | +10% $637 |
|---|---|---|---|---|---|
| Rent | -10% $505 | -5% $720 | +0% $934 | +5% $1,149 | +10% $1,364 |
| Rate | -1.0pp $1,199 | -0.5pp $1,068 | base $934 | +0.5pp $798 | +1.0pp $660 |
5-unit breakdown (identical units grouped — click to expand)
| Units | Beds | Baths | Est. rent |
|---|---|---|---|
| 5× units | 2 | 1 | $5,440 |
| #1 | 2 | 1 | $1,088 |
| #2 | 2 | 1 | $1,088 |
| #3 | 2 | 1 | $1,088 |
| #4 | 2 | 1 | $1,088 |
| #5 | 2 | 1 | $1,088 |
| Total (5 units) | $5,439 | ||
UW: 25.0% down · 7.5% · 30yr · 1.5% tax · 5.0% vac · 8.0% maint · 8.0% mgmt
Financing live
Cash to close
- Down payment
- $131,250
- Closing costs
- $15,750
- Reserves months
- —
- Total cash needed
- —
Loan-product check · same deal, 3 products live
Conventional
25% down · 7.5% · 30yr
- Down + closing
- —
- Monthly P&I
- —
- Monthly cashflow
- —
- DSCR
- —
- Eligible?
- —
Personal DTI + credit; lowest rate.
DSCR
20% down · 8.5% · 30yr
- Down + closing
- —
- Monthly P&I
- —
- Monthly cashflow
- —
- DSCR
- —
- Eligible?
- —
No personal income docs; deal must DSCR.
Hard money
10% down · 12.0% · 12mo
- Down + closing
- —
- Monthly P&I
- —
- Monthly cashflow
- —
- DSCR
- —
- Eligible?
- —
Short-term bridge; refi at stabilization.
Rent comps 5 comps
| Address | Beds | Baths | Sqft | Rent | $/sqft | DOM | Units | Dist |
|---|---|---|---|---|---|---|---|---|
| 3048 Andre St Keego Harbor, MI | 3.0 | 1.0 | 920 | $1,995 | $2.17 | 13d | 1 | 0.10mi |
| 1574 Kessler Ave Keego Harbor, MI | 3.0 | 2.5 | 1659 | $2,500 | $1.51 | 4d | 1 | 0.71mi |
| 1574 Kessler Ave Keego Harbor, MI | 3.0 | 2.5 | 1659 | $2,500 | $1.51 | 0d | 1 | 0.71mi |
| 3530 Denise Ct Waterford Twp, MI | 1.0–2.0 | 1.0–1.5 | 1004 | $1,910 | $1.90 | 25d | 15 | 1.36mi |
| 3530 Denise Ct Waterford Twp, MI | 1.0–2.0 | 1.0–1.5 | 890 | $1,975 | $2.22 | 0d | 15 | 1.36mi |
Listing history 12 events
-
2026-06-21days on market $525,000 Active 12 DOM
-
2026-06-18days on market $525,000 Active 9 DOM
-
2026-06-17days on market $525,000 Active 8 DOM
-
2026-06-16days on market $525,000 Active 7 DOM
-
2026-06-15days on market $525,000 Active 6 DOM
-
2026-06-13days on market $525,000 Active 4 DOM
-
2026-06-10pricestatusdays on market $525,000 Active 1 DOM
-
2025-07-25price $500,000 1743-char remark
-
2025-05-12$550,000 Active 1743-char remark
-
2025-05-12$500,000 Active 1743-char remark
-
1979-06-01soldstatus $70,000
-
1977-10-01soldstatus $65,000
ⓘ Source: listings_history table (triggers on properties + properties_extension) + one-shot
backfill from property_details.listing_events for pre-trigger history.
Tax reassessment forecast MI · Partial reset (capped growth)
- Current annual tax
- $4,685 · $390/mo
- Projected year-2 tax
- $6,385 · $532/mo
- Expected delta
- +$1,700/yr (+$142/mo · 36.3%)
ⓘ Screening estimate from a state-policy table — verify with the county assessor before closing.
Climate risk First Street
- Flood 1/10 Low FEMA zone X (unshaded) · 0% chance over 30 yrs
- Wildfire 1/10 Low
- Heat 2/10 Low 7 d/yr ≥97°F today · 15 d/yr by 30 yrs out
- Wind 2/10 Low
- Air quality 3/10 Moderate 2 unhealthy d/yr today · 4 by 30 yrs out
Nearby sold comps map
Loading sold comps map…
Walkable amenities ~0.75 mi
Loading nearby amenities…
Taxation est. · year 1
- Rental income
- $65,268
- − Mortgage interest
- −$29,408
- − Property taxes
- −$4,685
- − Insurance
- −$2,625
- − Repairs & maintenance
- −$5,221
- − Management
- −$5,221
- − Depreciation
- −$15,273
- Taxable income
- $2,834
- Est. tax owed @ 24.0%
- −$680
- After-tax cash flow
- $10,533/yr
For passive investors: Depreciation is non-cash, so a rental often shows a tax loss while cash-flowing — sheltering income. Rental losses are passive: they offset passive income freely, and up to $25,000/yr can offset ordinary (W-2) income if you actively participate and your MAGI is under $100k (phasing out to $0 by $150k); unused losses carry forward. On sale, claimed depreciation is recaptured at up to 25%, and gains may owe capital-gains tax (a 1031 exchange can defer both). Figures are a year-1 estimate at your 24.0% rate — not tax advice; consult a CPA.
Schools (NCES district)
- District
- West Bloomfield School District
- NCES district ID
- 2635820
- Math proficiency
- 42% ▼ -6.00%
- Reading proficiency
- 55% ▼ -2.00%
- Median HH income
- $89,668
- Composite
- 45.28/100
- National rank
- #2653
- State rank
- #83 of 540 in MI
Livability — Keego Harbor
- Score
- 78/100
- State rank
- #110
- US rank
- #2643
Category grades
Schools grade is shown separately in the Schools card above.
Census & demographics
- Census place
- Keego Harbor, MI
Population outlook (Oakland County) Hauer SSP2
- Today (2025)
- 1,335,747 people
- By 2030
- 1,375,100 · +2.9%
- By 2040
- 1,435,385 · +7.5%
- By 2050
- 1,469,250 · +10.0%
- By 2075
- 1,531,946 · +14.7%
- By 2100
- 1,450,485 · +8.6%
Not yet ingested
- Political lean
- —
- Race & ethnicity
- —
- Common origin
- —
- Civics
- —
Market trends
- HPI YoY
- —
- Current HPI
- —
- Rent YoY
- —
- Metro
- —
- State GDP YoY
- ▲ 1.37%
- F500 in state
- 28
Industry mix (Fortune 500 HQ in MI)
| Industry | F500 HQs | Revenue |
|---|---|---|
| Automotive Parts | 3 | $48B |
|
||
| Automotive | 2 | $372B |
|
||
| Chemicals | 1 | $45B |
|
||
| Automotive Retail | 1 | $29B |
|
||
| Healthcare / Medical Devices | 1 | $23B |
|
||
| Automotive Technology | 1 | $20B |
|
||
Price history
+707.7% since first listed8 events — show timeline
- 2026-06-09 Listed $525,000 MiRealSource-MiMLS
- 2026-05-23 Listing Removed — REALCOMP
- 2026-05-22 Listing Removed — MiRealSource-MiMLS
- 2025-07-25 Price Changed $500,000 REALCOMP
- 2025-05-12 Listed $550,000 REALCOMP
- 2025-05-12 Listed $500,000 MiRealSource-MiMLS
- 1979-06-01 Sold (Public Records) $70,000 Public Records
- 1977-10-01 Sold (Public Records) $65,000 Public Records
Property tax history
+0.8%/yrLatest (2025): $4,685 · +3.1% YoY. Source: county tax records.
Cash-flow waterfall
monthlySold comps — $/sqft
last 12 mo · ≤1 miLoading sold comps…