 🏷️ Likely Rental
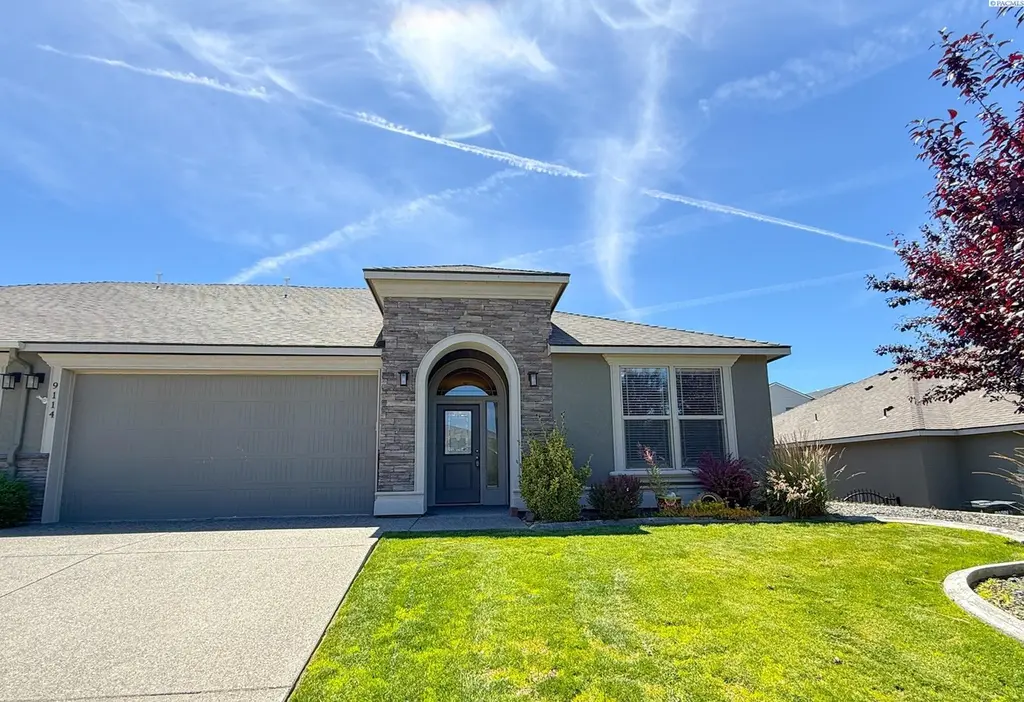
9114 Ruven St · Pasco, WA
Flood risk 1/10 · Minimal
- FEMA flood zone
- X
- Chance of flooding over 30 yrs
- 0.0%
- Est. flood insurance / yr
- $507 – $1,088
Fire risk 4/10 · Minor
- Est. fire insurance / yr
- $604 – $1,122
Heat risk 5/10 · Moderate
- Hot days now (above 99°F)
- 8 days/yr
- Hot days in 30 yrs
- 17 days/yr
Wind risk 1/10 · Minimal
- Chance of severe wind over 30 yrs
- —
Air-quality risk 7/10 · Major
- Unhealthy air days now
- 9 days/yr
- Unhealthy air days in 30 yrs
- 11 days/yr
Risk factors via First Street. Map © Google.
Why this score? — see what drove the D+ grade
The composite is a weighted blend of 9 inputs, each scored 0–100. Each bar is that input's sub-score; the figure is the points it added to the 100-point composite (weight × sub-score).
- Cash flow +15.0/30.0
- ARV discount +7.5/15.0
- 1% rule +5.0/10.0
- DSCR +5.0/10.0
- Livability +4.0/5.0
- Schools +3.4/10.0
- Rent growth +3.0/5.0
- Condition / age +2.5/5.0
- Appreciation +0.0/10.0
$2,395
🖨 Deal sheet 📄 Offer letter ✓ Due diligence
Listing remarks MLS
1641 sq ft Town home offering great location, fully landscaping. Infinity Homes spectacular finish with crown molding, granite/quartz counters, self close quality cabinets. Split bedrooms with master offering walk in closet double vanities and tile floors. Raise ceilings in great room , covered patios. Two car garage, small yards, bring your pooch. Pictures of similar unit.
Key facts
- Eat-at island
- Generous pantry
- Tiled backsplash
Tags
Property features AI
Exterior
- Parking: 2 total parking spaces; 2 covered parking spaces; 2-car garage
- Home design: Townhouse; Single-story (one level); New construction
- Construction: Built as part of new construction
- Exterior features: Lot measures about 4,356 square feet; Zoned single-family residential; Subdivision: SHORT PLAT
Interior
- Bathrooms: 1 full bathroom; 1 three-quarter bathroom
- Interior features: No basement
Neighborhood map
What this means for you Summary
Snapshot
- This is a 3-bed/2.0-bath townhouse listed at $2k.
Deal economics
- At list price, monthly cash flow is $2k ($21k/yr) — positive.
- The deal already cash-flows at list — no discount required.
- Meets the 1% rule at list price ($2k rent vs $2k).
- Cap rate 872.9% vs local median 3.0% in Pasco — top-decile yield for the area; either an underpriced asset or a hidden risk that comps aren't pricing in. Stress-test before assuming the spread holds.
Location & tenants
- Location reads 79/100 on livability (#104 in WA, #1,999 nationally) — a middle-class / working-renter tenant base. Strengths: commute A+, housing A+, health & safety A+; Watch: crime D+, schools D-.
- Pasco School District (suburban): math 31% / reading 40% proficiency, ranked #242 of 291 in WA (top 83%) — families likely to look elsewhere, expect single-tenant / working-renter base with shorter leases; 61% free/reduced lunch — lower-income household profile, screen leases tightly.
- Market conditions: Rents rising (+2.0%/yr); 705 active listings in the ZIP; 20 comparable units currently listed for rent nearby; rentals at typical pace (median 21d on market — plan ~3-4 weeks tenant-placement turnaround); solid renter incomes; 981 units permitted in Franklin County in 2024 (517 in 5+ unit buildings).
- This rent runs 30% of the median local income ($88k/yr) — at the standard rent-burdened threshold; future hikes will face affordability resistance.
Forward outlook
- Local home prices are declining (-3.0%/yr); year-one equity from $16 of loan paydown is wiped out by about $72 of value loss. Plan a longer hold.
- Franklin County population projected at +50% by 2050 — long-run rental-demand tailwind backs the buy-and-hold thesis.
- At projected returns (-3.0% appreciation + 2.0% rent growth), your $671 cash investment doubles in ~1 year — after that, you're playing with house money.
Negotiation context
- Only 7 days on market — expect competitive offers; lowballing is unlikely to land.
- 2 sale attempts since 7y ago with the ask held roughly flat each time — persistent listings suggest the price (not the market) is what's stuck; bring a comps-based counter.
Risks & watch-outs
- Climate carrying-cost: extreme-heat days projected 8→17/yr by 2055 (HVAC capex compounding) — expect insurance premiums to compound above CPI over the hold.
Questions for the listing agent
- Is there a deadline driving the sale (1031 exchange, divorce, estate, relocation)? That informs how much negotiation room exists.
- Schools are D-rated, which usually means shorter tenancies and higher turnover. Who's the typical renter profile here, and what's been the actual vacancy rate?
- Crime grade is D in this area — have there been break-ins, vandalism, or insurance claims at this property in the last 3 years? What carrier currently insures it and at what premium?
- The area grade is low — what's the realistic commute time and amenity access for the typical tenant pool here? Any planned neighborhood developments (good or bad) we should know about?
- What's the average days-on-market for RENTAL listings here right now (not sales)? A rising rental-DOM trend means longer vacancies and softer asking-rent achievability than the comps imply.
- What's the recent tenant-quality profile in this submarket — average credit score on applications, eviction rate, late-payment / NSF rate, and stable-employment percentage? A property-management company in the area should have these aggregated.
- How much new for-sale + rental construction is in the pipeline within 1–3 miles? Heavy new supply typically softens prices + rents 12–24 months out; constrained supply supports both.
Investment metrics
- 1% rule
- 92.29% ✓
- Cap rate
- 872.94%
- Cash-on-cash
- 3095.16%
- DSCR
- 138.72
- GRM
- 0.1
CMA / ARV
- ARV (on-the-fly)
- $361,680
- Comps found
- 12
Show comp detail 12 sales within ~0.75 mi
| Address | Dist | Beds/Ba | Sqft | Sold | Price | $/sf | Match |
|---|---|---|---|---|---|---|---|
| 6011 Mia Ln | 0.26mi | 3/2.5 | 1,675 (+2%) | 8mo | $365,000 | $218 | 76 |
| 9411 Vincenzo Dr | 0.23mi | 3/2.5 | 1,675 (+2%) | 10mo | $380,000 | $227 | 76 |
| 9627 Mia Ln | 0.36mi | 3/2.5 | 1,675 (+2%) | 3mo | $360,000 | $215 | 76 |
| 6020 Majestia Ln | 0.24mi | 3/2.5 | 1,683 (+2%) | 13mo | $375,000 | $223 | 72 |
| 9415 Vincenzo Dr | 0.25mi | 3/2.0 | 1,803 (+10%) | 3mo | $375,000 | $208 | 70 |
| 9419 Vincenzo Dr | 0.26mi | 3/2.0 | 1,803 (+10%) | 5mo | $385,000 | $214 | 68 |
| 9612 Mia Ln | 0.31mi | 3/2.0 | 1,803 (+10%) | 6mo | $374,000 | $207 | 65 |
| 9605 Vincenzo Dr | 0.32mi | 3/2.0 | 1,803 (+10%) | 8mo | $380,000 | $211 | 62 |
| 9621 Mia Ln #1 | 0.34mi | 3/2.0 | 1,407 (-14%) | 7mo | $325,000 | $231 | 55 |
| 9906 Mia Ln | 0.49mi | 3/2.5 | 1,509 (-8%) | 12mo | $343,500 | $228 | 52 |
| 9719 Mia Ln | 0.41mi | 3/2.5 | 1,509 (-8%) | 16mo | $357,900 | $237 | 52 |
| 9816 Vincenzo Dr | 0.45mi | 3/2.5 | 1,509 (-8%) | 15mo | $332,000 | $220 | 51 |
Match score weights: distance 35% · size 25% · config 20% · recency 20%. Top-matched comps best support the ARV.
Projected returns pro-forma
-3.0% appreciation · 1.99% rent growth · sell at horizon
- IRR
- —
- Equity multiple
- 161.43×
- Total profit
- $107,585
- Equity at exit
- $357
- IRR
- —
- Equity multiple
- 339.10×
- Total profit
- $226,731
- Equity at exit
- $207
Cash invested: $671 (down + closing). Projections, not guarantees.
Landlord ↔ Tenant lean methodology
- Overall (STATE)
- 28 Tenant-Leaning
- State Washington
- 28 Tenant-Leaning · D+8
- County
- — inherits STATE
- City
- — inherits STATE
ZIP-level market 99301
- Rents YoY
- 2.0%
- Active inventory
- 705
- Price-to-rent
- 0.1×
Monthly cashflow live
- Estimated rent
- $2,210 high interval (Pro) →
- Mortgage (P&I)
- −$13
- Tax est. 1.5%
- −$3 /mo · $36/yr
- Insurance
- −$1
- HOA
- −$0
- Vacancy / Maint / Mgmt
- −$464
- Net cashflow
- $1,730
Break-even live
UW: 25.0% down · 7.5% · 30yr · 1.5% tax · 5.0% vac · 8.0% maint · 8.0% mgmt
Financing live
Cash to close
- Down payment
- $599
- Closing costs
- $72
- Reserves months
- —
- Total cash needed
- —
Loan-product check · same deal, 3 products live
Conventional
25% down · 7.5% · 30yr
- Down + closing
- —
- Monthly P&I
- —
- Monthly cashflow
- —
- DSCR
- —
- Eligible?
- —
Personal DTI + credit; lowest rate.
DSCR
20% down · 8.5% · 30yr
- Down + closing
- —
- Monthly P&I
- —
- Monthly cashflow
- —
- DSCR
- —
- Eligible?
- —
No personal income docs; deal must DSCR.
Hard money
10% down · 12.0% · 12mo
- Down + closing
- —
- Monthly P&I
- —
- Monthly cashflow
- —
- DSCR
- —
- Eligible?
- —
Short-term bridge; refi at stabilization.
Rent comps 20 comps
| Address | Beds | Baths | Sqft | Rent | $/sqft | DOM | Units | Dist |
|---|---|---|---|---|---|---|---|---|
| 5801 Road 92 Pasco, WA | 3.0 | 2.5 | 1449 | $2,250 | $1.55 | 13d | 4 | 0.03mi |
| 9417 Vincenzo Dr Pasco, WA | 3.0 | 3.0 | 1675 | $2,195 | $1.31 | 43d | 1 | 0.28mi |
| 9904 Mia Ln Pasco, WA | 3.0 | 2.5 | 1509 | $1,950 | $1.29 | 21d | 1 | 0.50mi |
| 9315 Chapel Hill Blvd Pasco, WA | 1.0–4.0 | 1.0–2.0 | 1015 | $1,507 | $1.48 | 13d | 10 | 0.58mi |
| 8011 Hudson Dr Pasco, WA | 4.0 | 2.0 | 1480 | $2,200 | $1.49 | 43d | 1 | 0.71mi |
| 7820 Three Rivers Dr Pasco, WA | 3.0 | 2.0 | 1440 | $2,300 | $1.60 | 21d | 1 | 0.79mi |
| 10181 Burns Rd Pasco, WA | 1.0–3.0 | 1.0–2.0 | 986 | $3,019 | $3.06 | 13d | 30 | 0.83mi |
| 4612 Belgian Ln Pasco, WA | 3.0 | 2.5 | 1984 | $2,450 | $1.23 | 13d | 1 | 0.85mi |
| 4519 Appaloosa Ln Pasco, WA | 3.0 | 2.0 | 1616 | $2,295 | $1.42 | 21d | 1 | 0.92mi |
| 10305 Chapel Hill Blvd Pasco, WA | 1.0–3.0 | 1.0–2.0 | 1045 | $1,810 | $1.73 | 13d | 8 | 0.93mi |
| 10518 Chinook Dr Pasco, WA | 3.0 | 2.0 | 1670 | $2,495 | $1.49 | 13d | 1 | 1.00mi |
| 6105 Road 108 Pasco, WA | 2.0 | 1.0–2.0 | 823 | $2,862 | $3.48 | 43d | 88 | 1.01mi |
| 10602 Burns Rd Pasco, WA | 2.0–3.0 | 2.0 | 1053 | $2,140 | $2.03 | 13d | 16 | 1.01mi |
| 6102 Road 68 Pasco, WA | 2.0–3.0 | 1.0–2.0 | 1007 | $1,548 | $1.54 | 13d | 4 | 1.03mi |
| 4909 Porlier Ln Pasco, WA | 2.0 | 2.5 | 2200 | $2,000 | $0.91 | 43d | 1 | 1.05mi |
| 4903 Porlier Ln Pasco, WA | 2.0 | 2.5 | 2200 | $2,000 | $0.91 | 43d | 1 | 1.06mi |
| 4912 Guemes Ln Pasco, WA | 3.0 | 3.5 | 2200 | $2,150 | $0.98 | 21d | 1 | 1.07mi |
| 4119 Bond Ln Pasco, WA | 3.0 | 2.0 | 1382 | $2,300 | $1.66 | 21d | 1 | 1.15mi |
| 7811 Babine Dr Pasco, WA | 3.0 | 2.0 | 2000 | $2,700 | $1.35 | 43d | 1 | 1.25mi |
| 11332 Dunsmuir Dr Pasco, WA | 3.0 | 2.0 | 1450 | $2,400 | $1.66 | 43d | 1 | 1.47mi |
Listing history 7 events
-
2026-06-18days on market $2,395 Active 7 DOM
-
2026-06-17days on market $2,395 Active 6 DOM
-
2026-06-16days on market $2,395 Active 5 DOM
-
2026-06-15days on market $2,395 Active 4 DOM
-
2026-06-14days on market $2,395 Active 2 DOM
-
2026-06-13remarks 699-char remark
-
2026-06-13$2,395 Active 1 DOM
ⓘ Source: listings_history table (triggers on properties + properties_extension) + one-shot
backfill from property_details.listing_events for pre-trigger history.
Climate risk First Street
- Flood 1/10 Low FEMA zone X · 0% chance over 30 yrs
- Wildfire 4/10 Moderate
- Heat 5/10 Major 8 d/yr ≥99°F today · 17 d/yr by 30 yrs out
- Wind 1/10 Low
- Air quality 7/10 Severe 9 unhealthy d/yr today · 11 by 30 yrs out
Nearby sold comps map
Loading sold comps map…
Walkable amenities ~0.75 mi
Loading nearby amenities…
Taxation est. · year 1
- Rental income
- $26,525
- − Mortgage interest
- −$134
- − Property taxes
- −$36
- − Insurance
- −$12
- − Repairs & maintenance
- −$2,122
- − Management
- −$2,122
- − Depreciation
- −$70
- Taxable income
- $22,029
- Est. tax owed @ 24.0%
- −$5,287
- After-tax cash flow
- $15,469/yr
For passive investors: Depreciation is non-cash, so a rental often shows a tax loss while cash-flowing — sheltering income. Rental losses are passive: they offset passive income freely, and up to $25,000/yr can offset ordinary (W-2) income if you actively participate and your MAGI is under $100k (phasing out to $0 by $150k); unused losses carry forward. On sale, claimed depreciation is recaptured at up to 25%, and gains may owe capital-gains tax (a 1031 exchange can defer both). Figures are a year-1 estimate at your 24.0% rate — not tax advice; consult a CPA.
Schools (NCES district)
- District
- Pasco School District
- NCES district ID
- 5306570
- Math proficiency
- 31% ▬ 0.00%
- Reading proficiency
- 40% ▬ 0.00%
- Median HH income
- $54,454
- Composite
- 33.78/100
- National rank
- #10401
- State rank
- #242 of 291 in WA
Livability — Pasco
- Score
- 79/100
- State rank
- #104
- US rank
- #1999
Category grades
Schools grade is shown separately in the Schools card above.
Census & demographics
- Census place
- Pasco, WA
- County
- Franklin County · 87,044 people
- City population
- 87,044
- Metro
- Kennewick-Richland, WA
- Population (ZIP)
- 87,044
- Household income
- $87,951
- Rent vs Own
- Severe rent burden
- 1556.0
Population outlook (Franklin County) Hauer SSP2
- Today (2025)
- 108,530 people
- By 2030
- 118,705 · +9.4%
- By 2040
- 140,053 · +29.0%
- By 2050
- 162,360 · +49.6%
- By 2075
- 217,667 · +100.6%
- By 2100
- 264,533 · +143.7%
Race, ethnicity, and origin ACS 2023
- Neighborhood character
- Diverse neighborhood (Simpson 0.56)
- Race & ethnicity
- Hispanic / Latino 55% White 37% Two or more races 22% Black 2% Asian 2% Native American 2%
- Hispanic origin (detail)
- Mexican 51%
- Common ancestry
- Lithuanian 2% Italian 2% Portuguese 2%
- Foreign-born
- 21% · Canada, Vietnam
- Languages at home
- 49% English-only · Spanish 47% Russian/Polish/Slavic 2% Other Asian/Pacific 0%
Political lean MEDSL · Franklin
- 2024 margin
- Strong R (+22.7) · D 37.4% · R 60.1% · Other 2.4%
- 2008→2024 swing
- +1.0pp toward D · 2008: -23.7pp · 2024: -22.7pp
- All cycles
- 2024: R+22.7 2020: R+14.5 2016: R+17.1 2012: R+25.2 2008: R+23.7
Not yet ingested
- Civics
- —
Market trends
- HPI YoY
- ▼ -331.74%
- Current HPI
- 284.481
- Rent YoY
- ▲ 1.99%
- Metro
- Kennewick-Richland, WA
- State GDP YoY
- ▲ 4.65%
- F500 in state
- 22
Industry mix (Fortune 500 HQ in WA)
| Industry | F500 HQs | Revenue |
|---|---|---|
| Retail | 2 | $269B |
|
||
| Technology / Retail | 1 | $638B |
|
||
| Technology | 1 | $245B |
|
||
| Telecommunications | 1 | $38B |
|
||
| Food / Beverage | 1 | $36B |
|
||
| Automotive / Trucks | 1 | $34B |
|
||
Price history
-99.2% since first listed3 events — show timeline
- 2026-06-11 Listed $2,395 PACMLS
- 2019-09-20 Sold (MLS) $294,850 PACMLS
- 2019-08-11 Listed $294,850 PACMLS
Property tax history
+40.5%/yrLatest (2026): $3,299 · +3.8% YoY. Source: county tax records.
Cash-flow waterfall
monthlySold comps — $/sqft
last 12 mo · ≤1 miLoading sold comps…