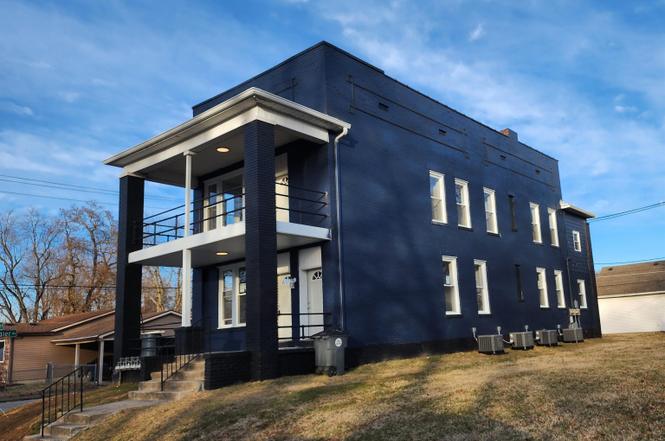
 Fourplex
800 Line St · Evansville, IN
Flood risk 4/10 · Minor
- FEMA flood zone
- X (unshaded)
- Chance of flooding over 30 yrs
- 0.21%
- Est. flood insurance / yr
- $473 – $860
Fire risk 1/10 · Minimal
- Est. fire insurance / yr
- $717 – $1,331
Heat risk 5/10 · Moderate
- Hot days now (above 107°F)
- 7 days/yr
- Hot days in 30 yrs
- 19 days/yr
Wind risk 2/10 · Minimal
- Chance of severe wind over 30 yrs
- 3.0%
Air-quality risk 4/10 · Minor
- Unhealthy air days now
- 3 days/yr
- Unhealthy air days in 30 yrs
- 5 days/yr
Risk factors via First Street. Map © Google.
Why this score? — see what drove the B grade
The composite is a weighted blend of 9 inputs, each scored 0–100. Each bar is that input's sub-score; the figure is the points it added to the 100-point composite (weight × sub-score).
- Cash flow +30.0/30.0
- DSCR +10.0/10.0
- 1% rule +9.8/10.0
- ARV discount +7.5/15.0
- Rent growth +5.0/5.0
- Schools +3.3/10.0
- Livability +3.2/5.0
- Condition / age +2.5/5.0
- Appreciation +0.0/10.0
$325,000
🖨 Deal sheet 📄 Offer letter ✓ Due diligence
Multi-family units
County records classify this as Multi-Family (2-4 Unit). Listing-text estimate: 4 units. confirmed
Listing remarks
Attention Investors! Are you looking for a performing and remodeled 4 unit apartment building in downtown Evansville? This is it! This building has been remodeled in the past 2 years. Roof - 1 Year old | All HVAC's - 2 Years old | All Water heaters - 2 years old | Windows, doors, flooring (LVP), kitchens, bathrooms, lights, paint, trims, and more, all within the past 2 years! Tenant pays for electric and gas The landlord pays for water/sewer/trash. Each unit is individually plumbed in the basement, so you can take over and install sub-meters to bill water directly to the tenant if you want to. Total Current Rent $3,040/m | Unit A - $765/m - Market rent is $775-800 | Unit B - $725/m - Mar
Key facts
- New hvacs
- New doors
- New flooring
Tags
Property features AI
Finance
- Other: Green energy-efficiency upgrades to doors, HVAC, water heater and windows
Exterior
- Parking: On-street parking
- Utilities: Public water; Public sewer
- Home design: Residential income property (quadruplex / fourplex); 2 stories
- Construction: Brick construction; Brick/mortar foundation; Rolled/Hot Mop and rubber roof
- Exterior features: Level lot; Pets allowed
Interior
- Kitchen: Includes dishwasher, microwave, range, refrigerator
- Flooring: Tile flooring; Vinyl flooring
- Bathrooms: 4 full bathrooms (all on the main level)
- Heating & cooling: Central air conditioning; Forced air heating with natural gas
- Interior features: Dishwasher, Microwave, Range, Refrigerator; Tile and vinyl flooring; Has a basement (partial, crawl space)
Neighborhood map
What this means for you Summary
Snapshot
- This is a 4 × 4-bed/4.0-bath units multifamily listed at $325k.
Deal economics
- At list price, monthly cash flow is $2k ($22k/yr) — positive. Per door: $459/mo.
- The deal already cash-flows at list — no discount required.
- Meets the 1% rule at list price ($5k rent vs $325k).
- Recommended offer: $296k (9.0% below list) — sets the bar for market timing.
- Cap rate 13.1% vs local median 4.6% in Evansville — top-decile yield for the area; either an underpriced asset or a hidden risk that comps aren't pricing in. Stress-test before assuming the spread holds.
Location & tenants
- Location reads 63/100 on livability (#416 in IN) — a middle-class / working-renter tenant base. Strengths: cost of living A+, housing A+, health & safety A+; Watch: crime F, commute F, employment D-.
- Evansville Vanderburgh School Corporation (urban): math 36% / reading 43% proficiency, ranked #153 of 301 in IN (top 51%) — families likely to look elsewhere, expect single-tenant / working-renter base with shorter leases.
- Zoned schools: West Terrace Elementary School (math 71% / reading 60%, grade B+, #75 of 994 statewide, top 8%, 560 students, 26% FRL); Perry Heights Middle School (math 43% / reading 56%, grade C, #50 of 330 statewide, top 16%, 470 students, 39% FRL); Francis Joseph Reitz High School (math 45% / reading 68%, grade C, #70 of 369 statewide, top 19%, 1,280 students, 44% FRL).
- Zoned-school proficiency averages 57% at this address vs 40% district-wide (+18 pts) — the actual schools serving this property are materially stronger than the Evansville Vanderburgh School Corporation average implies; a family-tenant draw the district grade alone would hide.
- Market conditions: Rents rising fast (+9.9%/yr); 118 active listings in the ZIP; 2 comparable units currently listed for rent nearby; lower-income renter base — watch delinquency; 508 units permitted in Vanderburgh County in 2024 (32 in 5+ unit buildings).
- At $4,813/mo this rent would consume 141% of the median local household income ($41k/yr) (locally 735% of renters already pay >50% of income on rent) — very limited rent-growth headroom before tenants either downsize or default.
Forward outlook
- Local home prices are declining (-3.0%/yr); year-one equity from $2k of loan paydown is wiped out by about $10k of value loss. Plan a longer hold.
- At projected returns (-3.0% appreciation + 8.0% rent growth), your $91k cash investment doubles in ~5 years — after that, you're playing with house money.
Negotiation context
- It's been on market 108 days — a 9% lower offer ($296k) is reasonable based on typical stale-listing flexibility.
- 4 sale attempts since 2y ago with the ask held roughly flat each time — persistent listings suggest the price (not the market) is what's stuck; bring a comps-based counter.
Risks & watch-outs
- Watch-outs: built in 1924 — expect roof / HVAC / electrical / plumbing capex.
- Climate carrying-cost: extreme-heat days projected 7→19/yr by 2055 (HVAC capex compounding) — expect insurance premiums to compound above CPI over the hold.
Questions for the listing agent
- It's been on market 108 days. Have you received any prior offers? Is the seller open to a 9% concession, seller financing, or rate buy-down credit?
- Can we see the unit-by-unit rent roll, current vacancy, and any below-market leases? What's the average tenancy length?
- What capital expenditures (roof, boiler, parking lot, exteriors) have been made in the last 5 years, and what's planned in the next 2?
- Built in 1924 — when were the roof, HVAC, electrical panel, plumbing, and water heater last replaced?
- Why hasn't it sold? Are there any deal-killer items the seller is aware of (foundation, flood, title, zoning, code violations)?
- Is there a deadline driving the sale (1031 exchange, divorce, estate, relocation)? That informs how much negotiation room exists.
- Schools are D-rated, which usually means shorter tenancies and higher turnover. Who's the typical renter profile here, and what's been the actual vacancy rate?
- Crime grade is F in this area — have there been break-ins, vandalism, or insurance claims at this property in the last 3 years? What carrier currently insures it and at what premium?
- What's the average days-on-market for RENTAL listings here right now (not sales)? A rising rental-DOM trend means longer vacancies and softer asking-rent achievability than the comps imply.
- What's the recent tenant-quality profile in this submarket — average credit score on applications, eviction rate, late-payment / NSF rate, and stable-employment percentage? A property-management company in the area should have these aggregated.
- How much new apartment / multifamily construction is in the pipeline within 1–3 miles? Heavy new supply (>2% of stock underway) typically softens rents 12–24 months out; light construction supports rent growth.
Investment metrics
- 1% rule
- 1.48% ✓
- Cap rate
- 13.08%
- Cash-on-cash
- 24.24%
- DSCR
- 2.08
- GRM
- 5.6
CMA / ARV
- ARV (on-the-fly)
- $165,088
- Comps found
- 8
Show comp detail 8 sales within ~0.75 mi
| Address | Dist | Beds/Ba | Sqft | Sold | Price | $/sf | Match |
|---|---|---|---|---|---|---|---|
| 1116 SE First St | 0.50mi | 3/4.0 | 2,940 (-0%) | 11mo | $180,000 | $61 | 67 |
| 817 SE Riverside Dr | 0.60mi | 4/4.0 (+1) | 2,768 (-6%) | 6mo | $199,700 | $72 | 52 |
| 205-207 Blackford Ave | 0.42mi | 4/2.0 (+1) | 2,717 (-8%) | 3mo | $322,000 | $119 | 52 |
| 1015 S Linwood Ave | 0.41mi | 4/1.5 (+1) | 2,639 (-10%) | 13mo | $51,666 | $20 | 38 |
| 913 Washington St | 0.62mi | 4/2.0 (+1) | 2,630 (-11%) | 7mo | $60,000 | $23 | 34 |
| 862 S Kentucky Ave | 0.69mi | 4/3.0 (+1) | 3,120 (+6%) | 20mo | $176,000 | $56 | 32 |
| 516 S Bedford Ave | 0.65mi | 4/2.0 (+1) | 2,578 (-13%) | 7mo | $71,000 | $28 | 30 |
| 524 Madison Ave | 0.39mi | 3/1.0 | 2,520 (-14%) | 22mo | $70,000 | $28 | 27 |
Match score weights: distance 35% · size 25% · config 20% · recency 20%. Top-matched comps best support the ARV.
Projected returns pro-forma
-3.0% appreciation · 8.0% rent growth · sell at horizon
- IRR
- 22.7%
- Equity multiple
- 1.99×
- Total profit
- $89,728
- Equity at exit
- $48,459
- IRR
- 33.6%
- Equity multiple
- 4.78×
- Total profit
- $344,222
- Equity at exit
- $28,100
Cash invested: $91,000 (down + closing). Projections, not guarantees.
Landlord ↔ Tenant lean methodology
- Overall (STATE)
- 90 Strongly Landlord-Friendly
- State Indiana
- 90 Strongly Landlord-Friendly · R+11
- County
- — inherits STATE
- City
- — inherits STATE
ZIP-level market 47713
- Home prices YoY
- -34.1%
- Rents YoY
- 9.9%
- Active inventory
- 118
- Price-to-rent
- 22.5×
Monthly cashflow live
- Estimated rent
- $4,813 medium interval (Pro) →
- Mortgage (P&I)
- −$1,704
- Tax from tax record
- −$125 /mo · $1,495/yr
- Insurance
- −$135
- HOA
- −$0
- Vacancy / Maint / Mgmt
- −$1,011
- Net cashflow
- $1,838
Break-even live
4-unit breakdown (identical units grouped — click to expand)
| Units | Beds | Baths | Est. rent |
|---|---|---|---|
| 4× units | 4 | 4 | $4,812 |
| #1 | 4 | 4 | $1,203 |
| #2 | 4 | 4 | $1,203 |
| #3 | 4 | 4 | $1,203 |
| #4 | 4 | 4 | $1,203 |
| Total (4 units) | $4,813 | ||
UW: 25.0% down · 7.5% · 30yr · 1.5% tax · 5.0% vac · 8.0% maint · 8.0% mgmt
Financing live
Cash to close
- Down payment
- $81,250
- Closing costs
- $9,750
- Reserves months
- —
- Total cash needed
- —
Loan-product check · same deal, 3 products live
Conventional
25% down · 7.5% · 30yr
- Down + closing
- —
- Monthly P&I
- —
- Monthly cashflow
- —
- DSCR
- —
- Eligible?
- —
Personal DTI + credit; lowest rate.
DSCR
20% down · 8.5% · 30yr
- Down + closing
- —
- Monthly P&I
- —
- Monthly cashflow
- —
- DSCR
- —
- Eligible?
- —
No personal income docs; deal must DSCR.
Hard money
10% down · 12.0% · 12mo
- Down + closing
- —
- Monthly P&I
- —
- Monthly cashflow
- —
- DSCR
- —
- Eligible?
- —
Short-term bridge; refi at stabilization.
Rent comps 2 comps
| Address | Beds | Baths | Sqft | Rent | $/sqft | DOM | Units | Dist |
|---|---|---|---|---|---|---|---|---|
| 1213 Washington Ave Evansville, IN | 4.0 | 1.0 | 1984 | $1,595 | $0.80 | 21d | 1 | 0.99mi |
| 27 W Franklin St Evansville, IN | 4.0 | 2.5 | 2500 | $1,100 | $0.44 | 21d | 1 | 1.02mi |
Listing history 21 events
-
2026-06-18days on market $325,000 Active 108 DOM
-
2026-06-17days on market $325,000 Active 107 DOM
-
2026-06-16days on market $325,000 Active 106 DOM
-
2026-06-15days on market $325,000 Active 105 DOM
-
2026-06-14days on market $325,000 Active 103 DOM
-
2026-06-13days on market $325,000 Active 102 DOM
-
2026-06-10days on market $325,000 Active 100 DOM
-
2026-06-09days on market $325,000 Active 99 DOM
-
2026-06-08days on market $325,000 Active 98 DOM
-
2026-06-07days on market $325,000 Active 97 DOM
-
2026-06-02days on market $325,000 Active 92 DOM
-
2026-06-01days on market $325,000 Active 91 DOM
-
2026-05-31days on market $325,000 Active 90 DOM
-
2026-05-30days on market $325,000 Active 89 DOM
-
2026-03-02$325,000 Active
-
2024-03-28historical $725
-
2024-03-24$725
-
2024-03-24historical $725
-
2024-03-19historical $725
-
2024-03-15$725
-
2024-03-13$750
ⓘ Source: listings_history table (triggers on properties + properties_extension) + one-shot
backfill from property_details.listing_events for pre-trigger history.
Tax reassessment forecast IN · Partial reset (capped growth)
- Current annual tax
- $1,495 · $125/mo
- Projected year-2 tax
- $2,129 · $177/mo
- Expected delta
- +$634/yr (+$53/mo · 42.4%)
ⓘ Screening estimate from a state-policy table — verify with the county assessor before closing.
Climate risk First Street
- Flood 4/10 Moderate FEMA zone X (unshaded) · 21% chance over 30 yrs
- Wildfire 1/10 Low
- Heat 5/10 Major 7 d/yr ≥107°F today · 19 d/yr by 30 yrs out
- Wind 2/10 Low 3% chance of damaging wind over 30 yrs
- Air quality 4/10 Moderate 3 unhealthy d/yr today · 5 by 30 yrs out
Nearby sold comps map
Loading sold comps map…
Walkable amenities ~0.75 mi
Loading nearby amenities…
Taxation est. · year 1
- Rental income
- $57,756
- − Mortgage interest
- −$18,205
- − Property taxes
- −$1,495
- − Insurance
- −$1,625
- − Repairs & maintenance
- −$4,620
- − Management
- −$4,620
- − Depreciation
- −$9,455
- Taxable income
- $17,735
- Est. tax owed @ 24.0%
- −$4,256
- After-tax cash flow
- $17,798/yr
For passive investors: Depreciation is non-cash, so a rental often shows a tax loss while cash-flowing — sheltering income. Rental losses are passive: they offset passive income freely, and up to $25,000/yr can offset ordinary (W-2) income if you actively participate and your MAGI is under $100k (phasing out to $0 by $150k); unused losses carry forward. On sale, claimed depreciation is recaptured at up to 25%, and gains may owe capital-gains tax (a 1031 exchange can defer both). Figures are a year-1 estimate at your 24.0% rate — not tax advice; consult a CPA.
Schools (NCES district)
- District
- Evansville Vanderburgh School Corporation
- NCES district ID
- 1803450
- Math proficiency
- 36% ▼ -7.00%
- Reading proficiency
- 43% ▼ -3.00%
- Median HH income
- $43,270
- Composite
- 33.41/100
- National rank
- #5471
- State rank
- #153 of 301 in IN
Livability — Evansville
- Score
- 63/100
- State rank
- #416
- US rank
- #15047
Category grades
Schools grade is shown separately in the Schools card above.
Census & demographics
- Census place
- Evansville, IN
- County
- Vanderburgh County · 146,793 people
- City population
- 146,793
- Metro
- Evansville, IN-KY
- Population (ZIP)
- 9,988
- Household income
- $40,873
- Rent vs Own
- Severe rent burden
- 735.0
Population outlook (Vanderburgh County) Hauer SSP2
- Today (2025)
- 187,038 people
- By 2030
- 188,907 · +1.0%
- By 2040
- 190,272 · +1.7%
- By 2050
- 188,871 · +1.0%
- By 2075
- 180,751 · -3.4%
- By 2100
- 163,015 · -12.8%
Race, ethnicity, and origin ACS 2023
- Neighborhood character
- Diverse neighborhood (Simpson 0.60)
- Race & ethnicity
- White 50% Black 39% Two or more races 7% Hispanic / Latino 3% Pacific Islander 1% Asian 1%
- Common ancestry
- Romanian 2% Lithuanian 1% Italian 1%
- Foreign-born
- 5% · Canada
- Languages at home
- 96% English-only · Spanish 2% Tagalog/Filipino 1% French/Haitian/Cajun 1%
Political lean MEDSL · Vanderburgh
- 2024 margin
- R (+12.7) · D 43.0% · R 55.6% · Other 1.4%
- 2008→2024 swing
- -15.1pp toward R · 2008: 2.5pp · 2024: -12.7pp
- All cycles
- 2024: R+12.7 2020: R+9.6 2016: R+16.9 2012: R+10.8 2008: D+2.5
Not yet ingested
- Civics
- —
Market trends
- HPI YoY
- ▼ -119.22%
- Current HPI
- 229.9312
- Rent YoY
- ▲ 9.87%
- Metro
- Evansville, IN-KY
- State GDP YoY
- ▲ 2.90%
- F500 in state
- 18
Industry mix (Fortune 500 HQ in IN)
| Industry | F500 HQs | Revenue |
|---|---|---|
| Industrial Machinery | 2 | $37B |
|
||
| Healthcare | 1 | $177B |
|
||
| Pharmaceuticals | 1 | $45B |
|
||
| Metals / Steel | 1 | $18B |
|
||
| Agriculture | 1 | $17B |
|
||
| Packaging | 1 | $12B |
|
||
Price history
7 events — show timeline
- 2026-03-02 Listed $325,000 IRMLS
- 2024-03-28 Rental Removed $725 APPFOLIO
- 2024-03-24 Listed for Rent $725 APPFOLIO
- 2024-03-24 Rental Removed $725 APPFOLIO
- 2024-03-19 Rental Removed $725 APPFOLIO
- 2024-03-15 Listed for Rent $725 APPFOLIO
- 2024-03-13 Listed for Rent $750 APPFOLIO
Property tax history
+5.4%/yrLatest (2024): $1,495 · +25.4% YoY. Source: county tax records.
Cash-flow waterfall
monthlySold comps — $/sqft
last 12 mo · ≤1 miLoading sold comps…