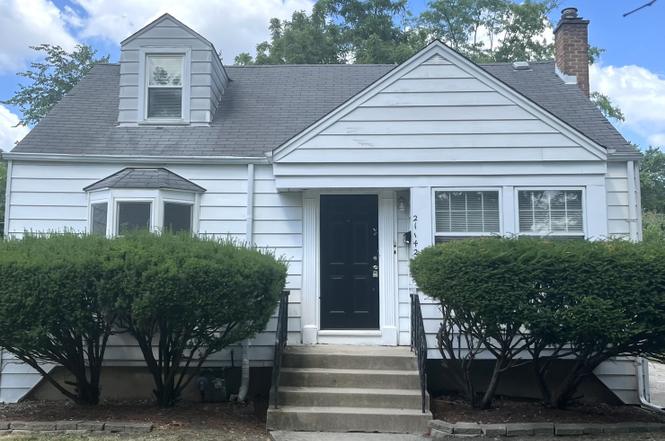
21142 Locust St · Matteson, IL
Flood risk 1/10 · Minimal
- FEMA flood zone
- X (unshaded)
- Chance of flooding over 30 yrs
- 0.0%
- Est. flood insurance / yr
- $507 – $1,088
Fire risk 1/10 · Minimal
- Est. fire insurance / yr
- $804 – $1,492
Heat risk 3/10 · Minor
- Hot days now (above 101°F)
- 7 days/yr
- Hot days in 30 yrs
- 16 days/yr
Wind risk 2/10 · Minimal
- Chance of severe wind over 30 yrs
- —
Air-quality risk 2/10 · Minimal
- Unhealthy air days now
- 1 days/yr
- Unhealthy air days in 30 yrs
- 1 days/yr
Risk factors via First Street. Map © Google.
Why this score? — see what drove the C grade
The composite is a weighted blend of 9 inputs, each scored 0–100. Each bar is that input's sub-score; the figure is the points it added to the 100-point composite (weight × sub-score).
- Cash flow +19.0/30.0
- ARV discount +15.0/15.0
- 1% rule +7.7/10.0
- DSCR +6.0/10.0
- Livability +3.4/5.0
- Rent growth +2.5/5.0
- Condition / age +2.5/5.0
- Schools +0.9/10.0
- Appreciation +0.0/10.0
$161,000
🖨 Deal sheet 📄 Offer letter ✓ Due diligence
Listing remarks
Welcome to this inviting 3-bedroom, 2-bathroom single-family home, thoughtfully laid out for comfort and convenience. Upstairs, you'll find two spacious bedrooms with plush carpeting and a full bathroom - perfect for creating a private retreat for guests. On the main level, enjoy an additional bedroom and full bathroom, offering flexible space for a home office, extra bedroom, or main-level living. The spacious kitchen is bright and functional, featuring crisp white cabinetry, sleek black appliances, and plenty of room for cooking and gathering. This warm, welcoming home is ready for you to move in and make it your own - don't miss your chance to see it today!
Key facts
- 5,625 sq ft lot
- 2 garage spots
- Built 1950
Property features AI
Finance
- Other: Possession at closing; Earnest money held by listing brokerage; Property located in Matteson, Rich township
- HOA & community: No master association fee required
Exterior
- Parking: Detached garage owned (asphalt), 2 garage spaces, 2 total parking spaces
- Utilities: Public water; Public sewer
- Home design: Detached single-family home; Two-story layout; Fee simple ownership; Built prior to 1978 (age ~71–80 years)
- Construction: Frame construction
- Exterior features: Lot dimensions approximately 45 x 125; Lot under 0.25 acre
Interior
- Kitchen: Kitchen on main level (approx. 11 x 11)
- Bedrooms: Three bedrooms total; Master bedroom on second floor (approx. 12 x 11); Second-floor bedroom (approx. 10 x 10); Main-level bedroom (approx. 10 x 10)
- Bathrooms: Two full bathrooms
- Heating & cooling: Natural gas forced-air heating; Central air conditioning
- Interior features: Six total rooms; Partially finished full basement; Dining area combined with living room; Some photos virtually staged
- Laundry & utility: Laundry room
Neighborhood map
What this means for you Summary
Snapshot
- This is a 3-bed/1.5-bath single-family listed at $161k.
Deal economics
- At list price, monthly cash flow is $169 ($2k/yr) — positive.
- The deal already cash-flows at list — no discount required.
- Meets the 1% rule at list price ($2k rent vs $161k).
- Recommended offer: $147k (9.0% below list) — sets the bar for market timing.
- Cap rate 7.6% vs local median 6.2% in Matteson — meaningfully above typical; check what's discounted (condition, days-on-market, listing class) to confirm the premium yield is real.
Location & tenants
- Location reads 67/100 on livability (#525 in IL) — a middle-class / working-renter tenant base. Strengths: employment A+, housing A+, cost of living A; Watch: schools D+, amenities F, commute F.
- Rich Twp Hsd 227 (suburban): math 5% / reading 12% proficiency, ranked #577 of 620 in IL (top 93%) — low school quality limits family demand, transient renter base, plan for 1-2y turnover.
- Market conditions: 69 active listings in the ZIP; 9 comparable units currently listed for rent nearby; rentals at typical pace (median 20d on market — plan ~3-4 weeks tenant-placement turnaround); 6,272 units permitted in Cook County in 2024 (4,658 in 5+ unit buildings).
Forward outlook
- Local home prices are declining (-3.0%/yr); year-one equity from $1k of loan paydown is wiped out by about $5k of value loss. Plan a longer hold.
Negotiation context
- It's been on market 95 days — a 9% lower offer ($147k) is reasonable based on typical stale-listing flexibility.
- 6 sale attempts since 2y ago with the ask held roughly flat each time — persistent listings suggest the price (not the market) is what's stuck; bring a comps-based counter.
- Current owner paid $94k; list at $161k implies a 70% gain — meaningful room to come down on a strong offer.
Risks & watch-outs
- Watch-outs: property tax is 4.0% of price; built in 1950 — expect roof / HVAC / electrical / plumbing capex.
Questions for the listing agent
- It's been on market 95 days. Have you received any prior offers? Is the seller open to a 9% concession, seller financing, or rate buy-down credit?
- Built in 1950 — when were the roof, HVAC, electrical panel, plumbing, and water heater last replaced?
- Property tax is high relative to price — has the assessment been appealed recently, and will the sale trigger a re-assessment?
- Why hasn't it sold? Are there any deal-killer items the seller is aware of (foundation, flood, title, zoning, code violations)?
- Is there a deadline driving the sale (1031 exchange, divorce, estate, relocation)? That informs how much negotiation room exists.
- Schools are D-rated, which usually means shorter tenancies and higher turnover. Who's the typical renter profile here, and what's been the actual vacancy rate?
- What's the average days-on-market for RENTAL listings here right now (not sales)? A rising rental-DOM trend means longer vacancies and softer asking-rent achievability than the comps imply.
- What's the recent tenant-quality profile in this submarket — average credit score on applications, eviction rate, late-payment / NSF rate, and stable-employment percentage? A property-management company in the area should have these aggregated.
- How much new for-sale + rental construction is in the pipeline within 1–3 miles? Heavy new supply typically softens prices + rents 12–24 months out; constrained supply supports both.
Investment metrics
- 1% rule
- 1.27% ✓
- Cap rate
- 7.56%
- Cash-on-cash
- 4.51%
- DSCR
- 1.20
- GRM
- 6.6
CMA / ARV
- ARV (on-the-fly)
- $214,650
- Comps found
- 12
Show comp detail 12 sales within ~0.75 mi
| Address | Dist | Beds/Ba | Sqft | Sold | Price | $/sf | Match |
|---|---|---|---|---|---|---|---|
| 3718 211th Pl | 0.09mi | 3/1.5 | 1,360 (+1%) | 6mo | $135,000 | $99 | 90 |
| 3719 211th Pl | 0.08mi | 4/2.0 (+1) | 1,440 (+7%) | 2mo | $236,000 | $164 | 76 |
| 519 Chase St | 0.41mi | 4/2.0 (+1) | 1,342 (-1%) | 3mo | $219,000 | $163 | 70 |
| 21220 Tower Ave | 0.25mi | 3/1.0 | 1,210 (-10%) | 2mo | $205,000 | $169 | 68 |
| 3844 214th Pl | 0.45mi | 3/1.0 | 1,424 (+6%) | 4mo | $180,000 | $126 | 65 |
| 21209 Oak St | 0.17mi | 4/2.0 (+1) | 1,500 (+11%) | 6mo | $182,500 | $122 | 62 |
| 549 Homan Ave | 0.39mi | 3/1.5 | 1,200 (-11%) | 6mo | $195,000 | $163 | 58 |
| 3762 216th Pl | 0.57mi | 3/2.0 | 1,263 (-6%) | 7mo | $144,000 | $114 | 55 |
| 3809 215th St | 0.50mi | 3/2.0 | 1,500 (+11%) | 3mo | $239,000 | $159 | 54 |
| 305 Jackson St | 0.50mi | 3/2.0 | 1,218 (-10%) | 7mo | $105,000 | $86 | 52 |
| 4022 Richmond Ct | 0.73mi | 3/1.5 | 1,237 (-8%) | 1mo | $115,000 | $93 | 51 |
| 4108 Applewood Ln | 0.69mi | 4/2.5 (+1) | 1,264 (-6%) | 6mo | $295,000 | $233 | 43 |
Match score weights: distance 35% · size 25% · config 20% · recency 20%. Top-matched comps best support the ARV.
Projected returns pro-forma
-3.0% appreciation · 3.0% rent growth · sell at horizon
- IRR
- -9.1%
- Equity multiple
- 0.67×
- Total profit
- $-15,065
- Equity at exit
- $24,006
- IRR
- 0.5%
- Equity multiple
- 1.04×
- Total profit
- $1,725
- Equity at exit
- $13,920
Cash invested: $45,080 (down + closing). Projections, not guarantees.
Landlord ↔ Tenant lean methodology
- Overall (STATE)
- 43 Moderately Tenant-Leaning
- State Illinois
- 43 Moderately Tenant-Leaning · D+7
- County
- — inherits STATE
- City
- — inherits STATE
ZIP-level market 60443
- Home prices YoY
- -32.6%
- Active inventory
- 69
- Price-to-rent
- 6.6×
Monthly cashflow live
- Estimated rent
- $2,040 high interval (Pro) →
- Mortgage (P&I)
- −$844
- Tax from tax record
- −$531 /mo · $6,367/yr
- Insurance
- −$67
- HOA
- −$0
- Vacancy / Maint / Mgmt
- −$428
- Net cashflow
- $169
Break-even live
UW: 25.0% down · 7.5% · 30yr · 1.5% tax · 5.0% vac · 8.0% maint · 8.0% mgmt
Financing live
Cash to close
- Down payment
- $40,250
- Closing costs
- $4,830
- Reserves months
- —
- Total cash needed
- —
Loan-product check · same deal, 3 products live
Conventional
25% down · 7.5% · 30yr
- Down + closing
- —
- Monthly P&I
- —
- Monthly cashflow
- —
- DSCR
- —
- Eligible?
- —
Personal DTI + credit; lowest rate.
DSCR
20% down · 8.5% · 30yr
- Down + closing
- —
- Monthly P&I
- —
- Monthly cashflow
- —
- DSCR
- —
- Eligible?
- —
No personal income docs; deal must DSCR.
Hard money
10% down · 12.0% · 12mo
- Down + closing
- —
- Monthly P&I
- —
- Monthly cashflow
- —
- DSCR
- —
- Eligible?
- —
Short-term bridge; refi at stabilization.
Rent comps 9 comps
| Address | Beds | Baths | Sqft | Rent | $/sqft | DOM | Units | Dist |
|---|---|---|---|---|---|---|---|---|
| 3538 212th Pl Matteson, IL | 3.0 | 1.0 | 1209 | $2,000 | $1.65 | 24d | 1 | 0.16mi |
| 3838 216th Pl Matteson, IL | 2.0 | 2.0 | 1160 | $1,996 | $1.72 | 20d | 1 | 0.62mi |
| 4014 Euclid Ln Richton Park, IL | 3.0 | 1.0 | 1100 | $2,100 | $1.91 | 13d | 1 | 1.06mi |
| 4014 Euclid Ln Richton Park, IL | 2.0 | 1.0 | 1100 | $2,100 | $1.91 | 22d | 1 | 1.06mi |
| 4014 Euclid Ln Richton Park, IL | 2.0 | 1.0 | 1100 | $2,100 | $1.91 | 7d | 1 | 1.06mi |
| 400 Watseka St Park Forest, IL | 4.0 | 2.0 | 1161 | $2,161 | $1.86 | 16d | 1 | 1.13mi |
| 3905 Tower Dr Richton Park, IL | 1.0–2.0 | 1.0–2.0 | 905 | $1,795 | $1.98 | 1d | 19 | 1.29mi |
| 22015 E Churchill Dr Richton Park, IL | 4.0 | 2.0 | 1200 | $2,300 | $1.92 | 24d | 1 | 1.43mi |
| 4200 Arlington Dr Richton Park, IL | 3.0 | 2.0 | 1595 | $2,061 | $1.29 | 20d | 1 | 1.50mi |
Listing history 30 events
-
2026-06-07statusdays on market $161,000 Pending 95 DOM
-
2026-06-04days on market $161,000 Active 94 DOM
-
2026-06-03days on market $161,000 Active 93 DOM
-
2026-06-02days on market $161,000 Active 92 DOM
-
2026-06-01days on market $161,000 Active 91 DOM
-
2026-05-31days on market $161,000 Active 90 DOM
-
2026-05-15status Active
-
2026-05-15price $161,000
-
2026-04-07status Pending
-
2026-03-20price $163,000
-
2026-02-20price $165,000
-
2026-01-23$168,000 Active
-
2026-01-23historical
-
2026-01-09price
-
2025-12-05price
-
2025-10-24Active
-
2025-10-24historical
-
2025-10-17price
-
2025-09-26price
-
2025-09-12price
-
2025-09-05price
-
2025-08-30price
-
2025-07-25price
-
2025-07-10Active
-
2024-07-12historical $1,725
-
2024-07-11historical $1,725
-
2024-07-09$1,725
-
2024-07-09$1,725
-
1995-07-31soldstatus $94,500
-
1976-10-07soldstatus $40,000
ⓘ Source: listings_history table (triggers on properties + properties_extension) + one-shot
backfill from property_details.listing_events for pre-trigger history.
Tax reassessment forecast IL · Partial reset (capped growth)
- Current annual tax
- $6,367 · $531/mo
- Projected year-2 tax
- $6,367 · $531/mo
- Expected delta
- $0/yr ($0/mo · 0.0%)
ⓘ Screening estimate from a state-policy table — verify with the county assessor before closing.
Climate risk First Street
- Flood 1/10 Low FEMA zone X (unshaded) · 0% chance over 30 yrs
- Wildfire 1/10 Low
- Heat 3/10 Moderate 7 d/yr ≥101°F today · 16 d/yr by 30 yrs out
- Wind 2/10 Low
- Air quality 2/10 Low 1 unhealthy d/yr today · 1 by 30 yrs out
Nearby sold comps map
Loading sold comps map…
Walkable amenities ~0.75 mi
Loading nearby amenities…
Taxation est. · year 1
- Rental income
- $24,477
- − Mortgage interest
- −$9,019
- − Property taxes
- −$6,367
- − Insurance
- −$805
- − Repairs & maintenance
- −$1,958
- − Management
- −$1,958
- − Depreciation
- −$4,684
- Taxable loss
- −$313
- Est. tax savings @ 24.0%
- +$75
- After-tax cash flow
- $2,108/yr
For passive investors: Depreciation is non-cash, so a rental often shows a tax loss while cash-flowing — sheltering income. Rental losses are passive: they offset passive income freely, and up to $25,000/yr can offset ordinary (W-2) income if you actively participate and your MAGI is under $100k (phasing out to $0 by $150k); unused losses carry forward. On sale, claimed depreciation is recaptured at up to 25%, and gains may owe capital-gains tax (a 1031 exchange can defer both). Figures are a year-1 estimate at your 24.0% rate — not tax advice; consult a CPA.
Schools (NCES district)
- District
- Rich Twp Hsd 227
- NCES district ID
- 1733420
- Math proficiency
- 5% ▼ -3.00%
- Reading proficiency
- 12% ▬ 0.00%
- Median HH income
- $56,056
- Composite
- 8.93/100
- National rank
- #9885
- State rank
- #577 of 620 in IL
Livability — Matteson
- Score
- 67/100
- State rank
- #525
- US rank
- #10883
Category grades
Schools grade is shown separately in the Schools card above.
Census & demographics
- Census place
- Matteson, IL
- City population
- 20,606
- Population (ZIP)
- 20,606
Population outlook (Cook County) Hauer SSP2
- Today (2025)
- 5,347,519 people
- By 2030
- 5,357,703 · +0.2%
- By 2040
- 5,324,924 · -0.4%
- By 2050
- 5,230,762 · -2.2%
- By 2075
- 4,785,735 · -10.5%
- By 2100
- 4,188,836 · -21.7%
Race, ethnicity, and origin ACS 2023
- Neighborhood character
- Predominantly Black (72%)
- Race & ethnicity
- Black 72% White 18% Two or more races 6% Hispanic / Latino 5% Asian 1%
- Hispanic origin (detail)
- Mexican 4%
- Common ancestry
- Romanian 2%
- Foreign-born
- 4% · Canada
- Languages at home
- 94% English-only · Spanish 4%
Political lean MEDSL · Cook
- 2024 margin
- Solid D (+42.0) · D 70.4% · R 28.4% · Other 1.2%
- 2008→2024 swing
- -11.4pp toward R · 2008: 53.4pp · 2024: 42.0pp
- All cycles
- 2024: D+42.0 2020: D+50.3 2016: D+53.0 2012: D+49.4 2008: D+53.4
Not yet ingested
- Civics
- —
Market trends
- HPI YoY
- ▼ -89.68%
- Current HPI
- 185.4404
- Rent YoY
- —
- Metro
- —
- State GDP YoY
- ▲ 1.59%
- F500 in state
- 60
Industry mix (Fortune 500 HQ in IL)
| Industry | F500 HQs | Revenue |
|---|---|---|
| Insurance | 4 | $201B |
|
||
| Consumer Goods | 4 | $87B |
|
||
| Industrial Machinery | 3 | $64B |
|
||
| Healthcare | 2 | $55B |
|
||
| Retail / Pharmacy | 1 | $148B |
|
||
| Agriculture / Food | 1 | $86B |
|
||
Price history
+302.5% since first listed24 events — show timeline
- 2026-05-15 Relisted — MRED as Distributed by MLS Grid
- 2026-05-15 Price Changed $161,000 MRED as Distributed by MLS Grid
- 2026-04-07 Pending — MRED as Distributed by MLS Grid
- 2026-03-20 Price Changed $163,000 MRED as Distributed by MLS Grid
- 2026-02-20 Price Changed $165,000 MRED as Distributed by MLS Grid
- 2026-01-23 Listing Removed — MRED as Distributed by MLS Grid
- 2026-01-23 Listed $168,000 MRED as Distributed by MLS Grid
- 2026-01-09 Price Changed — MRED as Distributed by MLS Grid
- 2025-12-05 Price Changed — MRED as Distributed by MLS Grid
- 2025-10-24 Listing Removed — MRED as Distributed by MLS Grid
- 2025-10-24 Listed — MRED as Distributed by MLS Grid
- 2025-10-17 Price Changed — MRED as Distributed by MLS Grid
- 2025-09-26 Price Changed — MRED as Distributed by MLS Grid
- 2025-09-12 Price Changed — MRED as Distributed by MLS Grid
- 2025-09-05 Price Changed — MRED as Distributed by MLS Grid
- 2025-08-30 Price Changed — MRED as Distributed by MLS Grid
- 2025-07-25 Price Changed — MRED as Distributed by MLS Grid
- 2025-07-10 Listed — MRED as Distributed by MLS Grid
- 2024-07-12 Rental Removed $1,725 RENTLY
- 2024-07-11 Rental Removed $1,725 RENT.
- 2024-07-09 Listed for Rent $1,725 RENTLY
- 2024-07-09 Listed for Rent $1,725 RENT.
- 1995-07-31 Sold (Public Records) $94,500 Public Records
- 1976-10-07 Sold (Public Records) $40,000 Public Records
Property tax history
+4.8%/yrLatest (2023): $6,367 · +50.9% YoY. Source: county tax records.
Cash-flow waterfall
monthlySold comps — $/sqft
last 12 mo · ≤1 miLoading sold comps…