 Multi-family
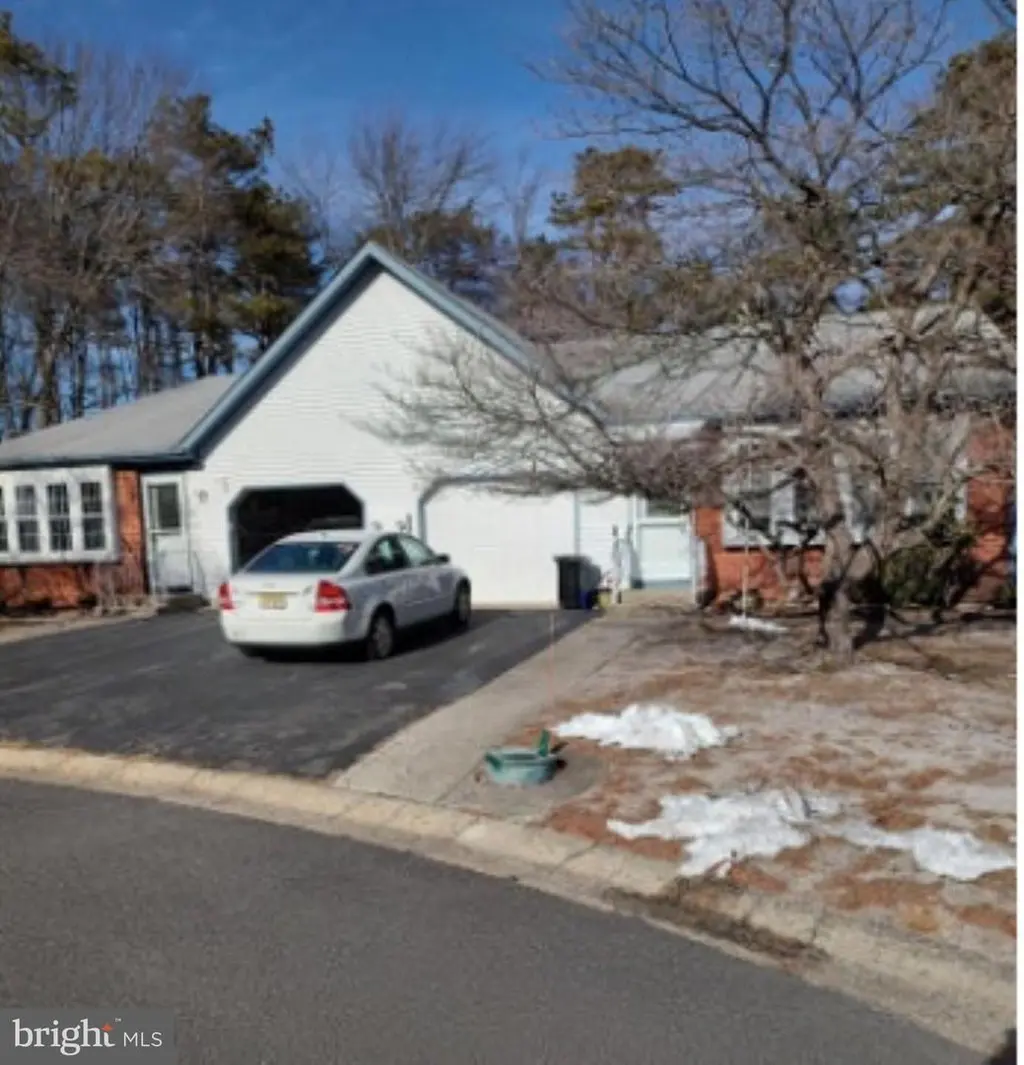
4B Easton Ct · Crestwood Village, NJ
Flood risk 1/10 · Minimal
- FEMA flood zone
- X (unshaded)
- Chance of flooding over 30 yrs
- 0.0%
- Est. flood insurance / yr
- $507 – $1,088
Fire risk 5/10 · Moderate
- Est. fire insurance / yr
- $526 – $976
Heat risk 6/10 · Moderate
- Hot days now (above 103°F)
- 7 days/yr
- Hot days in 30 yrs
- 14 days/yr
Wind risk 6/10 · Moderate
- Chance of severe wind over 30 yrs
- 64.0%
Air-quality risk 3/10 · Minor
- Unhealthy air days now
- 3 days/yr
- Unhealthy air days in 30 yrs
- 4 days/yr
Risk factors via First Street. Map © Google.
Why this score? — see what drove the B- grade
The composite is a weighted blend of 9 inputs, each scored 0–100. Each bar is that input's sub-score; the figure is the points it added to the 100-point composite (weight × sub-score).
- Cash flow +30.0/30.0
- 1% rule +10.0/10.0
- DSCR +10.0/10.0
- ARV discount +7.5/15.0
- Livability +3.2/5.0
- Schools +2.9/10.0
- Rent growth +2.5/5.0
- Condition / age +2.2/5.0
- Appreciation +0.0/10.0
$189,900
🖨 Deal sheet (PDF) 📄 Offer letter ✓ Due diligence
Multi-family units
County records classify this as Multi-Family (2-4 Unit). Listing-text estimate: 1 unit. estimate disagrees with records
Listing remarks
Don't miss this large Lynnewood model in the sought after Crestwood 5. Needs some TLC and decluttering but this will be a great place to call home. Spacious living room and dining room, eat in kitchen, 2 ample sized bedrooms and 2 full baths. Harry Wright lake park 5 min away offers swimming, free concerts and beautiful trails. Atlantic City less than 1 hour away; local beaches 20 min. Great place to retire. Don't miss this great opportunity to make this your own. 55+ community. Additional Notes House will be sold as is.
Key facts
- Lynnewood model
- Local beaches
- 1,544 sq ft lot
Tags
Property features AI
Exterior
- Parking: Attached front-entry garage with 1 space
- Utilities: Public sewer; Electric heating and hot water; Electric cooling; Cable TV available
- Home design: Fee simple ownership; Single building with multiple units; Estimated year built
- Construction: Block, concrete, and aluminum siding construction; Asphalt shingle roof
- Exterior features: Located on a cul-de-sac; Above-grade other structures
Interior
- Kitchen: Dishwasher; Self-cleaning oven; Electric range/oven
- Bedrooms: Two 2-bedroom units (multi-unit configuration)
- Flooring: Carpet
- Heating & cooling: Central heating (electric); Central air conditioning; Ceiling fans
- Interior features: Combination kitchen/dining area; Eat-in kitchen
Neighborhood map
What this means for you Summary
Snapshot
- This is a 4-bed/?-bath multifamily listed at $190k. Condition is rated fair.
Deal economics
- At list price, monthly cash flow is $2k ($21k/yr) — positive.
- The deal already cash-flows at list — no discount required.
- Meets the 1% rule at list price ($4k rent vs $190k).
- Recommended offer: $184k (3.0% below list) — sets the bar for market timing.
- Cap rate 17.6% vs local median 5.5% in Crestwood Village — top-decile yield for the area; either an underpriced asset or a hidden risk that comps aren't pricing in. Stress-test before assuming the spread holds.
Location & tenants
- Location reads 63/100 on livability (#422 in NJ) — a middle-class / working-renter tenant base. Strengths: cost of living A, housing A, health & safety B+; Watch: amenities F, commute F, employment F.
- Manchester Township School District (suburban): math 25% / reading 44% proficiency, ranked #320 of 472 in NJ (top 68%) — families likely to look elsewhere, expect single-tenant / working-renter base with shorter leases.
- Zoned schools: Whiting Elementary School (math 22% / reading 47%, grade F, #582 of 1,303 statewide, top 49%, 301 students, 25% FRL); Manchester Township Middle School (math 28% / reading 45%, grade F, #226 of 431 statewide, top 55%, 582 students, 41% FRL); Manchester Township High School (math 21% / reading 38%, grade F, #290 of 399 statewide, top 74%, 959 students, 38% FRL).
- Market conditions: 658 active listings in the ZIP; 4,434 units permitted in Ocean County in 2024 (868 in 5+ unit buildings).
Forward outlook
- Local home prices are declining (-3.0%/yr); year-one equity from $1k of loan paydown is wiped out by about $6k of value loss. Plan a longer hold.
- Ocean County population projected to shrink 8% by 2050 — rents likely to lag national; underwrite the cash flow, not the appreciation.
- At projected returns (-3.0% appreciation + 3.0% rent growth), your $53k cash investment doubles in ~3 years — after that, you're playing with house money.
Negotiation context
- It's been on market 58 days — a 3% lower offer ($184k) is reasonable based on typical stale-listing flexibility.
Risks & watch-outs
- Climate carrying-cost: major wind risk, 64% chance of damaging wind over 30y; moderate wildfire risk; extreme-heat days projected 7→14/yr by 2055 (HVAC capex compounding) — expect insurance premiums to compound above CPI over the hold.
Questions for the listing agent
- It's been on market 58 days. Have you received any prior offers? Is the seller open to a 3% concession, seller financing, or rate buy-down credit?
- Have any recent inspections been done? Can we get a copy of the seller's disclosures and any deferred-maintenance estimates?
- Built in 1979 — when were the roof, HVAC, electrical panel, plumbing, and water heater last replaced?
- Is there a deadline driving the sale (1031 exchange, divorce, estate, relocation)? That informs how much negotiation room exists.
- Schools are F-rated, which usually means shorter tenancies and higher turnover. Who's the typical renter profile here, and what's been the actual vacancy rate?
- What's the average days-on-market for RENTAL listings here right now (not sales)? A rising rental-DOM trend means longer vacancies and softer asking-rent achievability than the comps imply.
- What's the recent tenant-quality profile in this submarket — average credit score on applications, eviction rate, late-payment / NSF rate, and stable-employment percentage? A property-management company in the area should have these aggregated.
- How much new apartment / multifamily construction is in the pipeline within 1–3 miles? Heavy new supply (>2% of stock underway) typically softens rents 12–24 months out; light construction supports rent growth.
Investment metrics
- 1% rule
- 2.07% ✓
- Cap rate
- 17.61%
- Cash-on-cash
- 40.41%
- DSCR
- 2.80
- GRM
- 4.0
CMA / ARV
No comps found within radius.
Projected returns pro-forma
-3.0% appreciation · 3.0% rent growth · sell at horizon
- IRR
- 36.9%
- Equity multiple
- 2.57×
- Total profit
- $83,342
- Equity at exit
- $28,315
- IRR
- 43.5%
- Equity multiple
- 5.13×
- Total profit
- $219,677
- Equity at exit
- $16,419
Cash invested: $53,172 (down + closing). Projections, not guarantees.
Landlord ↔ Tenant lean methodology
- Overall (STATE)
- 21 Tenant-Leaning
- State New Jersey
- 21 Tenant-Leaning · D+6
- County
- — inherits STATE
- City
- — inherits STATE
ZIP-level market 08759
- Active inventory
- 658
- Price-to-rent
- 8.1×
Monthly cashflow live
- Estimated rent
- $3,928 medium interval (Pro) →
- Mortgage (P&I)
- −$996
- Tax est. 1.5%
- −$237 /mo · $2,848/yr
- Insurance
- −$79
- HOA
- −$0
- Vacancy / Maint / Mgmt
- −$825
- Net cashflow
- $1,791
Break-even live
Sensitivity live
| Price | -10% $1,922 | -5% $1,856 | +0% $1,791 | +5% $1,725 | +10% $1,660 |
|---|---|---|---|---|---|
| Rent | -10% $1,480 | -5% $1,636 | +0% $1,791 | +5% $1,946 | +10% $2,101 |
| Rate | -1.0pp $1,886 | -0.5pp $1,839 | base $1,791 | +0.5pp $1,742 | +1.0pp $1,691 |
2-unit breakdown (identical units grouped — click to expand)
| Units | Beds | Baths | Est. rent |
|---|---|---|---|
| 2× units | 2 | 1 | $3,928 |
| #1 | 2 | 1 | $1,964 |
| #2 | 2 | 1 | $1,964 |
| Total (2 units) | $3,928 | ||
UW: 25.0% down · 7.5% · 30yr · 1.5% tax · 5.0% vac · 8.0% maint · 8.0% mgmt
Financing live
Cash to close
- Down payment
- $47,475
- Closing costs
- $5,697
- Reserves months
- —
- Total cash needed
- —
Loan-product check · same deal, 3 products live
Conventional
25% down · 7.5% · 30yr
- Down + closing
- —
- Monthly P&I
- —
- Monthly cashflow
- —
- DSCR
- —
- Eligible?
- —
Personal DTI + credit; lowest rate.
DSCR
20% down · 8.5% · 30yr
- Down + closing
- —
- Monthly P&I
- —
- Monthly cashflow
- —
- DSCR
- —
- Eligible?
- —
No personal income docs; deal must DSCR.
Hard money
10% down · 12.0% · 12mo
- Down + closing
- —
- Monthly P&I
- —
- Monthly cashflow
- —
- DSCR
- —
- Eligible?
- —
Short-term bridge; refi at stabilization.
Listing history 15 events
-
2026-06-21days on market $189,900 Active 58 DOM
-
2026-06-18days on market $189,900 Active 55 DOM
-
2026-06-17days on market $189,900 Active 54 DOM
-
2026-06-16days on market $189,900 Active 53 DOM
-
2026-06-15days on market $189,900 Active 52 DOM
-
2026-06-13days on market $189,900 Active 50 DOM
-
2026-06-09days on market $189,900 Active 46 DOM
-
2026-06-08days on market $189,900 Active 45 DOM
-
2026-06-07days on market $189,900 Active 44 DOM
-
2026-06-04days on market $189,900 Active 41 DOM
-
2026-06-03days on market $189,900 Active 40 DOM
-
2026-06-02days on market $189,900 Active 39 DOM
-
2026-06-01days on market $189,900 Active 38 DOM
-
2026-05-31days on market $189,900 Active 37 DOM
-
2026-04-24$189,900 Active 526-char remark
ⓘ Source: listings_history table (triggers on properties + properties_extension) + one-shot
backfill from property_details.listing_events for pre-trigger history.
Climate risk First Street
- Flood 1/10 Low FEMA zone X (unshaded) · 0% chance over 30 yrs
- Wildfire 5/10 Major
- Heat 6/10 Major 7 d/yr ≥103°F today · 14 d/yr by 30 yrs out
- Wind 6/10 Major 64% chance of damaging wind over 30 yrs
- Air quality 3/10 Moderate 3 unhealthy d/yr today · 4 by 30 yrs out
Nearby sold comps map
Loading sold comps map…
Walkable amenities ~0.75 mi
Loading nearby amenities…
Taxation est. · year 1
- Rental income
- $47,136
- − Mortgage interest
- −$10,637
- − Property taxes
- −$2,848
- − Insurance
- −$950
- − Repairs & maintenance
- −$3,771
- − Management
- −$3,771
- − Depreciation
- −$5,524
- Taxable income
- $19,635
- Est. tax owed @ 24.0%
- −$4,712
- After-tax cash flow
- $16,777/yr
For passive investors: Depreciation is non-cash, so a rental often shows a tax loss while cash-flowing — sheltering income. Rental losses are passive: they offset passive income freely, and up to $25,000/yr can offset ordinary (W-2) income if you actively participate and your MAGI is under $100k (phasing out to $0 by $150k); unused losses carry forward. On sale, claimed depreciation is recaptured at up to 25%, and gains may owe capital-gains tax (a 1031 exchange can defer both). Figures are a year-1 estimate at your 24.0% rate — not tax advice; consult a CPA.
Condition & rehab AI · 5 photos
This property requires significant exterior and interior repairs, including landscaping, painting, and kitchen updates. With proper renovations, it has the potential to be a great investment.
Repairs flagged
- Major Overgrown vegetation — The independent image shows significant overgrowth, indicating a major repair is needed.
- Major Landscaping — The independent image shows a lack of landscaping, which needs to be addressed.
- Major Exterior painting — The independent image shows a poorly maintained exterior, indicating a major repair is needed.
- Minor Interior painting — The listing photo shows some wear and tear, but the condition is not severe enough to be classified as major.
Value-add opportunities
- Both Landscaping and planting — A well-maintained exterior and landscaping can significantly increase both resale and rental value.
- Both Interior painting — Fresh paint can make the interior look more inviting and increase both resale and rental value.
- Both Kitchen updates — Updating the kitchen with modern appliances and cabinetry can increase both resale and rental value.
- Both Bathroom updates — Updating bathrooms with modern fixtures and finishes can increase both resale and rental value.
Renovation cost estimate screening
| Repair item | Severity | Est. cost |
|---|---|---|
| Overgrown vegetation · The independent image shows significant overgrowth, indicating a major repair is needed. | Major | $15,000–50,000 |
| Landscaping · The independent image shows a lack of landscaping, which needs to be addressed. | Major | $15,000–50,000 |
| Exterior painting · The independent image shows a poorly maintained exterior, indicating a major repair is needed. | Major | $15,000–50,000 |
| Interior painting · The listing photo shows some wear and tear, but the condition is not severe enough to be classified as major. | Minor | $500–3,000 |
| Total estimated repair cost · 4 items | $45,500–153,000 |
Value-add ROI direction
- Both Landscaping and planting — A well-maintained exterior and landscaping can significantly increase both resale and rental value. ↑
- Both Interior painting — Fresh paint can make the interior look more inviting and increase both resale and rental value. ↑
- Both Kitchen updates — Updating the kitchen with modern appliances and cabinetry can increase both resale and rental value. ↑
- Both Bathroom updates — Updating bathrooms with modern fixtures and finishes can increase both resale and rental value. ↑
ⓘ Cost ranges are severity-bucket heuristics (US national rule-of-thumb). Get contractor quotes + a written scope before underwriting a rehab budget.
Schools (NCES district)
- District
- Manchester Township School District
- NCES district ID
- 3409450
- Math proficiency
- 25% ▼ -17.00%
- Reading proficiency
- 44% ▼ -5.00%
- Median HH income
- $38,905
- Composite
- 28.8/100
- National rank
- #6662
- State rank
- #320 of 472 in NJ
Livability — Crestwood Village
- Score
- 63/100
- State rank
- #422
- US rank
- #15006
Category grades
Schools grade is shown separately in the Schools card above.
Census & demographics
- Census place
- Crestwood Village, NJ
- City population
- 34,290
- Population (ZIP)
- 34,290
Population outlook (Ocean County) Hauer SSP2
- Today (2025)
- 586,991 people
- By 2030
- 581,403 · -1.0%
- By 2040
- 564,913 · -3.8%
- By 2050
- 538,149 · -8.3%
- By 2075
- 468,845 · -20.1%
- By 2100
- 350,297 · -40.3%
Race, ethnicity, and origin ACS 2023
- Neighborhood character
- Predominantly White (87%)
- Race & ethnicity
- White 87% Hispanic / Latino 5% Black 4% Two or more races 4% Asian 2%
- Hispanic origin (detail)
- Puerto Rican 2%
- Common ancestry
- Romanian 8% Scotch-Irish 2% Lithuanian 2%
- Foreign-born
- 11% · Canada, China
- Languages at home
- 88% English-only · Spanish 3% Russian/Polish/Slavic 2% Other Indo-European 2%
Political lean MEDSL · Ocean
- 2024 margin
- Solid R (+36.0) · D 31.4% · R 67.4% · Other 1.2%
- 2008→2024 swing
- -17.6pp toward R · 2008: -18.4pp · 2024: -36.0pp
- All cycles
- 2024: R+36.0 2020: R+28.7 2016: R+34.0 2012: R+17.7 2008: R+18.4
Not yet ingested
- Civics
- —
Market trends
- HPI YoY
- ▼ -347.85%
- Current HPI
- 274.4679
- Rent YoY
- —
- Metro
- —
- State GDP YoY
- ▲ 2.05%
- F500 in state
- 34
Industry mix (Fortune 500 HQ in NJ)
| Industry | F500 HQs | Revenue |
|---|---|---|
| Consumer Goods | 3 | $31B |
|
||
| Pharmaceuticals | 2 | $153B |
|
||
| Technology | 2 | $21B |
|
||
| Insurance | 2 | $20B |
|
||
| Healthcare | 2 | $19B |
|
||
| Financial Services | 1 | $70B |
|
||
Price history
1 event — show timeline
- 2026-04-24 Listed $189,900 BRIGHT MLS
Cash-flow waterfall
monthlySold comps — $/sqft
last 12 mo · ≤1 miLoading sold comps…