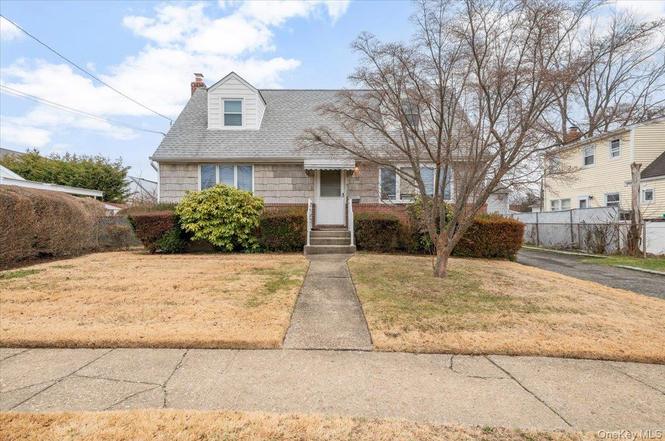
158 Burns Ave · Hicksville, NY
Flood risk 1/10 · Minimal
- FEMA flood zone
- X (unshaded)
- Chance of flooding over 30 yrs
- 0.0%
- Est. flood insurance / yr
- $473 – $860
Fire risk 1/10 · Minimal
- Est. fire insurance / yr
- $691 – $1,283
Heat risk 6/10 · Moderate
- Hot days now (above 98°F)
- 7 days/yr
- Hot days in 30 yrs
- 16 days/yr
Wind risk 6/10 · Moderate
- Chance of severe wind over 30 yrs
- 64.0%
Air-quality risk 4/10 · Minor
- Unhealthy air days now
- 5 days/yr
- Unhealthy air days in 30 yrs
- 7 days/yr
Risk factors via First Street. Map © Google.
Why this score? — see what drove the D+ grade
The composite is a weighted blend of 9 inputs, each scored 0–100. Each bar is that input's sub-score; the figure is the points it added to the 100-point composite (weight × sub-score).
- ARV discount +14.3/15.0
- Cash flow +11.9/30.0
- Schools +5.4/10.0
- Livability +4.2/5.0
- DSCR +3.5/10.0
- Rent growth +3.3/5.0
- 1% rule +2.8/10.0
- Condition / age +2.5/5.0
- Appreciation +0.0/10.0
$599,000
🖨 Deal sheet (PDF) 📄 Offer letter ✓ Due diligence
Listing remarks
Endless potential awaits in this charming Cape-style home! This is a diamond in the rough. With a new heating system, updated roof, and hardwood floors throughout, the essentials are ready—just bring your vision to make it your own. The flexible layout offers in-law suite potential, while the spacious basement with its own outside entrance opens up possibilities for extra living space, a gym, or a workshop. Plus, the kitchen features convenient gas cooking. Don’t miss this fantastic opportunity to create the home of your dreams! Some phots were AI enhanced
Key facts
- Updated roof
- Outside entrance
- Spacious basement
Tags
Neighborhood map
What this means for you Summary
Snapshot
- This is a 4-bed/2.0-bath single-family listed at $599k.
Deal economics
- At list price, monthly cash flow is $-152 ($-2k/yr) — negative.
- To cash-flow at today's rent, offer at most $572k (4.5% below list).
- To meet the 1% rule (rent ≥ 1% of price), the offer needs to be $465k (22.4% below list).
- Recommended offer: $465k (22.4% below list) — sets the bar for 1% rule.
- Cap rate 6.0% vs local median 3.4% in Hicksville — top-decile yield for the area; either an underpriced asset or a hidden risk that comps aren't pricing in. Stress-test before assuming the spread holds.
Location & tenants
- Location reads 85/100 on livability (#31 in NY, #526 nationally) — a professional / high-income tenant draw. Strengths: amenities A+, commute A+, employment A+; Watch: cost of living F.
- Hicksville Union Free School District (suburban): math 55% / reading 62% proficiency, ranked #200 of 590 in NY (top 34%) — acceptable for families but not a draw, mixed tenant base, ~2y average lease.
- Zoned schools: Burns Avenue School (math 47% / reading 52%, grade D, #1,085 of 2,108 statewide, top 56%, 290 students, 49% FRL); Hicksville Middle School (math 39% / reading 61%, grade C, #261 of 729 statewide, top 36%, 1,185 students, 52% FRL); Hicksville High School (math 76% / reading 77%, grade A-, #612 of 1,100 statewide, top 56%, 1,852 students, 49% FRL) — zoned schools average 50% FRL vs 24% district-wide (26 pts higher); higher-poverty schools than district average — tighter screening recommended.
- Market conditions: Rents rising (+3.4%/yr); 189 active listings in the ZIP; 18 comparable units currently listed for rent nearby; rentals leasing fast (median 0d on market — plan ~1-2 weeks tenant-placement turnaround); high-income renter base; 824 units permitted in Nassau County in 2024 (153 in 5+ unit buildings).
- This rent runs 38% of the median local income ($146k/yr) — at the standard rent-burdened threshold; future hikes will face affordability resistance.
Forward outlook
- Local home prices are declining (-3.0%/yr); year-one equity from $4k of loan paydown is wiped out by about $18k of value loss. Plan a longer hold.
- Nassau County population projected at +7% by 2050 — modest demand growth; plan on rents tracking national, not racing it.
Negotiation context
- Only 4 days on market — expect competitive offers; lowballing is unlikely to land.
- Current owner paid $188k; list at $599k implies a 218% gain — meaningful room to come down on a strong offer.
Risks & watch-outs
- Climate carrying-cost: major wind risk, 64% chance of damaging wind over 30y; extreme-heat days projected 7→16/yr by 2055 (HVAC capex compounding) — expect insurance premiums to compound above CPI over the hold.
Questions for the listing agent
- What do current leases actually rent for vs. the listed asking? Can we see a recent rent roll and the last 12 months of T-12 income?
- Built in 1960 — when were the roof, HVAC, electrical panel, plumbing, and water heater last replaced?
- Is there a deadline driving the sale (1031 exchange, divorce, estate, relocation)? That informs how much negotiation room exists.
- Schools are A-rated — typically a magnet for longer-tenancy family renters. What's the average tenant stay here, and is there a school-zone premium baked into asking?
- The area grade is low — what's the realistic commute time and amenity access for the typical tenant pool here? Any planned neighborhood developments (good or bad) we should know about?
- What's the average days-on-market for RENTAL listings here right now (not sales)? A rising rental-DOM trend means longer vacancies and softer asking-rent achievability than the comps imply.
- What's the recent tenant-quality profile in this submarket — average credit score on applications, eviction rate, late-payment / NSF rate, and stable-employment percentage? A property-management company in the area should have these aggregated.
- How much new for-sale + rental construction is in the pipeline within 1–3 miles? Heavy new supply typically softens prices + rents 12–24 months out; constrained supply supports both.
Investment metrics
- 1% rule
- 0.78% ✗
- Cap rate
- 5.99%
- Cash-on-cash
- -1.09%
- DSCR
- 0.95
- GRM
- 10.7
CMA / ARV
- ARV (on-the-fly)
- $705,024
- Comps found
- 10
Show comp detail 10 sales within ~0.75 mi
| Address | Dist | Beds/Ba | Sqft | Sold | Price | $/sf | Match |
|---|---|---|---|---|---|---|---|
| 158 Burns Ave | 0.00mi | 4/2.0 | 1,296 (0%) | 1mo | $680,000 | $525 | 99 |
| 70 Nevada St | 0.26mi | 4/2.0 | 1,274 (-2%) | 1mo | $810,000 | $636 | 84 |
| 99 Nevada St | 0.25mi | 4/3.0 | 1,258 (-3%) | 12mo | $768,000 | $610 | 70 |
| 7 Montana St | 0.25mi | 3/2.0 (-1) | 1,132 (-13%) | 4mo | $749,000 | $662 | 59 |
| 12 Schiller St | 0.65mi | 4/3.0 | 1,300 (+0%) | 10mo | $744,000 | $572 | 56 |
| 5 Milton St | 0.67mi | 4/3.0 | 1,373 (+6%) | 3mo | $615,000 | $448 | 52 |
| 87 Myers Ave | 0.34mi | 3/2.0 (-1) | 1,400 (+8%) | 17mo | $745,000 | $532 | 52 |
| 5 Willet Ave | 0.51mi | 5/2.0 (+1) | 1,326 (+2%) | 20mo | $717,000 | $541 | 50 |
| 49 Burns Ave | 0.47mi | 4/2.0 | 1,405 (+8%) | 21mo | $765,000 | $544 | 47 |
| 4 Franklin St | 0.65mi | 3/2.5 (-1) | 1,412 (+9%) | 10mo | $642,000 | $455 | 40 |
Match score weights: distance 35% · size 25% · config 20% · recency 20%. Top-matched comps best support the ARV.
Projected returns pro-forma
-3.0% appreciation · 3.38% rent growth · sell at horizon
- IRR
- -17.7%
- Equity multiple
- 0.37×
- Total profit
- $-105,082
- Equity at exit
- $89,313
- IRR
- -9.2%
- Equity multiple
- 0.42×
- Total profit
- $-97,097
- Equity at exit
- $51,791
Cash invested: $167,720 (down + closing). Projections, not guarantees.
Landlord ↔ Tenant lean methodology
- Overall (STATE)
- 15 Strongly Tenant-Friendly
- State New York
- 15 Strongly Tenant-Friendly · D+10
- County
- — inherits STATE
- City
- — inherits STATE
ZIP-level market 11801
- Rents YoY
- 3.4%
- Active inventory
- 189
- Price-to-rent
- 10.7×
Monthly cashflow live
- Estimated rent
- $4,646 high interval (Pro) →
- Mortgage (P&I)
- −$3,141
- Tax from tax record
- −$431 /mo · $5,177/yr
- Insurance
- −$250
- HOA
- −$0
- Vacancy / Maint / Mgmt
- −$976
- Net cashflow
- $-152
Break-even live
Sensitivity live
| Price | -10% $187 | -5% $18 | +0% $-152 | +5% $-321 | +10% $-491 |
|---|---|---|---|---|---|
| Rent | -10% $-519 | -5% $-335 | +0% $-152 | +5% $32 | +10% $215 |
| Rate | -1.0pp $150 | -0.5pp $0 | base $-152 | +0.5pp $-307 | +1.0pp $-465 |
UW: 25.0% down · 7.5% · 30yr · 1.5% tax · 5.0% vac · 8.0% maint · 8.0% mgmt
Financing live
Cash to close
- Down payment
- $149,750
- Closing costs
- $17,970
- Reserves months
- —
- Total cash needed
- —
Loan-product check · same deal, 3 products live
Conventional
25% down · 7.5% · 30yr
- Down + closing
- —
- Monthly P&I
- —
- Monthly cashflow
- —
- DSCR
- —
- Eligible?
- —
Personal DTI + credit; lowest rate.
DSCR
20% down · 8.5% · 30yr
- Down + closing
- —
- Monthly P&I
- —
- Monthly cashflow
- —
- DSCR
- —
- Eligible?
- —
No personal income docs; deal must DSCR.
Hard money
10% down · 12.0% · 12mo
- Down + closing
- —
- Monthly P&I
- —
- Monthly cashflow
- —
- DSCR
- —
- Eligible?
- —
Short-term bridge; refi at stabilization.
Rent comps 18 comps
| Address | Beds | Baths | Sqft | Rent | $/sqft | DOM | Units | Dist |
|---|---|---|---|---|---|---|---|---|
| 26 Parkside Dr Jericho, NY | 3.0 | 2.0 | 1264 | $4,900 | $3.88 | 0d | 1 | 0.50mi |
| 103 Wayne St Jericho, NY | 3.0 | 1.5 | 1562 | $4,800 | $3.07 | 0d | 1 | 0.57mi |
| 4 Willow Pl Hicksville, NY | 3.0 | 1.5 | 1264 | $4,500 | $3.56 | 0d | 1 | 0.80mi |
| 21 Twinlawns Ave Hicksville, NY | 3.0 | 1.0 | 973 | $3,500 | $3.60 | 45d | 1 | 1.07mi |
| 9 Harrison Ave Hicksville, NY | 3.0 | 2.0 | 1218 | $4,000 | $3.28 | 45d | 1 | 1.16mi |
| 100 Westwood Dr Westbury, NY | 1.0–3.0 | 1.5–2.0 | 865 | $4,665 | $5.39 | 0d | 1 | 1.17mi |
| 80 Westwood Dr Unit 205 Westbury, NY | 3.0 | 2.0 | 1015 | $4,545 | $4.48 | 18d | 1 | 1.21mi |
| 5 Manors Dr Jericho, NY | 3.0 | 2.5 | 1582 | $4,900 | $3.10 | 0d | 1 | 1.21mi |
| 115 Westwood Dr Unit 137 Westbury, NY | 3.0 | 2.0 | 1015 | $4,585 | $4.52 | 3d | 1 | 1.24mi |
| 40 Westwood Dr Unit 46 Westbury, NY | 3.0 | 2.0 | 1065 | $4,625 | $4.34 | 18d | 1 | 1.24mi |
| 105 Westwood Dr Unit 125 Westbury, NY | 3.0 | 2.0 | 1015 | $4,585 | $4.52 | 0d | 1 | 1.25mi |
| 10 Westwood Dr Unit 41 Westbury, NY | 3.0 | 2.0 | 1015 | $4,585 | $4.52 | 0d | 1 | 1.26mi |
| 75 Westwood Dr Unit 105 Westbury, NY | 3.0 | 2.0 | 1015 | $4,585 | $4.52 | 0d | 1 | 1.28mi |
| 65 Westwood Dr Unit 93 Westbury, NY | 3.0 | 2.0 | 1015 | $4,585 | $4.52 | 0d | 1 | 1.30mi |
| 35 Westwood Dr Unit 26 Westbury, NY | 3.0 | 2.0 | 1065 | $4,625 | $4.34 | 45d | 1 | 1.30mi |
| 7 Mindy Ln Westbury, NY | 4.0 | 2.0 | 1398 | $5,300 | $3.79 | 0d | 1 | 1.39mi |
| 11 Howard St Hicksville, NY | 5.0 | 2.0 | 1658 | $5,500 | $3.32 | 3d | 1 | 1.40mi |
| 33 Clarissa Dr Hicksville, NY | 4.0 | 2.0 | 1098 | $4,500 | $4.10 | 21d | 1 | 1.48mi |
Listing history 4 events
-
2026-04-07status Pending
-
2026-03-13$599,000 Active
-
1994-03-07soldstatus $188,500
-
1985-06-10soldstatus $130,000
ⓘ Source: listings_history table (triggers on properties + properties_extension) + one-shot
backfill from property_details.listing_events for pre-trigger history.
Tax reassessment forecast NY · Partial reset (capped growth)
- Current annual tax
- $5,177 · $431/mo
- Projected year-2 tax
- $7,650 · $638/mo
- Expected delta
- +$2,473/yr (+$206/mo · 47.8%)
ⓘ Screening estimate from a state-policy table — verify with the county assessor before closing.
Climate risk First Street
- Flood 1/10 Low FEMA zone X (unshaded) · 0% chance over 30 yrs
- Wildfire 1/10 Low
- Heat 6/10 Major 7 d/yr ≥98°F today · 16 d/yr by 30 yrs out
- Wind 6/10 Major 64% chance of damaging wind over 30 yrs
- Air quality 4/10 Moderate 5 unhealthy d/yr today · 7 by 30 yrs out
Nearby sold comps map
Loading sold comps map…
Walkable amenities ~0.75 mi
Loading nearby amenities…
Taxation est. · year 1
- Rental income
- $55,752
- − Mortgage interest
- −$33,553
- − Property taxes
- −$5,177
- − Insurance
- −$2,995
- − Repairs & maintenance
- −$4,460
- − Management
- −$4,460
- − Depreciation
- −$17,425
- Taxable loss
- −$12,320
- Est. tax savings @ 24.0%
- +$2,957
- After-tax cash flow
- $1,134/yr
For passive investors: Depreciation is non-cash, so a rental often shows a tax loss while cash-flowing — sheltering income. Rental losses are passive: they offset passive income freely, and up to $25,000/yr can offset ordinary (W-2) income if you actively participate and your MAGI is under $100k (phasing out to $0 by $150k); unused losses carry forward. On sale, claimed depreciation is recaptured at up to 25%, and gains may owe capital-gains tax (a 1031 exchange can defer both). Figures are a year-1 estimate at your 24.0% rate — not tax advice; consult a CPA.
Schools (NCES district)
- District
- Hicksville Union Free School District
- NCES district ID
- 3614340
- Math proficiency
- 55% ▼ -7.00%
- Reading proficiency
- 62% ▲ 2.00%
- Median HH income
- $91,592
- Composite
- 53.79/100
- National rank
- #1417
- State rank
- #200 of 590 in NY
Livability — Hicksville
- Score
- 85/100
- State rank
- #31
- US rank
- #526
Category grades
Schools grade is shown separately in the Schools card above.
Census & demographics
- Census place
- Hicksville, NY
- County
- Nassau County · 653,051 people
- City population
- 41,585
- Metro
- New York-Newark-Jersey City, NY-NJ-PA
- Population (ZIP)
- 41,585
- Household income
- $145,788
- Rent vs Own
- Severe rent burden
- 398.0
Population outlook (Nassau County) Hauer SSP2
- Today (2025)
- 1,409,302 people
- By 2030
- 1,431,482 · +1.6%
- By 2040
- 1,471,607 · +4.4%
- By 2050
- 1,502,845 · +6.6%
- By 2075
- 1,575,403 · +11.8%
- By 2100
- 1,554,356 · +10.3%
Race, ethnicity, and origin ACS 2023
- Neighborhood character
- Diverse neighborhood (Simpson 0.69)
- Race & ethnicity
- White 41% Asian 32% Hispanic / Latino 20% Two or more races 11% Black 2%
- Hispanic origin (detail)
- Mexican 2% Puerto Rican 4% Dominican 1%
- Common ancestry
- Romanian 3% Scotch-Irish 1% Lithuanian 1%
- Foreign-born
- 34% · Canada, China, Jamaica
- Languages at home
- 53% English-only · Other Indo-European 24% Spanish 14% Chinese 3%
Political lean MEDSL · Nassau
- 2024 margin
- Toss-up / Even · D 47.9% · R 52.1%
- 2008→2024 swing
- -12.6pp toward R · 2008: 8.4pp · 2024: -4.2pp
- All cycles
- 2024: R+4.2 2020: D+9.5 2016: D+5.3 2012: D+6.7 2008: D+8.4
Not yet ingested
- Civics
- —
Market trends
- HPI YoY
- ▼ -773.32%
- Current HPI
- 321.0586
- Rent YoY
- ▲ 3.38%
- Metro
- New York-Newark-Jersey City, NY-NJ-PA
- State GDP YoY
- ▲ 2.60%
- F500 in state
- 92
Industry mix (Fortune 500 HQ in NY)
| Industry | F500 HQs | Revenue |
|---|---|---|
| Financial Services | 10 | $950B |
|
||
| Consumer Goods | 9 | $162B |
|
||
| Insurance | 4 | $225B |
|
||
| Telecommunications | 2 | $144B |
|
||
| Pharmaceuticals | 2 | $112B |
|
||
| Media / Entertainment | 2 | $69B |
|
||
Price history
+360.8% since first listed4 events — show timeline
- 2026-04-07 Pending — OneKey® MLS as Distributed by MLS Grid
- 2026-03-13 Listed $599,000 OneKey® MLS as Distributed by MLS Grid
- 1994-03-07 Sold (Public Records) $188,500 Public Records
- 1985-06-10 Sold (Public Records) $130,000 Public Records
Property tax history
+1.5%/yrLatest (2024): $5,177 · +6.5% YoY. Source: county tax records.
Cash-flow waterfall
monthlySold comps — $/sqft
last 12 mo · ≤1 miLoading sold comps…