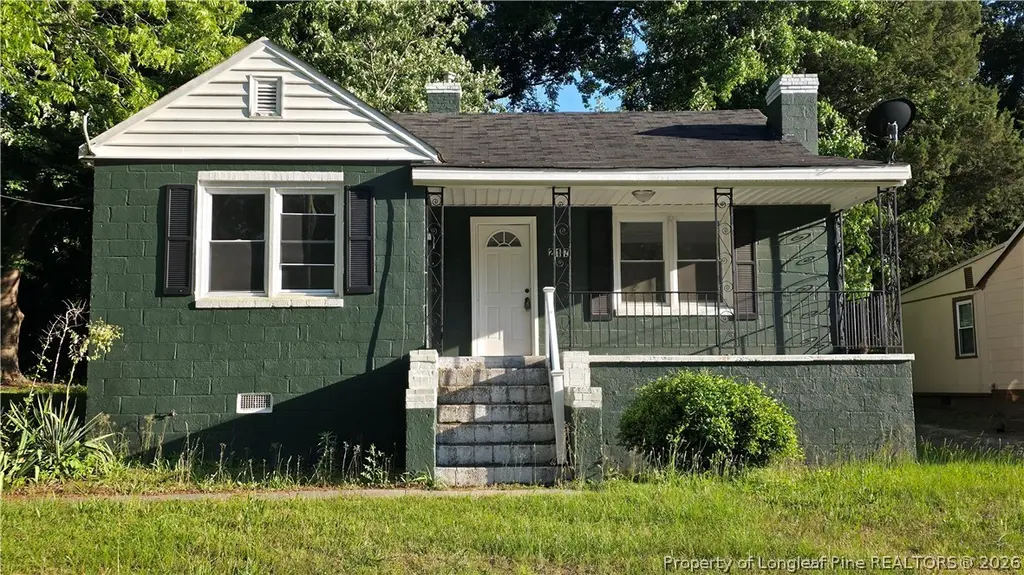
217 Sunset Ave · Fayetteville, NC
Flood risk 1/10 · Minimal
- FEMA flood zone
- X (unshaded)
- Chance of flooding over 30 yrs
- 0.0%
- Est. flood insurance / yr
- $507 – $1,088
Fire risk 3/10 · Minor
- Est. fire insurance / yr
- $906 – $1,684
Heat risk 7/10 · Major
- Hot days now (above 106°F)
- 7 days/yr
- Hot days in 30 yrs
- 16 days/yr
Wind risk 7/10 · Major
- Chance of severe wind over 30 yrs
- 78.0%
Air-quality risk 2/10 · Minimal
- Unhealthy air days now
- 0 days/yr
- Unhealthy air days in 30 yrs
- 1 days/yr
Risk factors via First Street. Map © Google.
Why this score? — see what drove the D+ grade
The composite is a weighted blend of 9 inputs, each scored 0–100. Each bar is that input's sub-score; the figure is the points it added to the 100-point composite (weight × sub-score).
- Cash flow +23.7/30.0
- DSCR +7.6/10.0
- 1% rule +5.9/10.0
- Livability +3.8/5.0
- Rent growth +3.4/5.0
- Schools +3.1/10.0
- Condition / age +2.5/5.0
- ARV discount +0.0/15.0
- Appreciation +0.0/10.0
$115,000
🖨 Deal sheet 📄 Offer letter ✓ Due diligence
Listing remarks
Come check out this cute 2 bedroom, 1 bath home. Home has been updated recently with LVP flooring throughout the home, newer cabinets and counter top, and recent interior paint. Could make a good rental property of first time home for a small family.
Key facts
- Newer cabinets
- Lvp flooring
- Counter top
Tags
Property features AI
Finance
- Other: Cleared, interior lot; Paved road access; Zoned SF6 (Single Family Residential)
Exterior
- Parking: No garage
- Utilities: Public water; Public sewer
- Home design: Single-family residence; Residential property
- Construction: Block construction; Vinyl siding
- Exterior features: Covered front porch
Interior
- Kitchen: Electric range; Range hood; Refrigerator
- Bedrooms: Total of 5 rooms (includes bedrooms and living spaces)
- Flooring: Vinyl flooring
- Bathrooms: 1 full bathroom
- Heating & cooling: Heat pump heating; Central electric air conditioning
- Interior features: Laminate countertops; Wood-burning fireplace
- Laundry & utility: Washer hookup in unit; Water heater
Neighborhood map
What this means for you Summary
Snapshot
- This is a 3-bed/1.0-bath single-family listed at $115k.
Deal economics
- At list price, monthly cash flow is $220 ($3k/yr) — positive.
- The deal already cash-flows at list — no discount required.
- Meets the 1% rule at list price ($1k rent vs $115k).
- Recommended offer: $112k (3.0% below list) — sets the bar for market timing.
- Cap rate 8.6% vs local median 4.9% in Fayetteville — top-decile yield for the area; either an underpriced asset or a hidden risk that comps aren't pricing in. Stress-test before assuming the spread holds.
Location & tenants
- Location reads 75/100 on livability (#45 in NC, #4,031 nationally) — a middle-class / working-renter tenant base. Strengths: commute A+, cost of living A+, housing A+; Watch: crime F, employment D-.
- Cumberland County Schools (urban): math 32% / reading 41% proficiency, ranked #126 of 178 in NC (top 71%) — families likely to look elsewhere, expect single-tenant / working-renter base with shorter leases.
- Zoned schools: Luther Nick Jeralds Middle (math 13% / reading 24%, grade F, #436 of 475 statewide, top 93%, 616 students, 100% FRL); E E Smith High (math 42% / reading 41%, grade F, #381 of 535 statewide, top 72%, 1,004 students, 99% FRL) — zoned schools average 99% FRL vs 55% district-wide (45 pts higher); higher-poverty schools than district average — tighter screening recommended.
- Market conditions: Rents rising (+3.5%/yr); 132 active listings in the ZIP; 31 comparable units currently listed for rent nearby; rentals at typical pace (median 23d on market — plan ~3-4 weeks tenant-placement turnaround); lower-income renter base — watch delinquency; 1,125 units permitted in Cumberland County in 2024 (104 in 5+ unit buildings).
- This rent runs 38% of the median local income ($39k/yr) — at the standard rent-burdened threshold; future hikes will face affordability resistance.
Forward outlook
- Local home prices are declining (-3.0%/yr); year-one equity from $795 of loan paydown is wiped out by about $3k of value loss. Plan a longer hold.
Negotiation context
- It's been on market 31 days — a 3% lower offer ($112k) is reasonable based on typical stale-listing flexibility.
- 7 sale attempts since 3y ago with the ask held roughly flat each time — persistent listings suggest the price (not the market) is what's stuck; bring a comps-based counter.
Risks & watch-outs
- Watch-outs: built in 1949 — expect roof / HVAC / electrical / plumbing capex.
- Climate carrying-cost: major wind risk, 78% chance of damaging wind over 30y; extreme-heat days projected 7→16/yr by 2055 (HVAC capex compounding) — expect insurance premiums to compound above CPI over the hold.
Questions for the listing agent
- It's been on market 31 days. Have you received any prior offers? Is the seller open to a 3% concession, seller financing, or rate buy-down credit?
- Built in 1949 — when were the roof, HVAC, electrical panel, plumbing, and water heater last replaced?
- Is there a deadline driving the sale (1031 exchange, divorce, estate, relocation)? That informs how much negotiation room exists.
- Crime grade is F in this area — have there been break-ins, vandalism, or insurance claims at this property in the last 3 years? What carrier currently insures it and at what premium?
- The area grade is low — what's the realistic commute time and amenity access for the typical tenant pool here? Any planned neighborhood developments (good or bad) we should know about?
- What's the average days-on-market for RENTAL listings here right now (not sales)? A rising rental-DOM trend means longer vacancies and softer asking-rent achievability than the comps imply.
- What's the recent tenant-quality profile in this submarket — average credit score on applications, eviction rate, late-payment / NSF rate, and stable-employment percentage? A property-management company in the area should have these aggregated.
- How much new for-sale + rental construction is in the pipeline within 1–3 miles? Heavy new supply typically softens prices + rents 12–24 months out; constrained supply supports both.
Investment metrics
- 1% rule
- 1.09% ✓
- Cap rate
- 8.59%
- Cash-on-cash
- 8.19%
- DSCR
- 1.36
- GRM
- 7.7
CMA / ARV
- ARV (on-the-fly)
- $84,888
- Comps found
- 12
Show comp detail 12 sales within ~0.75 mi
| Address | Dist | Beds/Ba | Sqft | Sold | Price | $/sf | Match |
|---|---|---|---|---|---|---|---|
| 218 Langdon St | 0.12mi | 3/1.0 | 1,012 (-3%) | 6mo | $134,000 | $132 | 84 |
| 218 Sunset Ave | 0.03mi | 2/1.0 (-1) | 1,004 (-4%) | 5mo | $70,000 | $70 | 82 |
| 1917 Dogwood St | 0.50mi | 3/1.0 | 1,050 (+0%) | 2mo | $85,000 | $81 | 75 |
| 1203 Hillsboro St | 0.46mi | 2/1.0 (-1) | 1,077 (+3%) | 0mo | $72,500 | $67 | 69 |
| 2066 Osceola Dr | 0.40mi | 3/1.0 | 1,108 (+6%) | 9mo | $81,000 | $73 | 65 |
| 2051 Osceola Dr | 0.33mi | 3/1.0 | 950 (-9%) | 7mo | $88,000 | $93 | 63 |
| 2104 Rosehill Rd | 0.34mi | 3/1.0 | 942 (-10%) | 6mo | $46,500 | $49 | 62 |
| 2061 Osceola Dr | 0.38mi | 3/1.0 | 928 (-12%) | 6mo | $78,000 | $84 | 58 |
| 2062 Osceola Dr | 0.37mi | 3/1.0 | 925 (-12%) | 6mo | $65,000 | $70 | 58 |
| 310 Brookwood Ave | 0.50mi | 3/1.0 | 970 (-7%) | 7mo | $50,100 | $52 | 58 |
| 1406 Edgecombe Ave | 0.34mi | 2/1.0 (-1) | 896 (-14%) | 3mo | $85,000 | $95 | 52 |
| 202 Facility Dr | 0.50mi | 3/1.0 | 1,155 (+10%) | 10mo | $154,000 | $133 | 51 |
Match score weights: distance 35% · size 25% · config 20% · recency 20%. Top-matched comps best support the ARV.
Projected returns pro-forma
-3.0% appreciation · 3.49% rent growth · sell at horizon
- IRR
- -3.3%
- Equity multiple
- 0.88×
- Total profit
- $-4,016
- Equity at exit
- $17,147
- IRR
- 6.9%
- Equity multiple
- 1.53×
- Total profit
- $17,106
- Equity at exit
- $9,943
Cash invested: $32,200 (down + closing). Projections, not guarantees.
Landlord ↔ Tenant lean methodology
- Overall (STATE)
- 85 Strongly Landlord-Friendly
- State North Carolina
- 85 Strongly Landlord-Friendly · R+3
- County
- — inherits STATE
- City
- — inherits STATE
ZIP-level market 28301
- Home prices YoY
- -12.5%
- Rents YoY
- 3.5%
- Active inventory
- 132
- Price-to-rent
- 7.7×
Monthly cashflow live
- Estimated rent
- $1,251 high interval (Pro) →
- Mortgage (P&I)
- −$603
- Tax from tax record
- −$118 /mo · $1,411/yr
- Insurance
- −$48
- HOA
- −$0
- Vacancy / Maint / Mgmt
- −$263
- Net cashflow
- $220
Break-even live
UW: 25.0% down · 7.5% · 30yr · 1.5% tax · 5.0% vac · 8.0% maint · 8.0% mgmt
Financing live
Cash to close
- Down payment
- $28,750
- Closing costs
- $3,450
- Reserves months
- —
- Total cash needed
- —
Loan-product check · same deal, 3 products live
Conventional
25% down · 7.5% · 30yr
- Down + closing
- —
- Monthly P&I
- —
- Monthly cashflow
- —
- DSCR
- —
- Eligible?
- —
Personal DTI + credit; lowest rate.
DSCR
20% down · 8.5% · 30yr
- Down + closing
- —
- Monthly P&I
- —
- Monthly cashflow
- —
- DSCR
- —
- Eligible?
- —
No personal income docs; deal must DSCR.
Hard money
10% down · 12.0% · 12mo
- Down + closing
- —
- Monthly P&I
- —
- Monthly cashflow
- —
- DSCR
- —
- Eligible?
- —
Short-term bridge; refi at stabilization.
Rent comps 31 comps
| Address | Beds | Baths | Sqft | Rent | $/sqft | DOM | Units | Dist |
|---|---|---|---|---|---|---|---|---|
| 112 Quincy St Fayetteville, NC | 3.0 | 1.0 | 1080 | $1,320 | $1.22 | 13d | 1 | 0.20mi |
| 1608 Fayette Ave Fayetteville, NC | 2.0 | 1.0 | 900 | $875 | $0.97 | 23d | 1 | 0.28mi |
| 1608 Fayette Ave Fayetteville, NC | 2.0 | 1.0 | 900 | $875 | $0.97 | 13d | 1 | 0.28mi |
| 2061 Osceola Dr Fayetteville, NC | 3.0 | 1.0 | 928 | $1,300 | $1.40 | 23d | 1 | 0.36mi |
| 1847 Blake St Fayetteville, NC | 3.0 | 2.0 | 900 | $990 | $1.10 | 13d | 1 | 0.37mi |
| 1847 Blake St Fayetteville, NC | 3.0 | 2.0 | 900 | $990 | $1.10 | 23d | 1 | 0.37mi |
| 307 Hawthorne Rd Fayetteville, NC | 3.0 | 1.0 | 886 | $1,125 | $1.27 | 13d | 1 | 0.40mi |
| 122 Kensington Cir Fayetteville, NC | 3.0 | 1.0 | 856 | $1,250 | $1.46 | 23d | 1 | 0.44mi |
| 2015 Blake St Fayetteville, NC | 2.0 | 1.0 | 700 | $995 | $1.42 | 23d | 1 | 0.47mi |
| 110 Facility Dr #2015 Fayetteville, NC | 2.0 | 1.0 | 700 | $995 | $1.42 | 23d | 1 | 0.47mi |
| 302 Brookwood Ave Fayetteville, NC | 2.0 | 1.0 | 979 | $1,250 | $1.28 | 13d | 1 | 0.47mi |
| 398 Bainbridge Ct Fayetteville, NC | 3.0 | 2.0 | 900 | $990 | $1.10 | 13d | 1 | 0.51mi |
| 398 Bainbridge Ct Fayetteville, NC | 3.0 | 2.0 | 900 | $990 | $1.10 | 23d | 1 | 0.51mi |
| 113 Mullins Ave Fayetteville, NC | 2.0 | 1.0 | 1000 | $1,025 | $1.02 | 23d | 1 | 0.51mi |
| 1606 Gibson St Fayetteville, NC | 3.0 | 1.5 | 1014 | $1,000 | $0.99 | 23d | 1 | 0.54mi |
| 282 Windsor Dr Fayetteville, NC | 3.0 | 1.0 | 855 | $1,000 | $1.17 | 23d | 1 | 0.63mi |
| 1704 Newark Ave Fayetteville, NC | 2.0 | 1.0 | 1100 | $850 | $0.77 | 23d | 1 | 0.77mi |
| 216 Brainerd Ave Fayetteville, NC | 2.0 | 1.0 | 818 | $1,150 | $1.41 | 23d | 1 | 0.97mi |
| 118 Circle Ct Fayetteville, NC | 3.0 | 2.0 | 1496 | $1,550 | $1.04 | 13d | 1 | 0.97mi |
| 806 Lakeland St Fayetteville, NC | 3.0 | 1.0 | 864 | $1,400 | $1.62 | 23d | 1 | 1.00mi |
| 508 Stone Way Ct Fayetteville, NC | 3.0 | 2.0 | 1261 | $1,900 | $1.51 | 23d | 1 | 1.13mi |
| 2737 Kentberry Ave Fayetteville, NC | 2.0–3.0 | 2.0 | 1209 | $1,400 | $1.16 | 13d | 5 | 1.16mi |
| 100 Sycamore Ct Fayetteville, NC | 2.0 | 1.0 | 800 | $875 | $1.09 | 23d | 1 | 1.21mi |
| 2678 Rivercliff Rd Fayetteville, NC | 3.0 | 2.0 | 1260 | $1,500 | $1.19 | 23d | 1 | 1.22mi |
| 1261 Thelbert Dr Fayetteville, NC | 2.0 | 1.0 | 768 | $1,100 | $1.43 | 13d | 1 | 1.25mi |
| 539 Crooked Creek Ct Fayetteville, NC | 3.0 | 2.0 | 1258 | $1,395 | $1.11 | 23d | 1 | 1.32mi |
| 2846 Copenhagen Dr Fayetteville, NC | 3.0 | 2.0 | 1100 | $1,600 | $1.45 | 23d | 1 | 1.39mi |
| 633 Elk Ct Fayetteville, NC | 2.0 | 1.5 | 1000 | $1,000 | $1.00 | 23d | 1 | 1.44mi |
| 733 Ashburton Dr Fayetteville, NC | 3.0 | 1.5 | 1118 | $1,300 | $1.16 | 23d | 1 | 1.44mi |
| 1228 Woodland Dr Unit 1 Fayetteville, NC | 2.0 | 2.0 | 1465 | $1,595 | $1.09 | 13d | 1 | 1.45mi |
| 620 Forest Rd Fayetteville, NC | 2.0 | 1.0 | 1000 | $975 | $0.97 | 23d | 2 | 1.49mi |
Listing history 28 events
-
2026-06-18days on market $115,000 Active 31 DOM
-
2026-06-17days on market $115,000 Active 30 DOM
-
2026-06-16days on market $115,000 Active 29 DOM
-
2026-06-15days on market $115,000 Active 28 DOM
-
2026-06-14days on market $115,000 Active 26 DOM
-
2026-06-13days on market $115,000 Active 25 DOM
-
2026-06-10days on market $115,000 Active 23 DOM
-
2026-06-09days on market $115,000 Active 22 DOM
-
2026-06-08days on market $115,000 Active 21 DOM
-
2026-06-07days on market $115,000 Active 20 DOM
-
2026-06-03days on market $115,000 Active 16 DOM
-
2026-06-02days on market $115,000 Active 15 DOM
-
2026-06-01days on market $115,000 Active 14 DOM
-
2026-05-31days on market $115,000 Active 13 DOM
-
2026-05-30days on market $115,000 Active 12 DOM
-
2026-05-14$115,000 Active
-
2026-03-23historical $1,100
-
2026-02-20$1,100
-
2025-11-24$115,000 Active
-
2025-08-30status Pending
-
2025-06-13status Active
-
2025-05-01status Pending
-
2025-04-09$115,000 Active
-
2024-09-18price $120,000
-
2024-08-22status Active
-
2024-08-02status Pending
-
2023-10-17price $130,000
-
2023-10-01$150,000 Active
ⓘ Source: listings_history table (triggers on properties + properties_extension) + one-shot
backfill from property_details.listing_events for pre-trigger history.
Tax reassessment forecast NC · Resets to sale price
- Current annual tax
- $1,411 · $118/mo
- Projected year-2 tax
- $1,411 · $118/mo
- Expected delta
- $0/yr ($0/mo · 0.0%)
ⓘ Screening estimate from a state-policy table — verify with the county assessor before closing.
Climate risk First Street
- Flood 1/10 Low FEMA zone X (unshaded) · 0% chance over 30 yrs
- Wildfire 3/10 Moderate
- Heat 7/10 Severe 7 d/yr ≥106°F today · 16 d/yr by 30 yrs out
- Wind 7/10 Severe 78% chance of damaging wind over 30 yrs
- Air quality 2/10 Low 0 unhealthy d/yr today · 1 by 30 yrs out
Nearby sold comps map
Loading sold comps map…
Walkable amenities ~0.75 mi
Loading nearby amenities…
Taxation est. · year 1
- Rental income
- $15,013
- − Mortgage interest
- −$6,442
- − Property taxes
- −$1,411
- − Insurance
- −$575
- − Repairs & maintenance
- −$1,201
- − Management
- −$1,201
- − Depreciation
- −$3,345
- Taxable income
- $837
- Est. tax owed @ 24.0%
- −$201
- After-tax cash flow
- $2,436/yr
For passive investors: Depreciation is non-cash, so a rental often shows a tax loss while cash-flowing — sheltering income. Rental losses are passive: they offset passive income freely, and up to $25,000/yr can offset ordinary (W-2) income if you actively participate and your MAGI is under $100k (phasing out to $0 by $150k); unused losses carry forward. On sale, claimed depreciation is recaptured at up to 25%, and gains may owe capital-gains tax (a 1031 exchange can defer both). Figures are a year-1 estimate at your 24.0% rate — not tax advice; consult a CPA.
Schools (NCES district)
- District
- Cumberland County Schools
- NCES district ID
- 3700011
- Math proficiency
- 32% ▼ -2.00%
- Reading proficiency
- 41% ▼ -1.00%
- Median HH income
- $44,168
- Composite
- 31.0/100
- National rank
- #6096
- State rank
- #126 of 178 in NC
Livability — Fayetteville
- Score
- 75/100
- State rank
- #45
- US rank
- #4031
Category grades
Schools grade is shown separately in the Schools card above.
Census & demographics
- Census place
- Fayetteville, NC
- County
- Cumberland County · 265,314 people
- City population
- 226,118
- Metro
- Fayetteville, NC
- Population (ZIP)
- 16,798
- Household income
- $39,198
- Rent vs Own
- Severe rent burden
- 1389.0
Population outlook (Cumberland County) Hauer SSP2
- Today (2025)
- 330,855 people
- By 2030
- 333,523 · +0.8%
- By 2040
- 335,583 · +1.4%
- By 2050
- 335,325 · +1.4%
- By 2075
- 342,853 · +3.6%
- By 2100
- 340,698 · +3.0%
Race, ethnicity, and origin ACS 2023
- Neighborhood character
- Predominantly Black (68%)
- Race & ethnicity
- Black 68% White 19% Two or more races 6% Hispanic / Latino 5%
- Common ancestry
- Serbian 1% Slovak 1% Romanian 1%
- Foreign-born
- 3% · Canada
- Languages at home
- 95% English-only · Spanish 3% French/Haitian/Cajun 1%
Political lean MEDSL · Cumberland
- 2024 margin
- D (+13.4) · D 56.1% · R 42.7% · Other 1.2%
- 2008→2024 swing
- -4.3pp toward R · 2008: 17.7pp · 2024: 13.4pp
- All cycles
- 2024: D+13.4 2020: D+16.6 2016: D+16.0 2012: D+19.7 2008: D+17.7
Not yet ingested
- Civics
- —
Market trends
- HPI YoY
- ▼ -37.92%
- Current HPI
- 265.98
- Rent YoY
- ▲ 3.49%
- Metro
- Fayetteville, NC
- State GDP YoY
- ▲ 3.28%
- F500 in state
- 26
Industry mix (Fortune 500 HQ in NC)
| Industry | F500 HQs | Revenue |
|---|---|---|
| Financial Services | 2 | $213B |
|
||
| Retail | 2 | $95B |
|
||
| Industrial Conglomerate | 1 | $38B |
|
||
| Metals / Steel | 1 | $35B |
|
||
| Utilities | 1 | $30B |
|
||
| Industrial Machinery | 1 | $19B |
|
||
Price history
-23.3% since first listed13 events — show timeline
- 2026-05-14 Listed $115,000 LPRMLS
- 2026-03-23 Rental Removed $1,100 TENANTCLOUD
- 2026-02-20 Listed for Rent $1,100 TENANTCLOUD
- 2025-11-24 Listed $115,000 LPRMLS
- 2025-08-30 Pending — LPRMLS
- 2025-06-13 Relisted — LPRMLS
- 2025-05-01 Pending — LPRMLS
- 2025-04-09 Listed $115,000 LPRMLS
- 2024-09-18 Price Changed $120,000 LPRMLS
- 2024-08-22 Relisted — LPRMLS
- 2024-08-02 Pending — LPRMLS
- 2023-10-17 Price Changed $130,000 LPRMLS
- 2023-10-01 Listed $150,000 LPRMLS
Property tax history
+6.1%/yrLatest (2025): $1,411 · +44.2% YoY. Source: county tax records.
Cash-flow waterfall
monthlySold comps — $/sqft
last 12 mo · ≤1 miLoading sold comps…