 Duplex
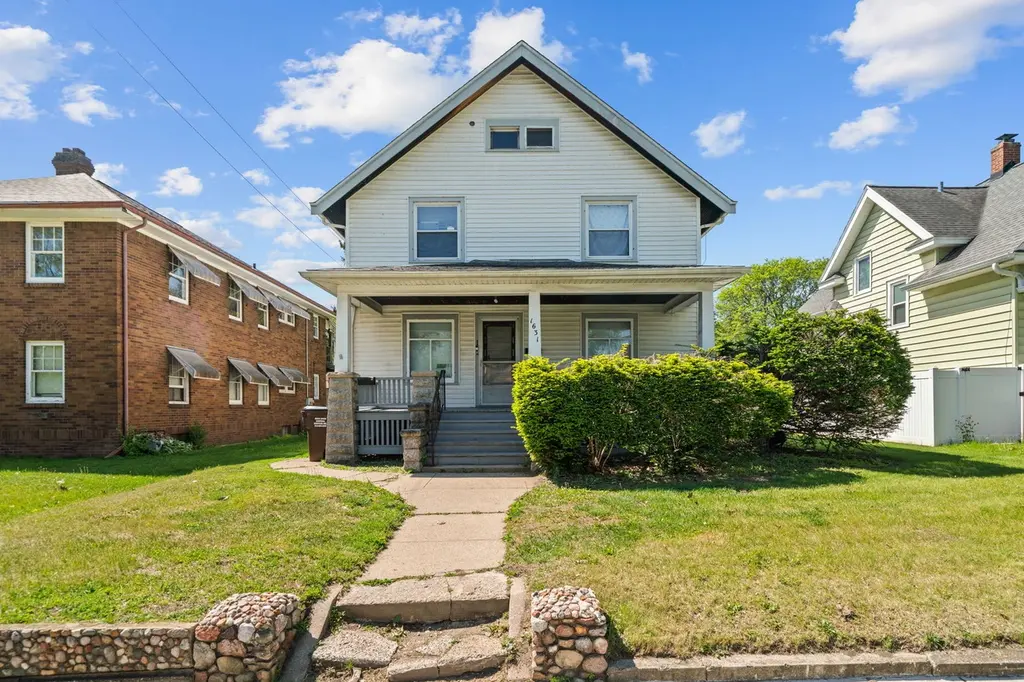
1631 8th Ave · Rockford, IL
Flood risk 3/10 · Minor
- FEMA flood zone
- X (unshaded)
- Chance of flooding over 30 yrs
- 0.1%
- Est. flood insurance / yr
- $473 – $860
Fire risk 1/10 · Minimal
- Est. fire insurance / yr
- $804 – $1,492
Heat risk 2/10 · Minimal
- Hot days now (above 101°F)
- 7 days/yr
- Hot days in 30 yrs
- 15 days/yr
Wind risk 2/10 · Minimal
- Chance of severe wind over 30 yrs
- —
Air-quality risk 2/10 · Minimal
- Unhealthy air days now
- 1 days/yr
- Unhealthy air days in 30 yrs
- 2 days/yr
Risk factors via First Street. Map © Google.
Why this score? — see what drove the B- grade
The composite is a weighted blend of 9 inputs, each scored 0–100. Each bar is that input's sub-score; the figure is the points it added to the 100-point composite (weight × sub-score).
- Cash flow +28.9/30.0
- DSCR +10.0/10.0
- 1% rule +7.8/10.0
- ARV discount +7.5/15.0
- Rent growth +4.9/5.0
- Livability +3.1/5.0
- Condition / age +2.5/5.0
- Schools +1.2/10.0
- Appreciation +0.0/10.0
$165,000
🖨 Deal sheet 📄 Offer letter ✓ Due diligence
Multi-family units
County records classify this as Multi-Family (2-4 Unit). Listing-text estimate: 2 units. confirmed
Listing remarks MLS
Ready to expand your portfolio? Check out this fully rented 2-unit multifamily property offering steady income from day one. Each spacious unit features 2 bedrooms, 1 bathroom, a comfortable living room, and a functional kitchen layout. Main Floor Unit Rent is $1050, Upper Unit $850. Solar Panels are $46.00 a month. The property owner pays water, sewer, and electric. Tenant pays gas. 24 Hour show notice required for showings. 48 Hour show notice preferred.
Key facts
- Parking
- Built 1915
- Listed 13 days
Property features AI
Finance
- Other: Possession subject to tenant rights; No special service area
- Financial info: Insurance expense approximately $1,500; Building has 2 units; Unit 1 rent: $1,050; security deposit $2,100; lease through January 1, 2026; Unit 2 rent: $850; security deposit $1,700; lease through February 1, 2025
Exterior
- Parking: 2 off-street parking spaces (total)
- Utilities: Public water; Public sewer
- Home design: Two-to-four unit building; Fee simple ownership; Not a conversion
- Construction: Built over 100 years ago; Vinyl siding exterior; Property built before 1978
- Exterior features: Lot dimensions: 50 x 140 x 50 x 140; Less than 0.25 acre lot; Zoned MULTI
Interior
- Kitchen: Each unit includes a stove and refrigerator
- Bedrooms: 4 bedrooms total; Each unit has 2 bedrooms
- Bathrooms: 2 full bathrooms total; Each unit has 1 full bathroom
- Heating & cooling: Natural gas heating
- Interior features: 10 total rooms; Unfinished full basement
- Laundry & utility: Tenants pay for gas
Neighborhood map
What this means for you Summary
Snapshot
- This is a 2 × 2-bed/1.0-bath units multifamily listed at $165k.
Deal economics
- At list price, monthly cash flow is $560 ($7k/yr) — positive. Per door: $280/mo.
- The deal already cash-flows at list — no discount required.
- Meets the 1% rule at list price ($2k rent vs $165k).
- Cap rate 10.4% vs local median 6.1% in Rockford — top-decile yield for the area; either an underpriced asset or a hidden risk that comps aren't pricing in. Stress-test before assuming the spread holds.
Location & tenants
- Location reads 62/100 on livability (#876 in IL) — a middle-class / working-renter tenant base. Strengths: cost of living A+, housing A+, health & safety A+; Watch: crime F, amenities F, commute F.
- Rockford SD 205 (urban): math 12% / reading 16% proficiency, ranked #533 of 620 in IL (top 86%) — low school quality limits family demand, transient renter base, plan for 1-2y turnover; 73% free/reduced lunch — lower-income household profile, screen leases tightly.
- Zoned schools: Ellis Elementary School (math 2% / reading 2%, grade F, #1,927 of 2,056 statewide, top 100%, 401 students, 0% FRL); Abraham Lincoln Middle School (math 3% / reading 7%, grade F, #636 of 665 statewide, top 98%, 699 students, 0% FRL); Rockford East High School (math 7% / reading 13%, grade F, #528 of 693 statewide, top 82%, 1,718 students, 0% FRL) — zoned schools average 0% FRL vs 73% district-wide (73 pts lower); this property's tenant base skews higher-income than the district average.
- Market conditions: Rents rising fast (+9.7%/yr); 67 active listings in the ZIP; 17 comparable units currently listed for rent nearby; rentals lingering (median 44d on market — plan ~5-8 weeks vacancy on turnover, expect pricing pressure); 53% of comp listings sitting > 30 days — soft ceiling on asking rent; lower-income renter base — watch delinquency; 285 units permitted in Winnebago County in 2024 (0 in 5+ unit buildings).
- At $2,109/mo this rent would consume 75% of the median local household income ($34k/yr) (locally 1406% of renters already pay >50% of income on rent) — very limited rent-growth headroom before tenants either downsize or default.
Forward outlook
- Local home prices are declining (-3.0%/yr); year-one equity from $1k of loan paydown is wiped out by about $5k of value loss. Plan a longer hold.
- Winnebago County population projected at -20% by 2050 — secular population decline; favor cash flow + early exit over multi-decade hold.
- At projected returns (-3.0% appreciation + 8.0% rent growth), your $46k cash investment doubles in ~6 years — after that, you're playing with house money.
Negotiation context
- Only 14 days on market — expect competitive offers; lowballing is unlikely to land.
- 9 sale attempts since 7y ago with the ask held roughly flat each time — persistent listings suggest the price (not the market) is what's stuck; bring a comps-based counter.
Risks & watch-outs
- Watch-outs: built in 1915 — expect roof / HVAC / electrical / plumbing capex.
Questions for the listing agent
- Can we see the unit-by-unit rent roll, current vacancy, and any below-market leases? What's the average tenancy length?
- What capital expenditures (roof, boiler, parking lot, exteriors) have been made in the last 5 years, and what's planned in the next 2?
- Built in 1915 — when were the roof, HVAC, electrical panel, plumbing, and water heater last replaced?
- Is there a deadline driving the sale (1031 exchange, divorce, estate, relocation)? That informs how much negotiation room exists.
- Schools are F-rated, which usually means shorter tenancies and higher turnover. Who's the typical renter profile here, and what's been the actual vacancy rate?
- Crime grade is F in this area — have there been break-ins, vandalism, or insurance claims at this property in the last 3 years? What carrier currently insures it and at what premium?
- What's the average days-on-market for RENTAL listings here right now (not sales)? A rising rental-DOM trend means longer vacancies and softer asking-rent achievability than the comps imply.
- What's the recent tenant-quality profile in this submarket — average credit score on applications, eviction rate, late-payment / NSF rate, and stable-employment percentage? A property-management company in the area should have these aggregated.
- How much new apartment / multifamily construction is in the pipeline within 1–3 miles? Heavy new supply (>2% of stock underway) typically softens rents 12–24 months out; light construction supports rent growth.
Investment metrics
- 1% rule
- 1.28% ✓
- Cap rate
- 10.37%
- Cash-on-cash
- 14.54%
- DSCR
- 1.65
- GRM
- 6.5
CMA / ARV
No comps found within radius.
Show comp detail 12 sales within ~0.75 mi
| Address | Dist | Beds/Ba | Sqft | Sold | Price | $/sf | Match |
|---|---|---|---|---|---|---|---|
| 1443 8th Ave | 0.16mi | 4/4.0 | 1,388 | 3mo | $219,900 | $158 | 70 |
| 328 S Prospect St | 0.40mi | 4/3.0 | — | 3mo | $172,000 | — | 62 |
| 1308 19th St | 0.58mi | 4/2.0 | — | 1mo | $185,000 | — | 60 |
| 1211 4th Ave | 0.55mi | 4/2.0 | — | 3mo | $72,000 | — | 59 |
| 502 Pearl St | 0.47mi | 3/2.0 (-1) | — | 2mo | $158,000 | — | 59 |
| 124 S Prospect St | 0.56mi | 4/2.0 | — | 3mo | $130,000 | — | 59 |
| 1507-09 16th Ave | 0.54mi | 5/2.0 (+1) | — | 1mo | $203,000 | — | 56 |
| 1323 Broadway | 0.53mi | 3/2.0 (-1) | — | 2mo | $75,000 | — | 56 |
| 1509 16th Ave | 0.60mi | 5/2.0 (+1) | — | 1mo | $203,000 | — | 54 |
| 1204 S 6th St | 0.68mi | 4/2.0 | — | 3mo | $128,000 | — | 53 |
| 906 S 5th St | 0.72mi | 4/2.0 | — | 1mo | $138,000 | — | 53 |
| 2304 17th Ave | 0.75mi | 4/2.0 | — | 0mo | $188,500 | — | 52 |
Match score weights: distance 35% · size 25% · config 20% · recency 20%. Top-matched comps best support the ARV.
Projected returns pro-forma
-3.0% appreciation · 8.0% rent growth · sell at horizon
- IRR
- 10.4%
- Equity multiple
- 1.43×
- Total profit
- $20,081
- Equity at exit
- $24,602
- IRR
- 23.2%
- Equity multiple
- 3.47×
- Total profit
- $114,179
- Equity at exit
- $14,266
Cash invested: $46,200 (down + closing). Projections, not guarantees.
Landlord ↔ Tenant lean methodology
- Overall (STATE)
- 43 Moderately Tenant-Leaning
- State Illinois
- 43 Moderately Tenant-Leaning · D+7
- County
- — inherits STATE
- City
- — inherits STATE
ZIP-level market 61104
- Home prices YoY
- -21.4%
- Rents YoY
- 9.7%
- Active inventory
- 67
- Price-to-rent
- 13.0×
Monthly cashflow live
- Estimated rent
- $2,109 high interval (Pro) →
- Mortgage (P&I)
- −$865
- Tax from tax record
- −$172 /mo · $2,066/yr
- Insurance
- −$69
- HOA
- −$0
- Vacancy / Maint / Mgmt
- −$443
- Net cashflow
- $560
Break-even live
2-unit breakdown (identical units grouped — click to expand)
| Units | Beds | Baths | Est. rent |
|---|---|---|---|
| 2× units | 2 | 1 | $2,110 |
| #1 | 2 | 1 | $1,055 |
| #2 | 2 | 1 | $1,055 |
| Total (2 units) | $2,109 | ||
UW: 25.0% down · 7.5% · 30yr · 1.5% tax · 5.0% vac · 8.0% maint · 8.0% mgmt
Financing live
Cash to close
- Down payment
- $41,250
- Closing costs
- $4,950
- Reserves months
- —
- Total cash needed
- —
Loan-product check · same deal, 3 products live
Conventional
25% down · 7.5% · 30yr
- Down + closing
- —
- Monthly P&I
- —
- Monthly cashflow
- —
- DSCR
- —
- Eligible?
- —
Personal DTI + credit; lowest rate.
DSCR
20% down · 8.5% · 30yr
- Down + closing
- —
- Monthly P&I
- —
- Monthly cashflow
- —
- DSCR
- —
- Eligible?
- —
No personal income docs; deal must DSCR.
Hard money
10% down · 12.0% · 12mo
- Down + closing
- —
- Monthly P&I
- —
- Monthly cashflow
- —
- DSCR
- —
- Eligible?
- —
Short-term bridge; refi at stabilization.
Rent comps 17 comps
| Address | Beds | Baths | Sqft | Rent | $/sqft | DOM | Units | Dist |
|---|---|---|---|---|---|---|---|---|
| 1004 15th St Rockford, IL | 4.0 | 1.5 | 1267 | $1,450 | $1.14 | 21d | 1 | 0.20mi |
| 1351 7th Ave Rockford, IL | 4.0 | 2.0 | 1040 | $2,000 | $1.92 | 43d | 1 | 0.31mi |
| 333 S Gardiner Ave Unit AVE2 Rockford, IL | 4.0 | 1.0 | 1306 | $1,600 | $1.23 | 43d | 1 | 0.41mi |
| 1202 18th St Unit 3 Rockford, IL | 3.0 | 1.0 | 1500 | $1,700 | $1.13 | 13d | 1 | 0.42mi |
| 1231 11th Ave Rockford, IL | 4.0 | 1.0 | 1284 | $1,450 | $1.13 | 43d | 1 | 0.48mi |
| 1209 6th Ave Rockford, IL | 3.0 | 1.0 | — | $1,500 | — | 21d | 1 | 0.51mi |
| 1119 9th Ave Unit 1W Rockford, IL | 3.0 | 1.0 | 1155 | $1,600 | $1.39 | 43d | 1 | 0.57mi |
| 1612 10th St Unit 2 Rockford, IL | 3.0 | 1.0 | — | $1,250 | — | 43d | 1 | 0.59mi |
| 1519 17th Ave Rockford, IL | 3.0 | 2.0 | 1500 | $1,600 | $1.07 | 13d | 1 | 0.67mi |
| 713 S 4th St Unit Upper Rockford, IL | 4.0 | 2.0 | — | $1,500 | — | 43d | 1 | 0.86mi |
| 2217 8th St Rockford, IL | 3.0 | 1.0 | 1260 | $1,500 | $1.19 | 43d | 1 | 1.13mi |
| 512 Market St Unit 512 UPPER Rockford, IL | 3.0 | 1.0 | — | $1,750 | — | 43d | 1 | 1.14mi |
| 620 Paris Ave Rockford, IL | 5.0 | 3.5 | — | $2,200 | — | 21d | 1 | 1.14mi |
| 507 Oak St Unit 2 Rockford, IL | 3.0 | 2.5 | — | $1,250 | — | 21d | 1 | 1.15mi |
| 222 S 2nd St Unit 224 Rockford, IL | 3.0 | 1.0 | — | $1,350 | — | 21d | 1 | 1.15mi |
| 708 29th St Rockford, IL | 3.0 | 2.0 | 1800 | $1,600 | $0.89 | 21d | 1 | 1.23mi |
| 344 Buckbee St Rockford, IL | 3.0 | 2.0 | — | $1,300 | — | 43d | 1 | 1.25mi |
Listing history 35 events
-
2026-06-19days on market $165,000 Active 14 DOM
-
2026-06-18days on market $165,000 Active 13 DOM
-
2026-06-17statusdays on market $165,000 Active 12 DOM
-
2026-06-09status $165,000 Pending 11 DOM
-
2026-06-08days on market $165,000 Active 11 DOM
-
2026-06-07remarks 469-char remark
-
2026-06-07days on market $165,000 Active 10 DOM
-
2026-06-03days on market $165,000 Active 6 DOM
-
2026-06-02days on market $165,000 Active 5 DOM
-
2026-06-01days on market $165,000 Active 4 DOM
-
2026-05-31days on market $165,000 Active 3 DOM
-
2026-05-30days on market $165,000 Active 2 DOM
-
2026-05-29$165,000 Active 460-char remark
Show marketing remark (460 chars)
Ready to expand your portfolio? Check out this fully rented 2-unit multifamily property offering steady income from day one. Each spacious unit features 2 bedrooms, 1 bathroom, a comfortable living room, and a functional kitchen layout. Main Floor Unit Rent is $1050, Upper Unit $850. Solar Panels are $46.00 a month. The property owner pays water, sewer, and electric. Tenant pays gas. 24 Hour show notice required for showings. 48 Hour show notice preferred.
-
2026-05-29$165,000 Active
Show marketing remark (460 chars)
Ready to expand your portfolio? Check out this fully rented 2-unit multifamily property offering steady income from day one. Each spacious unit features 2 bedrooms, 1 bathroom, a comfortable living room, and a functional kitchen layout. Main Floor Unit Rent is $1050, Upper Unit $850. Solar Panels are $46.00 a month. The property owner pays water, sewer, and electric. Tenant pays gas. 24 Hour show notice required for showings. 48 Hour show notice preferred.
-
2025-04-04soldstatus $147,500 Closed 393-char remark
Show marketing remark (393 chars)
Investors take a look at this one! 2 Family - Both units have been beautifully updated. Both units are spacious with 2 bedrooms, 1 bath, living and dining room areas and kitchens host lots of cabinets and counter top space. The owner pays water, sewer, and electric. The property has solar panels, so the electric is only about $45.00 per month. Tenants pay gas. Rents are $1050.00 and $850.00
-
2025-04-04soldstatus $147,500 Closed
Show marketing remark (393 chars)
Investors take a look at this one! 2 Family - Both units have been beautifully updated. Both units are spacious with 2 bedrooms, 1 bath, living and dining room areas and kitchens host lots of cabinets and counter top space. The owner pays water, sewer, and electric. The property has solar panels, so the electric is only about $45.00 per month. Tenants pay gas. Rents are $1050.00 and $850.00
-
2025-02-18status Pending
-
2025-02-16status Pending 393-char remark
Show marketing remark (393 chars)
Investors take a look at this one! 2 Family - Both units have been beautifully updated. Both units are spacious with 2 bedrooms, 1 bath, living and dining room areas and kitchens host lots of cabinets and counter top space. The owner pays water, sewer, and electric. The property has solar panels, so the electric is only about $45.00 per month. Tenants pay gas. Rents are $1050.00 and $850.00
-
2025-02-11$154,900 Active 393-char remark
Show marketing remark (393 chars)
Investors take a look at this one! 2 Family - Both units have been beautifully updated. Both units are spacious with 2 bedrooms, 1 bath, living and dining room areas and kitchens host lots of cabinets and counter top space. The owner pays water, sewer, and electric. The property has solar panels, so the electric is only about $45.00 per month. Tenants pay gas. Rents are $1050.00 and $850.00
-
2025-02-11$154,900 Active
Show marketing remark (393 chars)
Investors take a look at this one! 2 Family - Both units have been beautifully updated. Both units are spacious with 2 bedrooms, 1 bath, living and dining room areas and kitchens host lots of cabinets and counter top space. The owner pays water, sewer, and electric. The property has solar panels, so the electric is only about $45.00 per month. Tenants pay gas. Rents are $1050.00 and $850.00
-
2024-07-31historical
-
2024-03-19Active
-
2024-01-08historical
-
2023-10-30price $149,900
-
2023-10-30Active
-
2021-11-05soldstatus $70,500 Closed
-
2021-10-04status Pending
-
2021-09-27status Active Under Contract
-
2021-09-24$72,000 Active
-
2019-09-13soldstatus $35,500
-
2019-09-06soldstatus $38,000
-
2019-08-22status Pending
-
2019-08-19New
-
2019-08-19$36,900
-
2017-12-19soldstatus $28,900
ⓘ Source: listings_history table (triggers on properties + properties_extension) + one-shot
backfill from property_details.listing_events for pre-trigger history.
Tax reassessment forecast IL · Partial reset (capped growth)
- Current annual tax
- $2,066 · $172/mo
- Projected year-2 tax
- $2,906 · $242/mo
- Expected delta
- +$840/yr (+$70/mo · 40.7%)
ⓘ Screening estimate from a state-policy table — verify with the county assessor before closing.
Climate risk First Street
- Flood 3/10 Moderate FEMA zone X (unshaded) · 10% chance over 30 yrs
- Wildfire 1/10 Low
- Heat 2/10 Low 7 d/yr ≥101°F today · 15 d/yr by 30 yrs out
- Wind 2/10 Low
- Air quality 2/10 Low 1 unhealthy d/yr today · 2 by 30 yrs out
Nearby sold comps map
Loading sold comps map…
Walkable amenities ~0.75 mi
Loading nearby amenities…
Taxation est. · year 1
- Rental income
- $25,308
- − Mortgage interest
- −$9,243
- − Property taxes
- −$2,066
- − Insurance
- −$825
- − Repairs & maintenance
- −$2,025
- − Management
- −$2,025
- − Depreciation
- −$4,800
- Taxable income
- $4,325
- Est. tax owed @ 24.0%
- −$1,038
- After-tax cash flow
- $5,681/yr
For passive investors: Depreciation is non-cash, so a rental often shows a tax loss while cash-flowing — sheltering income. Rental losses are passive: they offset passive income freely, and up to $25,000/yr can offset ordinary (W-2) income if you actively participate and your MAGI is under $100k (phasing out to $0 by $150k); unused losses carry forward. On sale, claimed depreciation is recaptured at up to 25%, and gains may owe capital-gains tax (a 1031 exchange can defer both). Figures are a year-1 estimate at your 24.0% rate — not tax advice; consult a CPA.
Schools (NCES district)
- District
- Rockford SD 205
- NCES district ID
- 1734510
- Math proficiency
- 12% ▼ -2.00%
- Reading proficiency
- 16% ▼ -3.00%
- Median HH income
- $42,533
- Composite
- 12.21/100
- National rank
- #9649
- State rank
- #533 of 620 in IL
Livability — Rockford
- Score
- 62/100
- State rank
- #876
- US rank
- #17035
Category grades
Schools grade is shown separately in the Schools card above.
Census & demographics
- Census place
- Rockford, IL
- County
- Winnebago County · 147,297 people
- City population
- 147,297
- Metro
- Rockford, IL
- Population (ZIP)
- 17,222
- Household income
- $33,772
- Rent vs Own
- Severe rent burden
- 1406.0
Population outlook (Winnebago County) Hauer SSP2
- Today (2025)
- 271,080 people
- By 2030
- 260,684 · -3.8%
- By 2040
- 238,405 · -12.1%
- By 2050
- 216,129 · -20.3%
- By 2075
- 172,882 · -36.2%
- By 2100
- 135,336 · -50.1%
Race, ethnicity, and origin ACS 2023
- Neighborhood character
- Highly diverse neighborhood (Simpson 0.70)
- Race & ethnicity
- White 41% Hispanic / Latino 26% Black 25% Two or more races 13% Asian 4%
- Hispanic origin (detail)
- Mexican 22% Puerto Rican 2%
- Common ancestry
- Romanian 2% Portuguese 2% Lithuanian 2%
- Foreign-born
- 16% · Canada, South Korea, Philippines
- Languages at home
- 74% English-only · Spanish 18% Other Asian/Pacific 3% Russian/Polish/Slavic 1%
Political lean MEDSL · Winnebago
- 2024 margin
- Toss-up / Even · D 49.5% · R 49.0% · Other 1.5%
- 2008→2024 swing
- -12.2pp toward R · 2008: 12.8pp · 2024: 0.6pp
- All cycles
- 2024: D+0.6 2020: D+2.5 2016: R+1.2 2012: D+5.7 2008: D+12.8
Not yet ingested
- Civics
- —
Market trends
- HPI YoY
- ▼ -63.40%
- Current HPI
- 233.0219
- Rent YoY
- ▲ 9.67%
- Metro
- Rockford, IL
- State GDP YoY
- ▲ 1.59%
- F500 in state
- 60
Industry mix (Fortune 500 HQ in IL)
| Industry | F500 HQs | Revenue |
|---|---|---|
| Insurance | 4 | $201B |
|
||
| Consumer Goods | 4 | $87B |
|
||
| Industrial Machinery | 3 | $64B |
|
||
| Healthcare | 2 | $55B |
|
||
| Retail / Pharmacy | 1 | $148B |
|
||
| Agriculture / Food | 1 | $86B |
|
||
Price history
+470.9% since first listed23 events — show timeline
- 2026-05-29 Listed $165,000 MRED as Distributed by MLS Grid
- 2026-05-29 Listed $165,000 NWIAR
- 2025-04-04 Sold (MLS) $147,500 MRED as Distributed by MLS Grid
- 2025-04-04 Sold (MLS) $147,500 NWIAR
- 2025-02-18 Pending — MRED as Distributed by MLS Grid
- 2025-02-16 Pending — NWIAR
- 2025-02-11 Listed $154,900 NWIAR
- 2025-02-11 Listed $154,900 MRED as Distributed by MLS Grid
- 2024-07-31 Listing Removed — MRED as Distributed by MLS Grid
- 2024-03-19 Listed — MRED as Distributed by MLS Grid
- 2024-01-08 Listing Removed — MRED as Distributed by MLS Grid
- 2023-10-30 Price Changed $149,900 NWIAR
- 2023-10-30 Listed — MRED as Distributed by MLS Grid
- 2021-11-05 Sold (MLS) $70,500 MRED as Distributed by MLS Grid
- 2021-10-04 Pending — MRED as Distributed by MLS Grid
- 2021-09-27 Pending — MRED as Distributed by MLS Grid
- 2021-09-24 Listed $72,000 MRED as Distributed by MLS Grid
- 2019-09-13 Sold (Public Records) $35,500 Public Records
- 2019-09-06 Sold (MLS) $38,000 NWIAR
- 2019-08-22 Pending — MRED as Distributed by MLS Grid
- 2019-08-19 Listed — MRED as Distributed by MLS Grid
- 2019-08-19 Listed $36,900 NWIAR
- 2017-12-19 Sold (Public Records) $28,900 Public Records
Property tax history
-1.8%/yrLatest (2024): $2,066 · +3.5% YoY. Source: county tax records.
Cash-flow waterfall
monthlySold comps — $/sqft
last 12 mo · ≤1 miLoading sold comps…