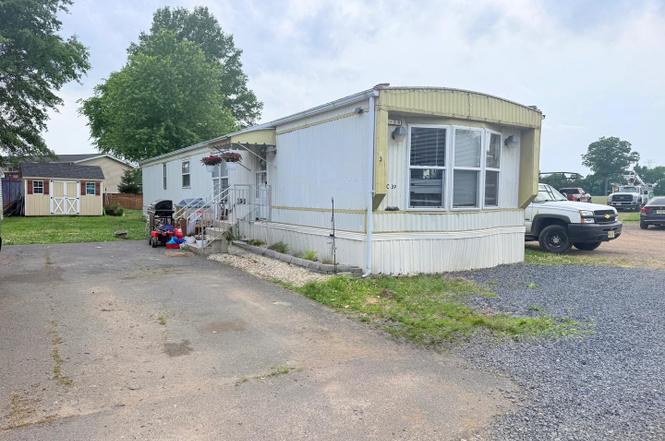
181 Cookstown New Egypt Rd Unit C39 · Cookstown, NJ
Flood risk No data
- FEMA flood zone
- —
- Chance of flooding over 30 yrs
- —
- Est. flood insurance / yr
- —
Fire risk No data
- Est. fire insurance / yr
- —
Heat risk No data
- Hot days now (above threshold)
- —
- Hot days in 30 yrs
- —
Wind risk No data
- Chance of severe wind over 30 yrs
- —
Air-quality risk No data
- Unhealthy air days now
- —
- Unhealthy air days in 30 yrs
- —
Risk factors via First Street. Map © Google.
Why this score? — see what drove the B+ grade
The composite is a weighted blend of 9 inputs, each scored 0–100. Each bar is that input's sub-score; the figure is the points it added to the 100-point composite (weight × sub-score).
- Cash flow +30.0/30.0
- 1% rule +10.0/10.0
- DSCR +10.0/10.0
- Appreciation +8.7/10.0
- ARV discount +7.5/15.0
- Schools +3.9/10.0
- Rent growth +2.5/5.0
- Livability +2.5/5.0
- Condition / age +2.2/5.0
$65,000
🖨 Deal sheet (PDF) 📄 Offer letter ✓ Due diligence
Listing remarks
Why rent when you can own? This affordable 2-bedroom, 1-bath home features a nicely updated bathroom, open floor plan, convenient breakfast nook, and ample kitchen cabinetry. Located toward the back of the community with open space behind the home, it offers a quiet setting and added privacy. While the home could use some cosmetic updates, it is comfortably livable as-is and presents a great affordable option
Key facts
- Breakfast nook
- Open floor plan
- Added privacy
Tags
Property features AI
Finance
- HOA & community: Property manager present
Exterior
- Utilities: Public water; Public sewer; Natural gas hot water
- Home design: Mobile home (pre-1976); Above-grade living space (approximately 800 finished)
- Construction: Aluminum siding
- Exterior features: No tidal water
Interior
- Kitchen: Kitchen (details not provided)
- Bedrooms: 2 bedrooms on the main level; Rooms include: Living Room, Master Bedroom, Kitchen, Bedroom 1
- Bathrooms: 1 full bathroom on the main level
- Heating & cooling: Forced air heating; Propane (owned) for heat; Central air conditioning (electric)
- Interior features: Estimated living area; No basement
- Laundry & utility: Main-floor laundry
Neighborhood map
What this means for you Summary
Snapshot
- This is a 2-bed/1.0-bath manufactured listed at $65k. Condition is rated fair.
Deal economics
- At list price, monthly cash flow is $738 ($9k/yr) — positive.
- The deal already cash-flows at list — no discount required.
- Meets the 1% rule at list price ($2k rent vs $65k).
Location & tenants
- Location reads: area grade B — affects rentability + tenant quality, not the cash-flow math above.
- Northern Burlington County Regional School District (rural): math 27% / reading 57% proficiency, ranked #198 of 472 in NJ (top 42%) — families likely to look elsewhere, expect single-tenant / working-renter base with shorter leases; only 8% free/reduced lunch — higher-income household profile.
- Zoned schools: Clarence B. Lamb Elementary School (math 22% / reading 42%, grade F, #661 of 1,303 statewide, top 54%, 294 students, 32% FRL); Northern Burlington County Regional Middle School (math 27% / reading 56%, grade F, #182 of 431 statewide, top 43%, 703 students, 13% FRL); Northern Burlington County Regional High School (math 27% / reading 58%, grade F, #166 of 399 statewide, top 42%, 1,427 students, 13% FRL).
- Market conditions: 33 active listings in the ZIP; 2,161 units permitted in Burlington County in 2024 (988 in 5+ unit buildings).
Forward outlook
- In year one you build about $5k of equity ($449 loan paydown + $5k appreciation (7.3% local appreciation)).
- Burlington County population projected to shrink 5% by 2050 — rents likely to lag national; underwrite the cash flow, not the appreciation.
- At projected returns (7.3% appreciation + 3.0% rent growth), your $18k cash investment doubles in ~2 years — after that, you're playing with house money.
- By year 7, paydown + projected appreciation supports a ~$35k cash-out refi (75% LTV) — recoverable capital for the next deal without selling this one.
Negotiation context
- Only 6 days on market — expect competitive offers; lowballing is unlikely to land.
Questions for the listing agent
- Have any recent inspections been done? Can we get a copy of the seller's disclosures and any deferred-maintenance estimates?
- Built in 1975 — when were the roof, HVAC, electrical panel, plumbing, and water heater last replaced?
- Is there a deadline driving the sale (1031 exchange, divorce, estate, relocation)? That informs how much negotiation room exists.
- What's the average days-on-market for RENTAL listings here right now (not sales)? A rising rental-DOM trend means longer vacancies and softer asking-rent achievability than the comps imply.
- What's the recent tenant-quality profile in this submarket — average credit score on applications, eviction rate, late-payment / NSF rate, and stable-employment percentage? A property-management company in the area should have these aggregated.
- How much new for-sale + rental construction is in the pipeline within 1–3 miles? Heavy new supply typically softens prices + rents 12–24 months out; constrained supply supports both.
Investment metrics
- 1% rule
- 2.31% ✓
- Cap rate
- 19.91%
- Cash-on-cash
- 48.64%
- DSCR
- 3.16
- GRM
- 3.6
CMA / ARV
No comps found within radius.
Projected returns pro-forma
7.34% appreciation · 3.0% rent growth · sell at horizon
- IRR
- 59.2%
- Equity multiple
- 4.90×
- Total profit
- $71,053
- Equity at exit
- $46,479
- IRR
- 54.9%
- Equity multiple
- 10.41×
- Total profit
- $171,311
- Equity at exit
- $89,622
Cash invested: $18,200 (down + closing). Projections, not guarantees.
Landlord ↔ Tenant lean methodology
- Overall (STATE)
- 21 Tenant-Leaning
- State New Jersey
- 21 Tenant-Leaning · D+6
- County
- — inherits STATE
- City
- — inherits STATE
ZIP-level market 08562
- Home prices YoY
- 2.5%
- Active inventory
- 33
- Price-to-rent
- 3.6×
Monthly cashflow live
- Estimated rent
- $1,502 medium interval (Pro) →
- Mortgage (P&I)
- −$341
- Tax est. 1.5%
- −$81 /mo · $975/yr
- Insurance
- −$27
- HOA
- −$0
- Vacancy / Maint / Mgmt
- −$315
- Net cashflow
- $738
Break-even live
Sensitivity live
| Price | -10% $783 | -5% $760 | +0% $738 | +5% $715 | +10% $693 |
|---|---|---|---|---|---|
| Rent | -10% $619 | -5% $678 | +0% $738 | +5% $797 | +10% $856 |
| Rate | -1.0pp $770 | -0.5pp $754 | base $738 | +0.5pp $721 | +1.0pp $704 |
UW: 25.0% down · 7.5% · 30yr · 1.5% tax · 5.0% vac · 8.0% maint · 8.0% mgmt
Financing live
Cash to close
- Down payment
- $16,250
- Closing costs
- $1,950
- Reserves months
- —
- Total cash needed
- —
Loan-product check · same deal, 3 products live
Conventional
25% down · 7.5% · 30yr
- Down + closing
- —
- Monthly P&I
- —
- Monthly cashflow
- —
- DSCR
- —
- Eligible?
- —
Personal DTI + credit; lowest rate.
DSCR
20% down · 8.5% · 30yr
- Down + closing
- —
- Monthly P&I
- —
- Monthly cashflow
- —
- DSCR
- —
- Eligible?
- —
No personal income docs; deal must DSCR.
Hard money
10% down · 12.0% · 12mo
- Down + closing
- —
- Monthly P&I
- —
- Monthly cashflow
- —
- DSCR
- —
- Eligible?
- —
Short-term bridge; refi at stabilization.
Listing history 6 events
-
2026-06-21days on market $65,000 Active 6 DOM
-
2026-06-21days on market $65,000 Active 5 DOM
-
2026-06-18days on market $65,000 Active 3 DOM
-
2026-06-17days on market $65,000 Active 2 DOM
-
2026-06-16remarks 412-char remark
-
2026-06-16$65,000 Active 1 DOM
ⓘ Source: listings_history table (triggers on properties + properties_extension) + one-shot
backfill from property_details.listing_events for pre-trigger history.
Nearby sold comps map
Loading sold comps map…
Walkable amenities ~0.75 mi
Loading nearby amenities…
Taxation est. · year 1
- Rental income
- $18,028
- − Mortgage interest
- −$3,641
- − Property taxes
- −$975
- − Insurance
- −$325
- − Repairs & maintenance
- −$1,442
- − Management
- −$1,442
- − Depreciation
- −$1,891
- Taxable income
- $8,312
- Est. tax owed @ 24.0%
- −$1,995
- After-tax cash flow
- $6,857/yr
For passive investors: Depreciation is non-cash, so a rental often shows a tax loss while cash-flowing — sheltering income. Rental losses are passive: they offset passive income freely, and up to $25,000/yr can offset ordinary (W-2) income if you actively participate and your MAGI is under $100k (phasing out to $0 by $150k); unused losses carry forward. On sale, claimed depreciation is recaptured at up to 25%, and gains may owe capital-gains tax (a 1031 exchange can defer both). Figures are a year-1 estimate at your 24.0% rate — not tax advice; consult a CPA.
Condition & rehab AI · 12 photos
This mobile home presents as move-in ready with minor cosmetic updates needed to enhance its curb appeal and value.
Repairs flagged
- Minor exterior siding — slight wear
- Minor interior walls — paint appears worn
Value-add opportunities
- Both paint interior walls — enhances curb appeal and interior aesthetics
- Both update exterior siding — improves curb appeal and home value
- Both landscaping — enhances curb appeal and adds value
Renovation cost estimate screening
| Repair item | Severity | Est. cost |
|---|---|---|
| exterior siding · slight wear | Minor | $500–3,000 |
| interior walls · paint appears worn | Minor | $500–3,000 |
| Total estimated repair cost · 2 items | $1,000–6,000 |
Value-add ROI direction
- Both paint interior walls — enhances curb appeal and interior aesthetics ↑
- Both update exterior siding — improves curb appeal and home value ↑
- Both landscaping — enhances curb appeal and adds value ↑
ⓘ Cost ranges are severity-bucket heuristics (US national rule-of-thumb). Get contractor quotes + a written scope before underwriting a rehab budget.
Schools (NCES district)
- District
- Northern Burlington County Regional School District
- NCES district ID
- 3411700
- Math proficiency
- 27% ▼ -22.00%
- Reading proficiency
- 57% ▼ -10.00%
- Median HH income
- $82,110
- Composite
- 39.1/100
- National rank
- #4042
- State rank
- #198 of 472 in NJ
Livability — Cookstown
No livability data for this city. (Only ~50 U.S. cities are tracked.)
Census & demographics
- City population
- 885
- Population (ZIP)
- 4,301
Population outlook (Burlington County) Hauer SSP2
- Today (2025)
- 453,425 people
- By 2030
- 452,359 · -0.2%
- By 2040
- 445,033 · -1.9%
- By 2050
- 431,760 · -4.8%
- By 2075
- 406,277 · -10.4%
- By 2100
- 364,732 · -19.6%
Race, ethnicity, and origin ACS 2023
- Neighborhood character
- Predominantly White (67%)
- Race & ethnicity
- White 67% Two or more races 22% Hispanic / Latino 15% Black 6%
- Hispanic origin (detail)
- Mexican 10% Puerto Rican 2%
- Common ancestry
- Romanian 10% Lithuanian 3% Slovak 2%
- Foreign-born
- 11% · Canada, Jamaica
- Languages at home
- 84% English-only · Spanish 12% Russian/Polish/Slavic 2% Tagalog/Filipino 1%
Political lean MEDSL · Burlington
- 2024 margin
- D (+16.6) · D 57.6% · R 41.0% · Other 1.3%
- 2008→2024 swing
- -2.0pp toward R · 2008: 18.6pp · 2024: 16.6pp
- All cycles
- 2024: D+16.6 2020: D+19.5 2016: D+14.8 2012: D+18.7 2008: D+18.6
Not yet ingested
- Civics
- —
Market trends
- HPI YoY
- ▲ 7.34%
- Current HPI
- 306.1085
- Rent YoY
- —
- Metro
- —
- State GDP YoY
- ▲ 2.05%
- F500 in state
- 34
Industry mix (Fortune 500 HQ in NJ)
| Industry | F500 HQs | Revenue |
|---|---|---|
| Consumer Goods | 3 | $31B |
|
||
| Pharmaceuticals | 2 | $153B |
|
||
| Technology | 2 | $21B |
|
||
| Insurance | 2 | $20B |
|
||
| Healthcare | 2 | $19B |
|
||
| Financial Services | 1 | $70B |
|
||
Price history
1 event — show timeline
- 2026-06-15 Listed $65,000 BRIGHT MLS
Cash-flow waterfall
monthlySold comps — $/sqft
last 12 mo · ≤1 miLoading sold comps…