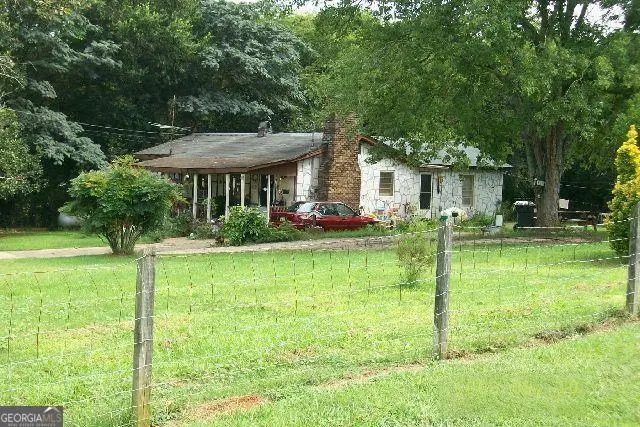
43 Bingham Rd SW · Cartersville, GA
Flood risk 1/10 · Minimal
- FEMA flood zone
- X (unshaded)
- Chance of flooding over 30 yrs
- 0.0%
- Est. flood insurance / yr
- $507 – $1,088
Fire risk 6/10 · Moderate
- Est. fire insurance / yr
- $963 – $1,789
Heat risk 6/10 · Moderate
- Hot days now (above 106°F)
- 7 days/yr
- Hot days in 30 yrs
- 18 days/yr
Wind risk 4/10 · Minor
- Chance of severe wind over 30 yrs
- 19.0%
Air-quality risk 5/10 · Moderate
- Unhealthy air days now
- 6 days/yr
- Unhealthy air days in 30 yrs
- 8 days/yr
Risk factors via First Street. Map © Google.
Why this score? — see what drove the C grade
The composite is a weighted blend of 9 inputs, each scored 0–100. Each bar is that input's sub-score; the figure is the points it added to the 100-point composite (weight × sub-score).
- Cash flow +24.9/30.0
- DSCR +8.1/10.0
- ARV discount +7.5/15.0
- 1% rule +6.5/10.0
- Livability +3.7/5.0
- Schools +2.9/10.0
- Condition / age +2.5/5.0
- Rent growth +2.4/5.0
- Appreciation +0.0/10.0
$145,000
🖨 Deal sheet 📄 Offer letter ✓ Due diligence
Listing remarks
Calling all Investors! This home is a Hidden gem! The property is in a great location but will need alot of TLC! this is a flippers dream ! property is sold as is no sellers disclosure. Estate owned.
Key facts
- 0.5 acre lot
- Built 1930
- Listed 4 days
Property features AI
Finance
- HOA & community: No HOA
Exterior
- Parking: No designated parking
- Utilities: Public water; Septic tank sewer; Cable available
- Home design: Single-family house (residential); One story; Built in 1930; Fixer condition
- Construction: Block construction; Other roof
- Exterior features: Level lot
Interior
- Kitchen: Laundry located in the kitchen
- Bedrooms: 3 bedrooms on the main level
- Flooring: Laminate flooring
- Bathrooms: 1 full bathroom (main level)
- Heating & cooling: Heating present (type: Other); Cooling present (type: Other)
- Interior features: One-level layout; Crawl space basement; Fireplace (1)
- Laundry & utility: In-kitchen laundry
Neighborhood map
What this means for you Summary
Snapshot
- This is a 3-bed/1.0-bath single-family listed at $145k.
Deal economics
- At list price, monthly cash flow is $310 ($4k/yr) — positive.
- The deal already cash-flows at list — no discount required.
- Meets the 1% rule at list price ($2k rent vs $145k).
- Cap rate 8.9% vs local median 3.7% in Cartersville — top-decile yield for the area; either an underpriced asset or a hidden risk that comps aren't pricing in. Stress-test before assuming the spread holds.
Location & tenants
- Location reads 74/100 on livability (#43 in GA, #4,800 nationally) — a middle-class / working-renter tenant base. Strengths: housing A+, health & safety A+, amenities A; Watch: commute F.
- Bartow County (rural): math 33% / reading 34% proficiency, ranked #70 of 174 in GA (top 40%) — families likely to look elsewhere, expect single-tenant / working-renter base with shorter leases.
- Zoned schools: Cass Middle School (math 35% / reading 36%, grade F, #185 of 470 statewide, top 40%, 879 students, 58% FRL); Cass High School (math 17% / reading 25%, grade F, #225 of 424 statewide, top 54%, 1,551 students, 51% FRL) — zoned schools at 54% FRL track the district average.
- Market conditions: Rents soft (-0.2%/yr); 521 active listings in the ZIP; 4 comparable units currently listed for rent nearby; rentals at typical pace (median 17d on market — plan ~3-4 weeks tenant-placement turnaround); solid renter incomes; 1,618 units permitted in Bartow County in 2024 (265 in 5+ unit buildings).
Forward outlook
- Local home prices are declining (-3.0%/yr); year-one equity from $1k of loan paydown is wiped out by about $4k of value loss. Plan a longer hold.
Negotiation context
- Only 4 days on market — expect competitive offers; lowballing is unlikely to land.
Risks & watch-outs
- Watch-outs: built in 1930 — expect roof / HVAC / electrical / plumbing capex.
- Climate carrying-cost: major wildfire risk; extreme-heat days projected 7→18/yr by 2055 (HVAC capex compounding) — expect insurance premiums to compound above CPI over the hold.
Questions for the listing agent
- Built in 1930 — when were the roof, HVAC, electrical panel, plumbing, and water heater last replaced?
- Is there a deadline driving the sale (1031 exchange, divorce, estate, relocation)? That informs how much negotiation room exists.
- Schools are D-rated, which usually means shorter tenancies and higher turnover. Who's the typical renter profile here, and what's been the actual vacancy rate?
- What's the average days-on-market for RENTAL listings here right now (not sales)? A rising rental-DOM trend means longer vacancies and softer asking-rent achievability than the comps imply.
- What's the recent tenant-quality profile in this submarket — average credit score on applications, eviction rate, late-payment / NSF rate, and stable-employment percentage? A property-management company in the area should have these aggregated.
- How much new for-sale + rental construction is in the pipeline within 1–3 miles? Heavy new supply typically softens prices + rents 12–24 months out; constrained supply supports both.
Investment metrics
- 1% rule
- 1.15% ✓
- Cap rate
- 8.86%
- Cash-on-cash
- 9.17%
- DSCR
- 1.41
- GRM
- 7.3
CMA / ARV
No comps found within radius.
Projected returns pro-forma
-3.0% appreciation · 0.0% rent growth · sell at horizon
- IRR
- -5.9%
- Equity multiple
- 0.79×
- Total profit
- $-8,581
- Equity at exit
- $21,620
- IRR
- -0.3%
- Equity multiple
- 0.98×
- Total profit
- $-742
- Equity at exit
- $12,537
Cash invested: $40,600 (down + closing). Projections, not guarantees.
Landlord ↔ Tenant lean methodology
- Overall (STATE)
- 90 Strongly Landlord-Friendly
- State Georgia
- 90 Strongly Landlord-Friendly · R+3
- County
- — inherits STATE
- City
- — inherits STATE
ZIP-level market 30120
- Home prices YoY
- -18.6%
- Rents YoY
- -0.2%
- Active inventory
- 521
- Price-to-rent
- 7.3×
Monthly cashflow live
- Estimated rent
- $1,661 medium interval (Pro) →
- Mortgage (P&I)
- −$760
- Tax est. 1.5%
- −$181 /mo · $2,175/yr
- Insurance
- −$60
- HOA
- −$0
- Vacancy / Maint / Mgmt
- −$349
- Net cashflow
- $310
Break-even live
UW: 25.0% down · 7.5% · 30yr · 1.5% tax · 5.0% vac · 8.0% maint · 8.0% mgmt
Financing live
Cash to close
- Down payment
- $36,250
- Closing costs
- $4,350
- Reserves months
- —
- Total cash needed
- —
Loan-product check · same deal, 3 products live
Conventional
25% down · 7.5% · 30yr
- Down + closing
- —
- Monthly P&I
- —
- Monthly cashflow
- —
- DSCR
- —
- Eligible?
- —
Personal DTI + credit; lowest rate.
DSCR
20% down · 8.5% · 30yr
- Down + closing
- —
- Monthly P&I
- —
- Monthly cashflow
- —
- DSCR
- —
- Eligible?
- —
No personal income docs; deal must DSCR.
Hard money
10% down · 12.0% · 12mo
- Down + closing
- —
- Monthly P&I
- —
- Monthly cashflow
- —
- DSCR
- —
- Eligible?
- —
Short-term bridge; refi at stabilization.
Rent comps 4 comps
| Address | Beds | Baths | Sqft | Rent | $/sqft | DOM | Units | Dist |
|---|---|---|---|---|---|---|---|---|
| 201 Iron Belt Ct Cartersville, GA | 2.0 | 1.5 | 1008 | $1,250 | $1.24 | 1d | 1 | 1.05mi |
| 24 Paige St Unit 1 Cartersville, GA | 2.0 | 1.0 | 992 | $1,150 | $1.16 | 43d | 1 | 1.25mi |
| 28 Paige St Cartersville, GA | 2.0 | 1.0 | 1000 | $1,400 | $1.40 | 16d | 1 | 1.26mi |
| 101 Walker Ridge Ln SW Cartersville, GA | 2.0–3.0 | 2.0–3.0 | 1244 | $2,212 | $1.78 | 1d | 19 | 1.43mi |
Listing history 1 events
-
2026-05-23$145,000 New
ⓘ Source: listings_history table (triggers on properties + properties_extension) + one-shot
backfill from property_details.listing_events for pre-trigger history.
Climate risk First Street
- Flood 1/10 Low FEMA zone X (unshaded) · 0% chance over 30 yrs
- Wildfire 6/10 Major
- Heat 6/10 Major 7 d/yr ≥106°F today · 18 d/yr by 30 yrs out
- Wind 4/10 Moderate 19% chance of damaging wind over 30 yrs
- Air quality 5/10 Major 6 unhealthy d/yr today · 8 by 30 yrs out
Nearby sold comps map
Loading sold comps map…
Walkable amenities ~0.75 mi
Loading nearby amenities…
Taxation est. · year 1
- Rental income
- $19,933
- − Mortgage interest
- −$8,122
- − Property taxes
- −$2,175
- − Insurance
- −$725
- − Repairs & maintenance
- −$1,595
- − Management
- −$1,595
- − Depreciation
- −$4,218
- Taxable income
- $1,504
- Est. tax owed @ 24.0%
- −$361
- After-tax cash flow
- $3,362/yr
For passive investors: Depreciation is non-cash, so a rental often shows a tax loss while cash-flowing — sheltering income. Rental losses are passive: they offset passive income freely, and up to $25,000/yr can offset ordinary (W-2) income if you actively participate and your MAGI is under $100k (phasing out to $0 by $150k); unused losses carry forward. On sale, claimed depreciation is recaptured at up to 25%, and gains may owe capital-gains tax (a 1031 exchange can defer both). Figures are a year-1 estimate at your 24.0% rate — not tax advice; consult a CPA.
Schools (NCES district)
- District
- Bartow County
- NCES district ID
- 1300330
- Math proficiency
- 33% ▼ -8.00%
- Reading proficiency
- 34% ▼ -7.00%
- Median HH income
- $50,596
- Composite
- 29.16/100
- National rank
- #6577
- State rank
- #70 of 174 in GA
Livability — Cartersville
- Score
- 74/100
- State rank
- #43
- US rank
- #4800
Category grades
Schools grade is shown separately in the Schools card above.
Census & demographics
- County
- Bartow County · 85,497 people
- City population
- 70,885
- Metro
- Atlanta-Sandy Springs-Alpharetta, GA
- Population (ZIP)
- 44,896
- Household income
- $86,581
- Rent vs Own
- Severe rent burden
- 987.0
Population outlook (Bartow County) Hauer SSP2
- Today (2025)
- 107,887 people
- By 2030
- 109,594 · +1.6%
- By 2040
- 111,038 · +2.9%
- By 2050
- 109,046 · +1.1%
- By 2075
- 99,484 · -7.8%
- By 2100
- 83,431 · -22.7%
Race, ethnicity, and origin ACS 2023
- Neighborhood character
- Predominantly White (70%)
- Race & ethnicity
- White 70% Black 13% Hispanic / Latino 12% Two or more races 8% Asian 1%
- Hispanic origin (detail)
- Mexican 9%
- Common ancestry
- Slovak 3% Italian 2% Serbian 1%
- Foreign-born
- 5% · Canada, Vietnam, Jamaica
- Languages at home
- 89% English-only · Spanish 9%
Political lean MEDSL · Bartow
- 2024 margin
- Solid R (+51.0) · D 24.2% · R 75.2%
- 2008→2024 swing
- -5.8pp toward R · 2008: -45.2pp · 2024: -51.0pp
- All cycles
- 2024: R+51.0 2020: R+50.7 2016: R+55.2 2012: R+51.7 2008: R+45.2
Not yet ingested
- Civics
- —
Market trends
- HPI YoY
- ▼ -68.99%
- Current HPI
- 302.5848
- Rent YoY
- ▼ -0.23%
- Metro
- Atlanta-Sandy Springs-Alpharetta, GA
- State GDP YoY
- ▲ 2.66%
- F500 in state
- 28
Industry mix (Fortune 500 HQ in GA)
| Industry | F500 HQs | Revenue |
|---|---|---|
| Paper / Packaging | 2 | $29B |
|
||
| Retail | 1 | $160B |
|
||
| Transportation / Logistics | 1 | $91B |
|
||
| Airlines | 1 | $62B |
|
||
| Consumer Goods | 1 | $47B |
|
||
| Utilities | 1 | $25B |
|
||
Price history
1 event — show timeline
- 2026-05-23 Listed $145,000 GAMLS
Property tax history
+0.6%/yrLatest (2025): $144 · -19.2% YoY. Source: county tax records.
Cash-flow waterfall
monthlySold comps — $/sqft
last 12 mo · ≤1 miLoading sold comps…