6301 Warner Ave #54 · Huntington Beach, CA
Flood risk 6/10 · Moderate
- FEMA flood zone
- X
- Chance of flooding over 30 yrs
- 0.9%
- Est. flood insurance / yr
- $507 – $1,088
Fire risk 1/10 · Minimal
- Est. fire insurance / yr
- $659 – $1,223
Heat risk 5/10 · Moderate
- Hot days now (above 85°F)
- 7 days/yr
- Hot days in 30 yrs
- 22 days/yr
Wind risk 1/10 · Minimal
- Chance of severe wind over 30 yrs
- —
Air-quality risk 4/10 · Minor
- Unhealthy air days now
- 5 days/yr
- Unhealthy air days in 30 yrs
- 7 days/yr
Risk factors via First Street. Map © Google.
Why this score? — see what drove the B grade
The composite is a weighted blend of 9 inputs, each scored 0–100. Each bar is that input's sub-score; the figure is the points it added to the 100-point composite (weight × sub-score).
- Cash flow +30.0/30.0
- ARV discount +11.1/15.0
- DSCR +10.0/10.0
- 1% rule +9.0/10.0
- Schools +5.5/10.0
- Livability +3.4/5.0
- Rent growth +2.8/5.0
- Condition / age +2.5/5.0
- Appreciation +0.0/10.0
$269,000
🖨 Deal sheet 📄 Offer letter ✓ Due diligence
Listing remarks
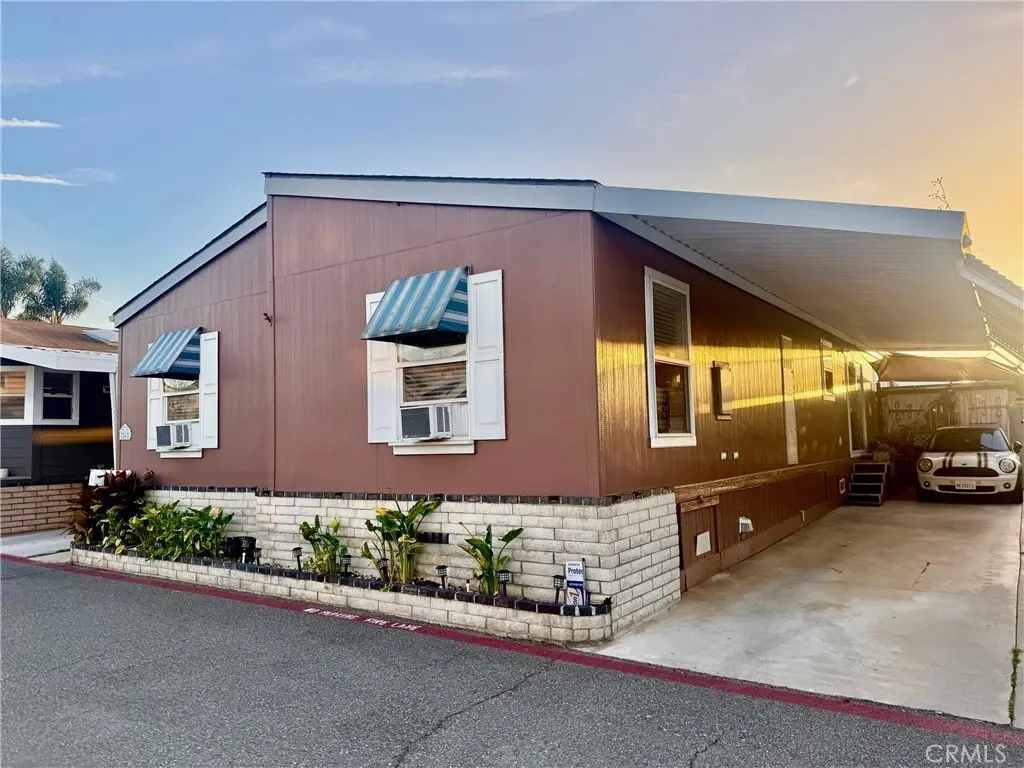
Welcome to Sea Aira space 54, a custom 27’ wide 2005 Champion, located near the community clubhouse, guest parking, dog park, swimming pool and spa. This upgraded home includes drywall interior, vaulted ceilings, dual paned windows, tile flooring, and all appliances. Popular split floor plan offers separate living and family rooms, along with bedrooms on both sides of the home. Outside includes patio with gazebo and parking for 3 cars. Community located only 3 miles to Huntington Harbor and 15 minutes to the Huntington Beach Pier. Walk to local shops and restaurants, bike to the Bolsa Chica Wetlands, and explore Surf City’s year-round family-friendly activities.
Key facts
- Upgraded home
- Dual paned windows
- Tile flooring
Tags
Property features AI
Finance
- Other: Manager approval required for residency; Living area is estimated
- HOA & community: Land lease for the park: $1,999 monthly (park-provided)
Exterior
- Parking: Located in Sea Aira park
- Utilities: Public sewer; District/Public water
- Home design: Single-story mobile home; Mobile model I4563A; Mobile home remains on site; Entry on level 1
- Construction: Built by builder (year built source: Builder); Mobile home dimensions approximately 26 ft by 56 ft; Double body type
- Exterior features: Community pool; Suburban neighborhood
Interior
- Bathrooms: 2 full bathrooms
- Interior features: One-level home; Entry on main level
- Laundry & utility: Laundry inside the home
Neighborhood map
What this means for you Summary
Snapshot
- This is a 3-bed/2.0-bath manufactured listed at $269k.
Deal economics
- At list price, monthly cash flow is $1k ($13k/yr) — positive.
- The deal already cash-flows at list — no discount required.
- Meets the 1% rule at list price ($4k rent vs $269k).
- Recommended offer: $261k (3.0% below list) — sets the bar for market timing.
- Cap rate 11.2% vs local median 1.6% in Huntington Beach — top-decile yield for the area; either an underpriced asset or a hidden risk that comps aren't pricing in. Stress-test before assuming the spread holds.
Location & tenants
- Location reads 67/100 on livability (#306 in CA) — a middle-class / working-renter tenant base. Strengths: employment A+, commute A-, schools B+; Watch: amenities C-, cost of living F, health & safety F.
- Ocean View (suburban): math 57% / reading 63% proficiency, ranked #207 of 1,400 in CA (top 15%) — acceptable for families but not a draw, mixed tenant base, ~2y average lease.
- Market conditions: Rents rising (+1.2%/yr); 75 active listings in the ZIP; 40 comparable units currently listed for rent nearby; rentals leasing fast (median 1d on market — plan ~1-2 weeks tenant-placement turnaround); solid renter incomes; 6,974 units permitted in Orange County in 2024 (3,839 in 5+ unit buildings).
- This rent runs 43% of the median local income ($105k/yr) — at the standard rent-burdened threshold; future hikes will face affordability resistance.
Forward outlook
- Local home prices are declining (-3.0%/yr); year-one equity from $2k of loan paydown is wiped out by about $8k of value loss. Plan a longer hold.
- Orange County population projected at +14% by 2050 — modest demand growth; plan on rents tracking national, not racing it.
- At projected returns (-3.0% appreciation + 1.2% rent growth), your $75k cash investment doubles in ~8 years — after that, you're playing with house money.
Negotiation context
- It's been on market 44 days — a 3% lower offer ($261k) is reasonable based on typical stale-listing flexibility.
Risks & watch-outs
- Climate carrying-cost: major flood risk; extreme-heat days projected 7→22/yr by 2055 (HVAC capex compounding) — expect insurance premiums to compound above CPI over the hold.
Questions for the listing agent
- It's been on market 44 days. Have you received any prior offers? Is the seller open to a 3% concession, seller financing, or rate buy-down credit?
- Is there a deadline driving the sale (1031 exchange, divorce, estate, relocation)? That informs how much negotiation room exists.
- Schools are B-rated — typically a magnet for longer-tenancy family renters. What's the average tenant stay here, and is there a school-zone premium baked into asking?
- What's the average days-on-market for RENTAL listings here right now (not sales)? A rising rental-DOM trend means longer vacancies and softer asking-rent achievability than the comps imply.
- What's the recent tenant-quality profile in this submarket — average credit score on applications, eviction rate, late-payment / NSF rate, and stable-employment percentage? A property-management company in the area should have these aggregated.
- How much new for-sale + rental construction is in the pipeline within 1–3 miles? Heavy new supply typically softens prices + rents 12–24 months out; constrained supply supports both.
Investment metrics
- 1% rule
- 1.40% ✓
- Cap rate
- 11.23%
- Cash-on-cash
- 17.62%
- DSCR
- 1.78
- GRM
- 6.0
CMA / ARV
- ARV (on-the-fly)
- $292,656
- Comps found
- 3
Show comp detail 3 sales within ~0.75 mi
| Address | Dist | Beds/Ba | Sqft | Sold | Price | $/sf | Match |
|---|---|---|---|---|---|---|---|
| 6241 Warner Ave #120 | 0.24mi | 3/2.0 | 1,512 (+4%) | 10mo | $349,000 | $231 | 74 |
| 6241 Warner Ave #108 | 0.24mi | 3/2.0 | 1,344 (-8%) | 8mo | $270,000 | $201 | 69 |
| 6301 Warner Ave #5 | 0.00mi | 3/2.0 | 1,248 (-14%) | 24mo | $235,000 | $188 | 56 |
Match score weights: distance 35% · size 25% · config 20% · recency 20%. Top-matched comps best support the ARV.
Projected returns pro-forma
-3.0% appreciation · 1.2% rent growth · sell at horizon
- IRR
- 7.0%
- Equity multiple
- 1.27×
- Total profit
- $20,226
- Equity at exit
- $40,109
- IRR
- 14.7%
- Equity multiple
- 2.09×
- Total profit
- $82,114
- Equity at exit
- $23,258
Cash invested: $75,320 (down + closing). Projections, not guarantees.
Landlord ↔ Tenant lean methodology
- Overall (STATE)
- 18 Strongly Tenant-Friendly
- State California
- 18 Strongly Tenant-Friendly · D+13
- County
- — inherits STATE
- City
- — inherits STATE
ZIP-level market 92647
- Rents YoY
- 1.2%
- Active inventory
- 75
- Price-to-rent
- 6.0×
Monthly cashflow live
- Estimated rent
- $3,753 high interval (Pro) →
- Mortgage (P&I)
- −$1,411
- Tax est. 1.5%
- −$336 /mo · $4,035/yr
- Insurance
- −$112
- HOA
- −$0
- Vacancy / Maint / Mgmt
- −$788
- Net cashflow
- $1,106
Break-even live
UW: 25.0% down · 7.5% · 30yr · 1.5% tax · 5.0% vac · 8.0% maint · 8.0% mgmt
Financing live
Cash to close
- Down payment
- $67,250
- Closing costs
- $8,070
- Reserves months
- —
- Total cash needed
- —
Loan-product check · same deal, 3 products live
Conventional
25% down · 7.5% · 30yr
- Down + closing
- —
- Monthly P&I
- —
- Monthly cashflow
- —
- DSCR
- —
- Eligible?
- —
Personal DTI + credit; lowest rate.
DSCR
20% down · 8.5% · 30yr
- Down + closing
- —
- Monthly P&I
- —
- Monthly cashflow
- —
- DSCR
- —
- Eligible?
- —
No personal income docs; deal must DSCR.
Hard money
10% down · 12.0% · 12mo
- Down + closing
- —
- Monthly P&I
- —
- Monthly cashflow
- —
- DSCR
- —
- Eligible?
- —
Short-term bridge; refi at stabilization.
Rent comps 40 comps
| Address | Beds | Baths | Sqft | Rent | $/sqft | DOM | Units | Dist |
|---|---|---|---|---|---|---|---|---|
| 6401 Warner Ave Huntington Beach, CA | 2.0–3.0 | 1.0–2.5 | 1145 | $4,196 | $3.66 | 1d | 16 | 0.11mi |
| 6242 Warner Ave Huntington Beach, CA | 1.0–2.0 | 1.0–2.0 | 830 | $2,925 | $3.52 | 1d | 12 | 0.12mi |
| 6700 Warner Ave Huntington Beach, CA | 2.0 | 1.0–2.0 | 875 | $3,260 | $3.73 | 1d | 1 | 0.37mi |
| 6762 Warner Ave Huntington Beach, CA | 2.0 | 1.5 | 920 | $2,750 | $2.99 | 1d | 6 | 0.46mi |
| 5902 Nordina Dr Huntington Beach, CA | 4.0 | 2.5 | 1840 | $5,000 | $2.72 | 10d | 1 | 0.66mi |
| 6922 Paula Cir Huntington Beach, CA | 4.0 | 2.0 | 1635 | $5,799 | $3.55 | 1d | 1 | 0.66mi |
| 5832 Nordina Dr Huntington Beach, CA | 3.0 | 2.0 | 1171 | $4,399 | $3.76 | 1d | 1 | 0.71mi |
| 16722 Goldenwest St #1 Huntington Beach, CA | 3.0 | 2.0 | 1250 | $3,650 | $2.92 | 1d | 1 | 0.72mi |
| 5952 Par Cir Huntington Beach, CA | 3.0 | 2.0 | 1437 | $5,400 | $3.76 | 13d | 1 | 0.73mi |
| 16682 Goldenwest St Unit 2 Huntington Beach, CA | 2.0 | 2.0 | 900 | $2,800 | $3.11 | 1d | 1 | 0.73mi |
| 16652 Goldenwest St Huntington Beach, CA | 2.0 | 1.5 | 1200 | $2,600 | $2.17 | 10d | 1 | 0.74mi |
| 16652 Goldenwest St Apt 3 Huntington Beach, CA | 2.0 | 1.5 | 1200 | $2,600 | $2.17 | 1d | 1 | 0.74mi |
| 5641 Tilburg Dr Huntington Beach, CA | 3.0 | 2.0 | 1188 | $4,495 | $3.78 | 1d | 1 | 0.76mi |
| 16612 Bartlett Ln Unit 4 Huntington Beach, CA | 2.0 | 1.0 | 1000 | $2,600 | $2.60 | 18d | 1 | 0.81mi |
| 6281 Reubens Dr Huntington Beach, CA | 4.0 | 2.0 | 1820 | $4,895 | $2.69 | 1d | 1 | 0.83mi |
| 6281 Reubens Dr Huntington Beach, CA | 4.0 | 2.0 | 1820 | $4,895 | $2.69 | 10d | 1 | 0.83mi |
| 7082 Heil Ave #1 Huntington Beach, CA | 3.0 | 2.0 | 1438 | $3,500 | $2.43 | 1d | 1 | 0.86mi |
| 16862 Coach Ln Huntington Beach, CA | 2.0 | 1.0 | 1000 | $3,500 | $3.50 | 1d | 1 | 0.86mi |
| 16531 Kellog Cir Unit 1 Huntington Beach, CA | 3.0 | 2.0 | 1422 | $3,650 | $2.57 | 1d | 1 | 0.87mi |
| 6100 Edinger Ave Unit 509 Huntington Beach, CA | 2.0 | 2.0 | 950 | $3,500 | $3.68 | 3d | 1 | 0.90mi |
| 6200 Edinger Ave Huntington Beach, CA | 1.0–3.0 | 1.0–2.0 | 851 | $3,462 | $4.07 | 1d | 4 | 0.91mi |
| 6100 Edinger Ave Apt 602 Huntington Beach, CA | 2.0 | 2.0 | 950 | $2,800 | $2.95 | 1d | 1 | 0.92mi |
| 7261 La Mancha Cir Unit C Huntington Beach, CA | 2.0 | 2.0 | 921 | $2,500 | $2.71 | 21d | 1 | 0.96mi |
| 16781 Bardon Ln Unit A Huntington Beach, CA | 3.0 | 2.0 | 1300 | $3,195 | $2.46 | 7d | 1 | 1.00mi |
| 5681 Mangrum Dr Huntington Beach, CA | 3.0 | 2.0 | 1132 | $4,995 | $4.41 | 1d | 1 | 1.09mi |
| 6002 Welde Cir Huntington Beach, CA | 3.0 | 2.0 | 1284 | $3,650 | $2.84 | 10d | 1 | 1.16mi |
| 7581 Warner Ave Unit B Huntington Beach, CA | 3.0 | 2.0 | 1305 | $3,400 | $2.61 | 1d | 1 | 1.26mi |
| 16795 Roosevelt Ln Unit C Huntington Beach, CA | 3.0 | 2.0 | 1600 | $3,900 | $2.44 | 1d | 1 | 1.28mi |
| 7290 Edinger Ave Huntington Beach, CA | 1.0–2.0 | 1.0–2.0 | 941 | $3,824 | $4.06 | 1d | 19 | 1.30mi |
| 6042 Stone Cir Huntington Beach, CA | 4.0 | 2.0 | 1434 | $4,995 | $3.48 | 1d | 1 | 1.35mi |
| 17092 Emerald Ln Unit 4 Huntington Beach, CA | 3.0 | 2.0 | 1200 | $3,595 | $3.00 | 1d | 1 | 1.37mi |
| 17092 Emerald Ln Unit 4 Huntington Beach, CA | 3.0 | 2.0 | 1200 | $3,595 | $3.00 | 24d | 1 | 1.37mi |
| 17092 Emerald Ln Huntington Beach, CA | 3.0 | 2.0 | 1200 | $3,595 | $3.00 | 10d | 1 | 1.37mi |
| 17102 Emerald Ln Huntington Beach, CA | 3.0 | 2.0 | 1200 | $3,495 | $2.91 | 10d | 1 | 1.37mi |
| 17102 Emerald Ln Unit D Huntington Beach, CA | 3.0 | 2.0 | 1200 | $3,495 | $2.91 | 24d | 1 | 1.37mi |
| 17102 Emerald Ln Unit 4 Huntington Beach, CA | 3.0 | 2.0 | 1200 | $3,495 | $2.91 | 1d | 1 | 1.37mi |
| 7268 Ellington Huntington Beach, CA | 4.0 | 2.5 | 1629 | $4,800 | $2.95 | 2d | 1 | 1.38mi |
| 16082 Schryer Ln Huntington Beach, CA | 3.0 | 2.0 | 1214 | $8,000 | $6.59 | 2d | 1 | 1.38mi |
| 7267 Aura Cir Huntington Beach, CA | 3.0 | 2.5 | 1389 | $4,500 | $3.24 | 1d | 1 | 1.39mi |
| 16592 Jib Cir Unit B Huntington Beach, CA | 3.0 | 2.5 | 1500 | $4,300 | $2.87 | 1d | 1 | 1.41mi |
Listing history 16 events
-
2026-06-18days on market $269,000 Active 44 DOM
-
2026-06-17days on market $269,000 Active 43 DOM
-
2026-06-16days on market $269,000 Active 42 DOM
-
2026-06-15days on market $269,000 Active 41 DOM
-
2026-06-13days on market $269,000 Active 39 DOM
-
2026-06-13days on market $269,000 Active 38 DOM
-
2026-06-10days on market $269,000 Active 36 DOM
-
2026-06-09days on market $269,000 Active 35 DOM
-
2026-06-08days on market $269,000 Active 34 DOM
-
2026-06-07days on market $269,000 Active 33 DOM
-
2026-06-04days on market $269,000 Active 30 DOM
-
2026-06-03days on market $269,000 Active 29 DOM
-
2026-06-02days on market $269,000 Active 28 DOM
-
2026-06-01days on market $269,000 Active 27 DOM
-
2026-05-31days on market $269,000 Active 26 DOM
-
2026-05-05$269,000 Active
ⓘ Source: listings_history table (triggers on properties + properties_extension) + one-shot
backfill from property_details.listing_events for pre-trigger history.
Climate risk First Street
- Flood 6/10 Major FEMA zone X · 90% chance over 30 yrs
- Wildfire 1/10 Low
- Heat 5/10 Major 7 d/yr ≥85°F today · 22 d/yr by 30 yrs out
- Wind 1/10 Low
- Air quality 4/10 Moderate 5 unhealthy d/yr today · 7 by 30 yrs out
Nearby sold comps map
Loading sold comps map…
Walkable amenities ~0.75 mi
Loading nearby amenities…
Taxation est. · year 1
- Rental income
- $45,037
- − Mortgage interest
- −$15,068
- − Property taxes
- −$4,035
- − Insurance
- −$1,345
- − Repairs & maintenance
- −$3,603
- − Management
- −$3,603
- − Depreciation
- −$7,825
- Taxable income
- $9,557
- Est. tax owed @ 24.0%
- −$2,294
- After-tax cash flow
- $10,977/yr
For passive investors: Depreciation is non-cash, so a rental often shows a tax loss while cash-flowing — sheltering income. Rental losses are passive: they offset passive income freely, and up to $25,000/yr can offset ordinary (W-2) income if you actively participate and your MAGI is under $100k (phasing out to $0 by $150k); unused losses carry forward. On sale, claimed depreciation is recaptured at up to 25%, and gains may owe capital-gains tax (a 1031 exchange can defer both). Figures are a year-1 estimate at your 24.0% rate — not tax advice; consult a CPA.
Schools (NCES district)
- District
- Ocean View
- NCES district ID
- 0628140
- Math proficiency
- 57% ▬ 0.00%
- Reading proficiency
- 63% ▼ -1.00%
- Median HH income
- $77,469
- Composite
- 55.3/100
- National rank
- #2725
- State rank
- #207 of 1400 in CA
Livability — Huntington Beach
- Score
- 67/100
- State rank
- #306
- US rank
- #10298
Category grades
Schools grade is shown separately in the Schools card above.
Census & demographics
- Census place
- Huntington Beach, CA
- County
- Orange County · 3,096,323 people
- City population
- 194,835
- Metro
- Los Angeles-Long Beach-Anaheim, CA
- Population (ZIP)
- 59,047
- Household income
- $105,110
- Rent vs Own
- Severe rent burden
- 3065.0
Population outlook (Orange County) Hauer SSP2
- Today (2025)
- 3,477,456 people
- By 2030
- 3,613,117 · +3.9%
- By 2040
- 3,835,945 · +10.3%
- By 2050
- 3,968,736 · +14.1%
- By 2075
- 4,097,053 · +17.8%
- By 2100
- 3,903,633 · +12.3%
Race, ethnicity, and origin ACS 2023
- Neighborhood character
- Diverse neighborhood (Simpson 0.66)
- Race & ethnicity
- White 50% Hispanic / Latino 27% Two or more races 15% Asian 14% Black 2%
- Hispanic origin (detail)
- Mexican 22%
- Common ancestry
- Lithuanian 3% Italian 2% Romanian 2%
- Foreign-born
- 21% · Canada, Vietnam, China
- Languages at home
- 68% English-only · Spanish 15% Vietnamese 6% Other Indo-European 3%
Political lean MEDSL · Orange
- 2024 margin
- Toss-up / Even · D 49.7% · R 47.1% · Other 3.2%
- 2008→2024 swing
- +5.2pp toward D · 2008: -2.6pp · 2024: 2.6pp
- All cycles
- 2024: D+2.6 2020: D+9.0 2016: D+7.7 2012: R+8.3 2008: R+2.6
Not yet ingested
- Civics
- —
Market trends
- HPI YoY
- ▼ -1044.38%
- Current HPI
- 401.8266
- Rent YoY
- ▲ 1.20%
- Metro
- Los Angeles-Long Beach-Anaheim, CA
- State GDP YoY
- ▲ 3.21%
- F500 in state
- 116
Industry mix (Fortune 500 HQ in CA)
| Industry | F500 HQs | Revenue |
|---|---|---|
| Technology | 27 | $1,492B |
|
||
| Financial Services | 3 | $174B |
|
||
| Retail | 3 | $44B |
|
||
| Insurance | 3 | $26B |
|
||
| Media / Entertainment | 2 | $115B |
|
||
| Pharmaceuticals / Biotech | 2 | $62B |
|
||
Price history
1 event — show timeline
- 2026-05-05 Listed $269,000 CRMLS
Property tax history
-5.0%/yrLatest (2025): $401 · -0.3% YoY. Source: county tax records.
Cash-flow waterfall
monthlySold comps — $/sqft
last 12 mo · ≤1 miLoading sold comps…