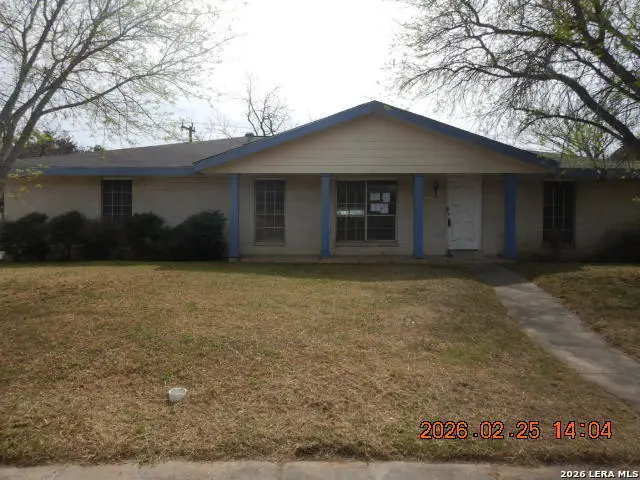
4634 Kay Ann Dr · San Antonio, TX
Flood risk 1/10 · Minimal
- FEMA flood zone
- X (unshaded)
- Chance of flooding over 30 yrs
- 0.0%
- Est. flood insurance / yr
- $507 – $1,088
Fire risk 3/10 · Minor
- Est. fire insurance / yr
- $1,222 – $2,270
Heat risk 8/10 · Major
- Hot days now (above 108°F)
- 7 days/yr
- Hot days in 30 yrs
- 23 days/yr
Wind risk 8/10 · Major
- Chance of severe wind over 30 yrs
- 80.0%
Air-quality risk 2/10 · Minimal
- Unhealthy air days now
- 0 days/yr
- Unhealthy air days in 30 yrs
- 2 days/yr
Risk factors via First Street. Map © Google.
Why this score? — see what drove the B- grade
The composite is a weighted blend of 9 inputs, each scored 0–100. Each bar is that input's sub-score; the figure is the points it added to the 100-point composite (weight × sub-score).
- Cash flow +19.1/30.0
- ARV discount +15.0/15.0
- Appreciation +10.0/10.0
- 1% rule +7.9/10.0
- DSCR +6.0/10.0
- Livability +4.0/5.0
- Rent growth +2.6/5.0
- Condition / age +2.5/5.0
- Schools +1.4/10.0
$135,000
🖨 Deal sheet (PDF) 📄 Offer letter ✓ Due diligence
Listing remarks MLS
Looking for a project? Wait no more. Come see this 4-bedroom 3-bath house with attached 2-car side entry garage on nice corner lot. Easy access to everything from this good location in town. Come and give it tour personal touches and turn it back into the true gem it can be.
Key facts
- 8,319 sq ft lot
- 2 garage spots
- Built 1969
Neighborhood map
What this means for you Summary
Snapshot
- This is a 4-bed/2.0-bath single-family listed at $135k.
Deal economics
- At list price, monthly cash flow is $144 ($2k/yr) — positive.
- The deal already cash-flows at list — no discount required.
- Meets the 1% rule at list price ($2k rent vs $135k).
- Recommended offer: $123k (9.0% below list) — sets the bar for market timing.
- Cap rate 7.6% vs local median 3.8% in San Antonio — top-decile yield for the area; either an underpriced asset or a hidden risk that comps aren't pricing in. Stress-test before assuming the spread holds.
Location & tenants
- Location reads 80/100 on livability (#31 in TX, #1,616 nationally) — a professional / high-income tenant draw. Strengths: amenities A+, commute A+, cost of living A+; Watch: crime F.
- San Antonio ISD (urban): math 12% / reading 22% proficiency, ranked #805 of 826 in TX (top 98%) — low school quality limits family demand, transient renter base, plan for 1-2y turnover; 80% free/reduced lunch — lower-income household profile, screen leases tightly.
- Zoned schools: Hirsch El (math 10% / reading 16%, grade F, #4,152 of 4,322 statewide, top 96%, 533 students, 95% FRL); Davis Middle (math 5% / reading 15%, grade F, #1,641 of 1,662 statewide, top 99%, 545 students, 96% FRL, charter); Houston H S (math 12% / reading 18%, grade F, #1,507 of 1,632 statewide, top 93%, 856 students, 95% FRL) — zoned schools average 95% FRL vs 80% district-wide (16 pts higher); higher-poverty schools than district average — tighter screening recommended.
- Market conditions: Rents flat; 115 active listings in the ZIP; 6 comparable units currently listed for rent nearby; rentals at typical pace (median 21d on market — plan ~3-4 weeks tenant-placement turnaround); lower-income renter base — watch delinquency; 8,308 units permitted in Bexar County in 2024 (2,506 in 5+ unit buildings).
Forward outlook
- In year one you build about $14k of equity ($933 loan paydown + $14k appreciation (10.0% local appreciation)).
- Bexar County population projected at +50% by 2050 — long-run rental-demand tailwind backs the buy-and-hold thesis.
- At projected returns (10.0% appreciation + 0.5% rent growth), your $38k cash investment doubles in ~3 years — after that, you're playing with house money.
- By year 3, paydown + projected appreciation supports a ~$37k cash-out refi (75% LTV) — recoverable capital for the next deal without selling this one.
Negotiation context
- It's been on market 93 days — a 9% lower offer ($123k) is reasonable based on typical stale-listing flexibility.
- 7 sale attempts since 16y ago; this cycle's ask has dropped $10k (7%) from the opening price — seller is motivated, your offer sets the floor, not the list.
Risks & watch-outs
- Watch-outs: property tax is 4.1% of price.
- Climate carrying-cost: severe wind risk, 80% chance of damaging wind over 30y; extreme-heat days projected 7→23/yr by 2055 (HVAC capex compounding) — expect insurance premiums to compound above CPI over the hold.
Questions for the listing agent
- It's been on market 93 days. Have you received any prior offers? Is the seller open to a 9% concession, seller financing, or rate buy-down credit?
- Built in 1969 — when were the roof, HVAC, electrical panel, plumbing, and water heater last replaced?
- Property tax is high relative to price — has the assessment been appealed recently, and will the sale trigger a re-assessment?
- Why hasn't it sold? Are there any deal-killer items the seller is aware of (foundation, flood, title, zoning, code violations)?
- Is there a deadline driving the sale (1031 exchange, divorce, estate, relocation)? That informs how much negotiation room exists.
- Crime grade is F in this area — have there been break-ins, vandalism, or insurance claims at this property in the last 3 years? What carrier currently insures it and at what premium?
- What's the average days-on-market for RENTAL listings here right now (not sales)? A rising rental-DOM trend means longer vacancies and softer asking-rent achievability than the comps imply.
- What's the recent tenant-quality profile in this submarket — average credit score on applications, eviction rate, late-payment / NSF rate, and stable-employment percentage? A property-management company in the area should have these aggregated.
- How much new for-sale + rental construction is in the pipeline within 1–3 miles? Heavy new supply typically softens prices + rents 12–24 months out; constrained supply supports both.
Investment metrics
- 1% rule
- 1.29% ✓
- Cap rate
- 7.57%
- Cash-on-cash
- 4.57%
- DSCR
- 1.20
- GRM
- 6.5
CMA / ARV
- ARV (median comp)
- $223,669
- List price
- $135,000
- Delta
- -39.64%
- Verdict
- UNDERPRICED
- Comps
- 20 within 1.0 mi
Show comp detail 6 sales within ~0.75 mi
| Address | Dist | Beds/Ba | Sqft | Sold | Price | $/sf | Match |
|---|---|---|---|---|---|---|---|
| 257 Glenoak | 0.54mi | 4/2.0 | 2,011 (-6%) | 7mo | $199,950 | $99 | 60 |
| 4220 Eulalee | 0.64mi | 4/2.0 | 1,995 (-6%) | 3mo | $174,900 | $88 | 57 |
| 531 Susanwood Dr | 0.14mi | 3/2.0 (-1) | 2,445 (+15%) | 9mo | $240,000 | $98 | 56 |
| 8453 Frostwood | 0.57mi | 4/2.5 | 2,334 (+10%) | 1mo | $345,720 | $148 | 55 |
| 351 Astoria | 0.75mi | 3/2.5 (-1) | 2,067 (-3%) | 6mo | $140,000 | $68 | 48 |
| 214 Glenoak Dr | 0.56mi | 4/2.5 | 2,330 (+9%) | 12mo | $375,500 | $161 | 46 |
Match score weights: distance 35% · size 25% · config 20% · recency 20%. Top-matched comps best support the ARV.
Projected returns pro-forma
10.0% appreciation · 0.53% rent growth · sell at horizon
- IRR
- 26.5%
- Equity multiple
- 3.08×
- Total profit
- $78,685
- Equity at exit
- $121,619
- IRR
- 22.4%
- Equity multiple
- 6.75×
- Total profit
- $217,197
- Equity at exit
- $262,275
Cash invested: $37,800 (down + closing). Projections, not guarantees.
Landlord ↔ Tenant lean methodology
- Overall (STATE)
- 87 Strongly Landlord-Friendly
- State Texas
- 87 Strongly Landlord-Friendly · R+5
- County
- — inherits STATE
- City
- — inherits STATE
ZIP-level market 78220
- Home prices YoY
- 9.1%
- Rents YoY
- 0.5%
- Active inventory
- 115
- Price-to-rent
- 6.5×
Monthly cashflow live
- Estimated rent
- $1,738 high interval (Pro) →
- Mortgage (P&I)
- −$708
- Tax from tax record
- −$465 /mo · $5,583/yr
- Insurance
- −$56
- HOA
- −$0
- Lot rent
- −$0
- Vacancy / Maint / Mgmt
- −$365
- Net cashflow
- $144
Break-even live
Sensitivity live
| Price | -10% $220 | -5% $182 | +0% $144 | +5% $106 | +10% $68 |
|---|---|---|---|---|---|
| Rent | -10% $7 | -5% $75 | +0% $144 | +5% $213 | +10% $281 |
| Rate | -1.0pp $212 | -0.5pp $178 | base $144 | +0.5pp $109 | +1.0pp $73 |
UW: 25.0% down · 7.5% · 30yr · 1.5% tax · 5.0% vac · 8.0% maint · 8.0% mgmt
Financing live
Cash to close
- Down payment
- $33,750
- Closing costs
- $4,050
- Reserves months
- —
- Total cash needed
- —
Loan-product check · same deal, 3 products live
Conventional
25% down · 7.5% · 30yr
- Down + closing
- —
- Monthly P&I
- —
- Monthly cashflow
- —
- DSCR
- —
- Eligible?
- —
Personal DTI + credit; lowest rate.
DSCR
20% down · 8.5% · 30yr
- Down + closing
- —
- Monthly P&I
- —
- Monthly cashflow
- —
- DSCR
- —
- Eligible?
- —
No personal income docs; deal must DSCR.
Hard money
10% down · 12.0% · 12mo
- Down + closing
- —
- Monthly P&I
- —
- Monthly cashflow
- —
- DSCR
- —
- Eligible?
- —
Short-term bridge; refi at stabilization.
Rent comps 6 comps
| Address | Beds | Baths | Sqft | Rent | $/sqft | DOM | Units | Dist |
|---|---|---|---|---|---|---|---|---|
| 319 Charcliff Dr San Antonio, TX | 3.0 | 2.0 | 1890 | $1,495 | $0.79 | 47d | 1 | 0.53mi |
| 1415 Semlinger Rd San Antonio, TX | 3.0 | 2.0 | 1508 | $1,850 | $1.23 | 16d | 1 | 0.90mi |
| 5026 Benham Dr San Antonio, TX | 4.0 | 1.0 | 1700 | $1,750 | $1.03 | 21d | 1 | 0.96mi |
| 231 Noblewood Dr San Antonio, TX | 1.0–4.0 | 1.0–2.0 | 1084 | $1,605 | $1.48 | 2d | 1 | 1.09mi |
| 2027 Leesburg St San Antonio, TX | 3.0 | 2.0 | 1506 | $1,545 | $1.03 | 47d | 1 | 1.29mi |
| 2027 Leesburg St San Antonio, TX | 3.0 | 2.0 | 1506 | $1,545 | $1.03 | 0d | 1 | 1.29mi |
Listing history 29 events
-
2026-06-07statusdays on market $135,000 Pending 93 DOM
-
2026-06-04days on market $135,000 Active Option 92 DOM
-
2026-06-03days on market $135,000 Active Option 91 DOM
-
2026-06-02days on market $135,000 Active Option 90 DOM
-
2026-06-01days on market $135,000 Active Option 89 DOM
-
2026-05-31days on market $135,000 Active Option 88 DOM
-
2026-04-24status Back on Market 275-char remark
Show marketing remark (275 chars)
Looking for a project? Wait no more. Come see this 4-bedroom 3-bath house with attached 2-car side entry garage on nice corner lot. Easy access to everything from this good location in town. Come and give it tour personal touches and turn it back into the true gem it can be.
-
2026-04-15historical Active Option 275-char remark
Show marketing remark (275 chars)
Looking for a project? Wait no more. Come see this 4-bedroom 3-bath house with attached 2-car side entry garage on nice corner lot. Easy access to everything from this good location in town. Come and give it tour personal touches and turn it back into the true gem it can be.
-
2026-04-03price $135,000 275-char remark
Show marketing remark (275 chars)
Looking for a project? Wait no more. Come see this 4-bedroom 3-bath house with attached 2-car side entry garage on nice corner lot. Easy access to everything from this good location in town. Come and give it tour personal touches and turn it back into the true gem it can be.
-
2026-03-04$145,000 New 275-char remark
Show marketing remark (275 chars)
Looking for a project? Wait no more. Come see this 4-bedroom 3-bath house with attached 2-car side entry garage on nice corner lot. Easy access to everything from this good location in town. Come and give it tour personal touches and turn it back into the true gem it can be.
-
2022-04-18soldstatus
-
2022-03-30soldstatus Sold 128-char remark
Show marketing remark (128 chars)
This San Antonio one-story corner home offers a two-car garage. This home has been virtually staged to illustrate its potential.
-
2022-01-25status Pending 128-char remark
Show marketing remark (128 chars)
This San Antonio one-story corner home offers a two-car garage. This home has been virtually staged to illustrate its potential.
-
2021-11-09$227,000 New 128-char remark
Show marketing remark (128 chars)
This San Antonio one-story corner home offers a two-car garage. This home has been virtually staged to illustrate its potential.
-
2021-10-27soldstatus
-
2021-08-20soldstatus
-
2014-04-14soldstatus
-
2014-04-11soldstatus Sold
-
2014-03-17status Pending
-
2014-03-01historical Active Option
-
2014-02-12status Back on Market
-
2014-01-30historical Active Option
-
2013-11-28$115,000 New
-
2011-02-07soldstatus
-
2011-01-27soldstatus
-
2011-01-21historical
-
2010-11-19$64,900
-
2010-11-18historical
-
2010-02-24$80,000
ⓘ Source: listings_history table (triggers on properties + properties_extension) + one-shot
backfill from property_details.listing_events for pre-trigger history.
Tax reassessment forecast TX · Resets to sale price
- Current annual tax
- $5,583 · $465/mo
- Projected year-2 tax
- $5,583 · $465/mo
- Expected delta
- $0/yr ($0/mo · 0.0%)
ⓘ Screening estimate from a state-policy table — verify with the county assessor before closing.
Climate risk First Street
- Flood 1/10 Low FEMA zone X (unshaded) · 0% chance over 30 yrs
- Wildfire 3/10 Moderate
- Heat 8/10 Severe 7 d/yr ≥108°F today · 23 d/yr by 30 yrs out
- Wind 8/10 Severe 80% chance of damaging wind over 30 yrs
- Air quality 2/10 Low 0 unhealthy d/yr today · 2 by 30 yrs out
Nearby sold comps map
Loading sold comps map…
Walkable amenities ~0.75 mi
Loading nearby amenities…
Taxation est. · year 1
- Rental income
- $20,862
- − Mortgage interest
- −$7,562
- − Property taxes
- −$5,583
- − Insurance
- −$675
- − Repairs & maintenance
- −$1,669
- − Management
- −$1,669
- − Depreciation
- −$3,927
- Taxable loss
- −$223
- Est. tax savings @ 24.0%
- +$54
- After-tax cash flow
- $1,781/yr
For passive investors: Depreciation is non-cash, so a rental often shows a tax loss while cash-flowing — sheltering income. Rental losses are passive: they offset passive income freely, and up to $25,000/yr can offset ordinary (W-2) income if you actively participate and your MAGI is under $100k (phasing out to $0 by $150k); unused losses carry forward. On sale, claimed depreciation is recaptured at up to 25%, and gains may owe capital-gains tax (a 1031 exchange can defer both). Figures are a year-1 estimate at your 24.0% rate — not tax advice; consult a CPA.
Schools (NCES district)
- District
- San Antonio ISD
- NCES district ID
- 4838730
- Math proficiency
- 12% ▼ -21.00%
- Reading proficiency
- 22% ▼ -7.00%
- Median HH income
- $30,952
- Composite
- 13.57/100
- National rank
- #9512
- State rank
- #805 of 826 in TX
Livability — San Antonio
- Score
- 80/100
- State rank
- #31
- US rank
- #1616
Category grades
Schools grade is shown separately in the Schools card above.
Census & demographics
- Census place
- San Antonio, TX
- County
- Bexar County · 1,990,555 people
- City population
- 1,806,925
- Metro
- San Antonio-New Braunfels, TX
- Population (ZIP)
- 19,423
- Household income
- $41,710
- Rent vs Own
- Severe rent burden
- 705.0
Population outlook (Bexar County) Hauer SSP2
- Today (2025)
- 2,336,851 people
- By 2030
- 2,560,728 · +9.6%
- By 2040
- 3,020,569 · +29.3%
- By 2050
- 3,493,522 · +49.5%
- By 2075
- 4,668,459 · +99.8%
- By 2100
- 5,533,242 · +136.8%
Race, ethnicity, and origin ACS 2023
- Neighborhood character
- Majority Hispanic (60%)
- Race & ethnicity
- Hispanic / Latino 60% Black 30% Two or more races 22% White 8%
- Hispanic origin (detail)
- Mexican 47% Puerto Rican 1%
- Foreign-born
- 11% · Canada
- Languages at home
- 63% English-only · Spanish 36%
Political lean MEDSL · Bexar
- 2024 margin
- Lean D (+9.8) · D 54.3% · R 44.6% · Other 1.1%
- 2008→2024 swing
- +4.2pp toward D · 2008: 5.6pp · 2024: 9.8pp
- All cycles
- 2024: D+9.8 2020: D+18.2 2016: D+13.5 2012: D+4.6 2008: D+5.6
Not yet ingested
- Civics
- —
Market trends
- HPI YoY
- ▲ 23.86%
- Current HPI
- 284.9844
- Rent YoY
- ▲ 0.53%
- Metro
- San Antonio-New Braunfels, TX
- State GDP YoY
- ▲ 3.95%
- F500 in state
- 110
Industry mix (Fortune 500 HQ in TX)
| Industry | F500 HQs | Revenue |
|---|---|---|
| Energy | 16 | $1,198B |
|
||
| Technology | 5 | $198B |
|
||
| Engineering / Construction | 4 | $72B |
|
||
| Energy Services | 3 | $60B |
|
||
| Utilities | 3 | $41B |
|
||
| Healthcare | 2 | $330B |
|
||
Price history
+68.8% since first listed23 events — show timeline
- 2026-04-24 Relisted — LERA
- 2026-04-15 Contingent — LERA
- 2026-04-03 Price Changed $135,000 LERA
- 2026-03-04 Listed $145,000 LERA
- 2022-04-18 Sold (Public Records) — Public Records
- 2022-03-30 Sold (MLS) — LERA
- 2022-01-25 Pending — LERA
- 2021-11-09 Listed $227,000 LERA
- 2021-10-27 Sold (Public Records) — Public Records
- 2021-08-20 Sold (Public Records) — Public Records
- 2014-04-14 Sold (Public Records) — Public Records
- 2014-04-11 Sold (MLS) — LERA
- 2014-03-17 Pending — LERA
- 2014-03-01 Contingent — LERA
- 2014-02-12 Relisted — LERA
- 2014-01-30 Contingent — LERA
- 2013-11-28 Listed $115,000 LERA
- 2011-02-07 Sold (Public Records) — Public Records
- 2011-01-27 Sold (MLS) — LERA
- 2011-01-21 Listing Removed — LERA
- 2010-11-19 Listed $64,900 LERA
- 2010-11-18 Listing Removed — LERA
- 2010-02-24 Listed $80,000 LERA
Property tax history
+7.0%/yrLatest (2025): $5,583 · -4.5% YoY. Source: county tax records.
Cash-flow waterfall
monthlySold comps — $/sqft
last 12 mo · ≤1 miLoading sold comps…