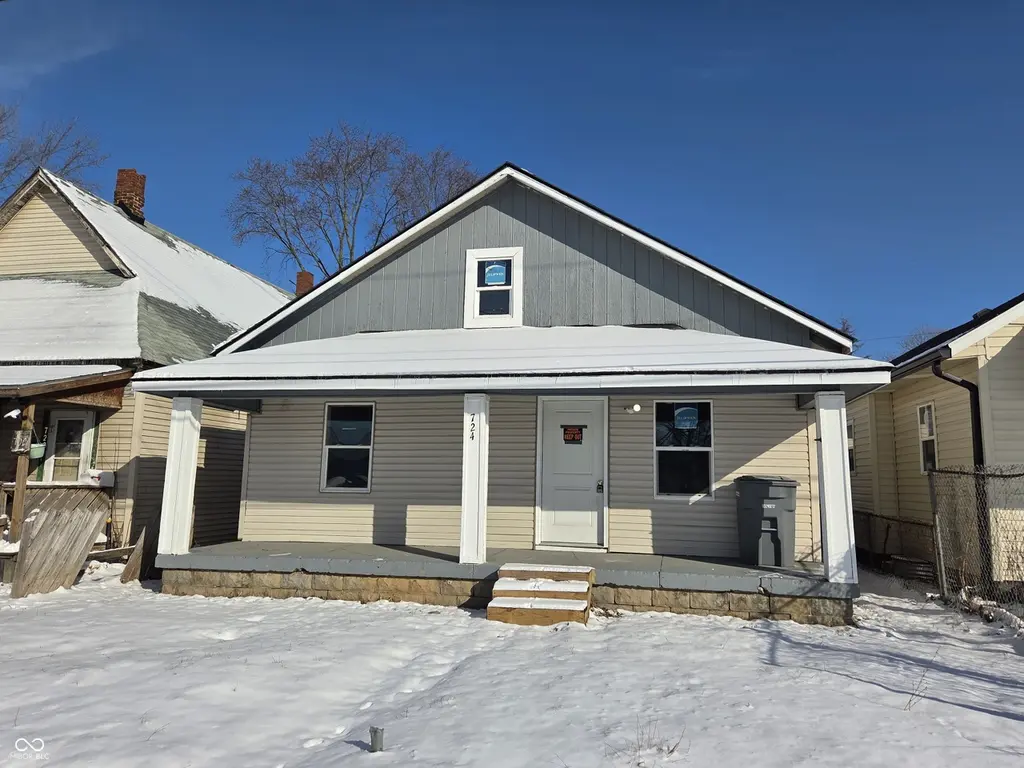
724 E Beecher St · Indianapolis city (balance), IN
Flood risk 6/10 · Moderate
- FEMA flood zone
- X (unshaded)
- Chance of flooding over 30 yrs
- 0.72%
- Est. flood insurance / yr
- $507 – $1,088
Fire risk 1/10 · Minimal
- Est. fire insurance / yr
- $717 – $1,331
Heat risk 4/10 · Minor
- Hot days now (above 101°F)
- 7 days/yr
- Hot days in 30 yrs
- 19 days/yr
Wind risk 2/10 · Minimal
- Chance of severe wind over 30 yrs
- 0.0%
Air-quality risk 3/10 · Minor
- Unhealthy air days now
- 2 days/yr
- Unhealthy air days in 30 yrs
- 3 days/yr
Risk factors via First Street. Map © Google.
Why this score? — see what drove the B- grade
The composite is a weighted blend of 9 inputs, each scored 0–100. Each bar is that input's sub-score; the figure is the points it added to the 100-point composite (weight × sub-score).
- Cash flow +30.0/30.0
- 1% rule +10.0/10.0
- DSCR +10.0/10.0
- ARV discount +7.5/15.0
- Rent growth +3.2/5.0
- Livability +2.5/5.0
- Condition / age +2.5/5.0
- Schools +1.4/10.0
- Appreciation +0.0/10.0
$95,900
🖨 Deal sheet (PDF) 📄 Offer letter ✓ Due diligence
Listing remarks MLS
Bates Hendricks single family home with recent renovations completed. Great addition to your rental portfolio in a high value gentrifying area. Home has two additional rooms upstairs in the converted attic space. With a little more work to finalize, this could be a nice asset in a strong rental market.
Key facts
- Strong rental market
- 3,659 sq ft lot
- Garage
Tags
Neighborhood map
What this means for you Summary
Snapshot
- This is a 2-bed/1.0-bath single-family listed at $96k.
Deal economics
- At list price, monthly cash flow is $414 ($5k/yr) — positive.
- The deal already cash-flows at list — no discount required.
- Meets the 1% rule at list price ($1k rent vs $96k).
- Recommended offer: $84k (12.0% below list) — sets the bar for market timing.
- Cap rate 11.5% vs local median 4.4% in Indianapolis city (balance) — top-decile yield for the area; either an underpriced asset or a hidden risk that comps aren't pricing in. Stress-test before assuming the spread holds.
Location & tenants
- Location reads: area grade B — affects rentability + tenant quality, not the cash-flow math above.
- Indianapolis Public Schools (urban): math 14% / reading 20% proficiency, ranked #286 of 301 in IN (top 95%) — low school quality limits family demand, transient renter base, plan for 1-2y turnover; 77% free/reduced lunch — lower-income household profile, screen leases tightly.
- Zoned schools: Frederick Douglass School 19 (math 9% / reading 13%, grade F, #909 of 994 statewide, top 92%, 444 students, 81% FRL); H L Harshman Middle School (math 3% / reading 16%, grade F, #316 of 330 statewide, top 96%, 549 students, 84% FRL).
- Market conditions: Rents rising (+2.9%/yr); 500 active listings in the ZIP; 40 comparable units currently listed for rent nearby; rentals at typical pace (median 25d on market — plan ~3-4 weeks tenant-placement turnaround); 1,906 units permitted in Marion County in 2024 (621 in 5+ unit buildings).
Forward outlook
- Local home prices are declining (-3.0%/yr); year-one equity from $663 of loan paydown is wiped out by about $3k of value loss. Plan a longer hold.
- Marion County population projected at +18% by 2050 — long-run rental-demand tailwind backs the buy-and-hold thesis.
- At projected returns (-3.0% appreciation + 2.9% rent growth), your $27k cash investment doubles in ~7 years — after that, you're playing with house money.
Negotiation context
- It's been on market 485 days — a 12% lower offer ($84k) is reasonable based on typical stale-listing flexibility.
- 5 sale attempts since 4y ago; this cycle's ask has dropped $54k (36%) from the opening price — seller is motivated, your offer sets the floor, not the list.
- Current owner paid $55k; list at $96k implies a 74% gain — meaningful room to come down on a strong offer.
Risks & watch-outs
- Watch-outs: built in 1910 — expect roof / HVAC / electrical / plumbing capex.
- Climate carrying-cost: major flood risk — expect insurance premiums to compound above CPI over the hold.
Questions for the listing agent
- It's been on market 485 days. Have you received any prior offers? Is the seller open to a 12% concession, seller financing, or rate buy-down credit?
- Built in 1910 — when were the roof, HVAC, electrical panel, plumbing, and water heater last replaced?
- Why hasn't it sold? Are there any deal-killer items the seller is aware of (foundation, flood, title, zoning, code violations)?
- Is there a deadline driving the sale (1031 exchange, divorce, estate, relocation)? That informs how much negotiation room exists.
- What's the average days-on-market for RENTAL listings here right now (not sales)? A rising rental-DOM trend means longer vacancies and softer asking-rent achievability than the comps imply.
- What's the recent tenant-quality profile in this submarket — average credit score on applications, eviction rate, late-payment / NSF rate, and stable-employment percentage? A property-management company in the area should have these aggregated.
- How much new for-sale + rental construction is in the pipeline within 1–3 miles? Heavy new supply typically softens prices + rents 12–24 months out; constrained supply supports both.
Investment metrics
- 1% rule
- 1.52% ✓
- Cap rate
- 11.47%
- Cash-on-cash
- 18.51%
- DSCR
- 1.82
- GRM
- 5.5
CMA / ARV
- ARV (median comp)
- $268,413
- List price
- $95,900
- Delta
- -64.27%
- Verdict
- UNDERPRICED
- Comps
- 20 within 1.0 mi
Show comp detail 12 sales within ~0.75 mi
| Address | Dist | Beds/Ba | Sqft | Sold | Price | $/sf | Match |
|---|---|---|---|---|---|---|---|
| 1869 New St | 0.09mi | 3/2.0 (+1) | 1,280 (+4%) | 1mo | $337,000 | $263 | 80 |
| 413 E Caven St | 0.23mi | 2/2.0 | 1,192 (-3%) | 1mo | $200,000 | $168 | 79 |
| 225 E Minnesota St | 0.42mi | 2/1.0 | 1,270 (+3%) | 1mo | $185,000 | $146 | 74 |
| 1441 S New Jersey St | 0.43mi | 2/1.0 | 1,111 (-10%) | 1mo | $205,000 | $185 | 63 |
| 1127 E Kelly St | 0.57mi | 2/2.0 | 1,280 (+4%) | 2mo | $185,000 | $145 | 61 |
| 1237 E Pleasant Run Parkway South Dr | 0.54mi | 2/1.0 | 1,344 (+9%) | 2mo | $150,000 | $112 | 58 |
| 1413 S New Jersey St | 0.47mi | 2/2.0 | 1,103 (-10%) | 1mo | $180,000 | $163 | 56 |
| 1234 E Pleasant Run Parkway North Dr | 0.56mi | 2/2.0 | 1,115 (-9%) | 1mo | $215,000 | $193 | 53 |
| 1518 E Legrande Ave | 0.69mi | 2/2.0 | 1,296 (+5%) | 3mo | $177,000 | $137 | 52 |
| 1902 Charles St | 0.65mi | 2/2.0 | 1,050 (-15%) | 3mo | $212,500 | $202 | 39 |
| 726 Sanders St | 0.62mi | 3/2.0 (+1) | 1,404 (+14%) | 3mo | $330,000 | $235 | 36 |
| 35 Iowa St | 0.64mi | 3/2.5 (+1) | 1,400 (+14%) | 2mo | $239,000 | $171 | 34 |
Match score weights: distance 35% · size 25% · config 20% · recency 20%. Top-matched comps best support the ARV.
Projected returns pro-forma
-3.0% appreciation · 2.88% rent growth · sell at horizon
- IRR
- 10.1%
- Equity multiple
- 1.40×
- Total profit
- $10,729
- Equity at exit
- $14,299
- IRR
- 19.2%
- Equity multiple
- 2.60×
- Total profit
- $42,864
- Equity at exit
- $8,292
Cash invested: $26,852 (down + closing). Projections, not guarantees.
Landlord ↔ Tenant lean methodology
- Overall (STATE)
- 90 Strongly Landlord-Friendly
- State Indiana
- 90 Strongly Landlord-Friendly · R+11
- County
- — inherits STATE
- City
- — inherits STATE
ZIP-level market 46203
- Home prices YoY
- -26.7%
- Rents YoY
- 2.9%
- Active inventory
- 500
- Price-to-rent
- 5.5×
Monthly cashflow live
- Estimated rent
- $1,459 high interval (Pro) →
- Mortgage (P&I)
- −$503
- Tax from tax record
- −$195 /mo · $2,345/yr
- Insurance
- −$40
- HOA
- −$0
- Vacancy / Maint / Mgmt
- −$306
- Net cashflow
- $414
Break-even live
Sensitivity live
| Price | -10% $468 | -5% $441 | +0% $414 | +5% $387 | +10% $360 |
|---|---|---|---|---|---|
| Rent | -10% $299 | -5% $357 | +0% $414 | +5% $472 | +10% $529 |
| Rate | -1.0pp $462 | -0.5pp $439 | base $414 | +0.5pp $389 | +1.0pp $364 |
UW: 25.0% down · 7.5% · 30yr · 1.5% tax · 5.0% vac · 8.0% maint · 8.0% mgmt
Financing live
Cash to close
- Down payment
- $23,975
- Closing costs
- $2,877
- Reserves months
- —
- Total cash needed
- —
Loan-product check · same deal, 3 products live
Conventional
25% down · 7.5% · 30yr
- Down + closing
- —
- Monthly P&I
- —
- Monthly cashflow
- —
- DSCR
- —
- Eligible?
- —
Personal DTI + credit; lowest rate.
DSCR
20% down · 8.5% · 30yr
- Down + closing
- —
- Monthly P&I
- —
- Monthly cashflow
- —
- DSCR
- —
- Eligible?
- —
No personal income docs; deal must DSCR.
Hard money
10% down · 12.0% · 12mo
- Down + closing
- —
- Monthly P&I
- —
- Monthly cashflow
- —
- DSCR
- —
- Eligible?
- —
Short-term bridge; refi at stabilization.
Rent comps 40 comps
| Address | Beds | Baths | Sqft | Rent | $/sqft | DOM | Units | Dist |
|---|---|---|---|---|---|---|---|---|
| 1833 Orleans St Unit 1 Indianapolis, IN | 3.0 | 1.0 | 1260 | $1,350 | $1.07 | 45d | 1 | 0.08mi |
| 620 E Beecher St Indianapolis, IN | 3.0 | 2.0 | 1072 | $1,639 | $1.53 | 21d | 1 | 0.08mi |
| 823 Iowa St Indianapolis, IN | 2.0 | 1.0 | 812 | $1,100 | $1.35 | 0d | 1 | 0.13mi |
| 823 Iowa St Indianapolis, IN | 2.0 | 1.0 | 812 | $1,100 | $1.35 | 45d | 1 | 0.13mi |
| 438 E Beecher St Indianapolis, IN | 3.0 | 2.5 | 1500 | $1,450 | $0.97 | 25d | 1 | 0.19mi |
| 2109 Singleton St Indianapolis, IN | 3.0 | 2.0 | 1340 | $2,100 | $1.57 | 9d | 1 | 0.22mi |
| 512 E Minnesota St Unit 203 Indianapolis, IN | 2.0 | 1.0 | 903 | $1,195 | $1.32 | 25d | 1 | 0.26mi |
| 944 E Minnesota St Indianapolis, IN | 2.0 | 2.0 | 944 | $1,299 | $1.38 | 45d | 1 | 0.26mi |
| 2103 Ringgold Ave Indianapolis, IN | 1.0 | 1.0 | 1090 | $775 | $0.71 | 15d | 1 | 0.28mi |
| 1861 Barth Ave Unit 1861 Indianapolis, IN | 2.0 | 1.0 | 1300 | $1,600 | $1.23 | 25d | 1 | 0.28mi |
| 835 Weghorst St Unit 837 Indianapolis, IN | 3.0 | 1.5 | 1500 | $1,399 | $0.93 | 25d | 1 | 0.32mi |
| 1117 E Naomi St Indianapolis, IN | 2.0 | 1.5 | 976 | $1,450 | $1.49 | 0d | 1 | 0.37mi |
| 1439 South East St Indianapolis, IN | 2.0 | 2.0 | 1114 | $1,425 | $1.28 | 22d | 1 | 0.39mi |
| 1439 South East St Indianapolis, IN | 2.0 | 2.0 | 1114 | $1,425 | $1.28 | 0d | 1 | 0.39mi |
| 1437 S East St Indianapolis, IN | 2.0 | 2.0 | 1114 | $1,425 | $1.28 | 45d | 1 | 0.39mi |
| 1011 E Raymond St Indianapolis, IN | 2.0 | 2.0 | 1100 | $1,350 | $1.23 | 25d | 1 | 0.40mi |
| 224 Iowa St Indianapolis, IN | 3.0 | 1.0 | 1254 | $1,450 | $1.16 | 25d | 1 | 0.40mi |
| 1514 Ringgold Ave Indianapolis, IN | 3.0 | 1.0 | 1064 | $1,295 | $1.22 | 45d | 1 | 0.42mi |
| 1436 S New Jersey St Unit A Indianapolis, IN | 3.0 | 2.5 | 1300 | $2,100 | $1.62 | 25d | 1 | 0.44mi |
| 2209 Ransdell St Indianapolis, IN | 2.0 | 1.0 | 710 | $900 | $1.27 | 45d | 1 | 0.46mi |
| 726 Parkway Ave Indianapolis, IN | 3.0 | 2.0 | 1150 | $2,195 | $1.91 | 19d | 1 | 0.49mi |
| 614 Parkway Ave Indianapolis, IN | 3.0 | 2.0 | 1360 | $1,850 | $1.36 | 0d | 1 | 0.50mi |
| 1756 Delaware St Indianapolis, IN | 3.0 | 2.0 | 1014 | $1,300 | $1.28 | 45d | 1 | 0.51mi |
| 1756 S Delaware St Unit 1754 Indianapolis, IN | 3.0 | 2.0 | 1014 | $1,300 | $1.28 | 16d | 1 | 0.51mi |
| 1409 S Alabama St Indianapolis, IN | 2.0 | 1.0 | 949 | $1,245 | $1.31 | 45d | 1 | 0.51mi |
| 1407 S Alabama St Indianapolis, IN | 2.0 | 1.0 | 949 | $1,150 | $1.21 | 45d | 1 | 0.52mi |
| 2236 Ransdell St Indianapolis, IN | 2.0 | 1.0 | 850 | $1,150 | $1.35 | 45d | 1 | 0.54mi |
| 1247 Wright St Indianapolis, IN | 3.0 | 1.5 | 1247 | $1,750 | $1.40 | 19d | 1 | 0.56mi |
| 1026 Orange St Indianapolis, IN | 2.0 | 2.0 | 1007 | $1,600 | $1.59 | 18d | 1 | 0.56mi |
| 1024 Orange St Indianapolis, IN | 2.0 | 2.0 | 1007 | $1,650 | $1.64 | 45d | 1 | 0.56mi |
| 1045 Orange St Indianapolis, IN | 2.0 | 1.0 | 1232 | $2,000 | $1.62 | 25d | 1 | 0.57mi |
| 1045 Orange St Indianapolis, IN | 2.0 | 1.0 | 1232 | $2,200 | $1.79 | 45d | 1 | 0.57mi |
| 2020 Boyd Ave Indianapolis, IN | 3.0 | 1.5 | 1160 | $1,450 | $1.25 | 25d | 1 | 0.59mi |
| 2018 Boyd Ave Indianapolis, IN | 3.0 | 1.5 | 1160 | $1,350 | $1.16 | 45d | 1 | 0.59mi |
| 1819 Union St Unit 1817 Indianapolis, IN | 3.0 | 2.0 | 1020 | $1,199 | $1.18 | 45d | 1 | 0.60mi |
| 704 Sanders St Indianapolis, IN | 2.0 | 1.0 | 1290 | $1,275 | $0.99 | 25d | 1 | 0.60mi |
| 1742 Thaddeus St Unit 1742-A Indianapolis, IN | 3.0 | 2.0 | 1350 | $1,600 | $1.19 | 15d | 1 | 0.61mi |
| 1318 Shelby St Unit B 120% AMI Indianapolis, IN | 1.0 | 1.0 | 1116 | $1,350 | $1.21 | 25d | 1 | 0.62mi |
| 1035 Sanders St Unit 163 Indianapolis, IN | 2.0 | 1.0 | 1481 | $1,921 | $1.30 | 45d | 1 | 0.63mi |
| 1729 Thaddeus St Unit 1729-B Indianapolis, IN | 3.0 | 2.0 | 1350 | $1,600 | $1.19 | 15d | 1 | 0.64mi |
Listing history 37 events
-
2026-06-21days on market $95,900 Active 485 DOM
-
2026-06-18days on market $95,900 Active 482 DOM
-
2026-06-17days on market $95,900 Active 481 DOM
-
2026-06-16days on market $95,900 Active 480 DOM
-
2026-06-15days on market $95,900 Active 479 DOM
-
2026-06-13days on market $95,900 Active 477 DOM
-
2026-06-13days on market $95,900 Active 476 DOM
-
2026-06-09days on market $95,900 Active 473 DOM
-
2026-06-08days on market $95,900 Active 472 DOM
-
2026-06-07days on market $95,900 Active 471 DOM
-
2026-06-03pricedays on market $95,900 Active 467 DOM
-
2026-06-02days on market $100,900 Active 466 DOM
-
2026-06-01days on market $100,900 Active 465 DOM
-
2026-05-31days on market $100,900 Active 464 DOM
-
2026-05-01price $100,900 303-char remark
Show marketing remark (303 chars)
Bates Hendricks single family home with recent renovations completed. Great addition to your rental portfolio in a high value gentrifying area. Home has two additional rooms upstairs in the converted attic space. With a little more work to finalize, this could be a nice asset in a strong rental market.
-
2026-03-31price $105,900 303-char remark
Show marketing remark (303 chars)
Bates Hendricks single family home with recent renovations completed. Great addition to your rental portfolio in a high value gentrifying area. Home has two additional rooms upstairs in the converted attic space. With a little more work to finalize, this could be a nice asset in a strong rental market.
-
2026-02-12price $110,900 303-char remark
Show marketing remark (303 chars)
Bates Hendricks single family home with recent renovations completed. Great addition to your rental portfolio in a high value gentrifying area. Home has two additional rooms upstairs in the converted attic space. With a little more work to finalize, this could be a nice asset in a strong rental market.
-
2026-01-05price $113,400 303-char remark
Show marketing remark (303 chars)
Bates Hendricks single family home with recent renovations completed. Great addition to your rental portfolio in a high value gentrifying area. Home has two additional rooms upstairs in the converted attic space. With a little more work to finalize, this could be a nice asset in a strong rental market.
-
2025-12-01price $115,900 303-char remark
Show marketing remark (303 chars)
Bates Hendricks single family home with recent renovations completed. Great addition to your rental portfolio in a high value gentrifying area. Home has two additional rooms upstairs in the converted attic space. With a little more work to finalize, this could be a nice asset in a strong rental market.
-
2025-10-28price $117,400 303-char remark
Show marketing remark (303 chars)
Bates Hendricks single family home with recent renovations completed. Great addition to your rental portfolio in a high value gentrifying area. Home has two additional rooms upstairs in the converted attic space. With a little more work to finalize, this could be a nice asset in a strong rental market.
-
2025-08-24price $119,900 303-char remark
Show marketing remark (303 chars)
Bates Hendricks single family home with recent renovations completed. Great addition to your rental portfolio in a high value gentrifying area. Home has two additional rooms upstairs in the converted attic space. With a little more work to finalize, this could be a nice asset in a strong rental market.
-
2025-07-22price $124,900 303-char remark
Show marketing remark (303 chars)
Bates Hendricks single family home with recent renovations completed. Great addition to your rental portfolio in a high value gentrifying area. Home has two additional rooms upstairs in the converted attic space. With a little more work to finalize, this could be a nice asset in a strong rental market.
-
2025-06-19price $134,900 303-char remark
Show marketing remark (303 chars)
Bates Hendricks single family home with recent renovations completed. Great addition to your rental portfolio in a high value gentrifying area. Home has two additional rooms upstairs in the converted attic space. With a little more work to finalize, this could be a nice asset in a strong rental market.
-
2025-04-07price $139,900 303-char remark
Show marketing remark (303 chars)
Bates Hendricks single family home with recent renovations completed. Great addition to your rental portfolio in a high value gentrifying area. Home has two additional rooms upstairs in the converted attic space. With a little more work to finalize, this could be a nice asset in a strong rental market.
-
2025-02-21$149,900 Active 303-char remark
Show marketing remark (303 chars)
Bates Hendricks single family home with recent renovations completed. Great addition to your rental portfolio in a high value gentrifying area. Home has two additional rooms upstairs in the converted attic space. With a little more work to finalize, this could be a nice asset in a strong rental market.
-
2024-12-06status Pending
-
2024-12-01historical
-
2024-11-25price $89,000
-
2024-10-14price $95,000
-
2024-09-23$100,000 Active
-
2024-02-06historical
-
2024-01-29$65,000 Active
-
2023-02-22soldstatus $55,000 Closed
-
2023-02-02status Pending
-
2023-01-30status Active
-
2023-01-04status Pending
-
2022-11-29$69,900 Active
ⓘ Source: listings_history table (triggers on properties + properties_extension) + one-shot
backfill from property_details.listing_events for pre-trigger history.
Tax reassessment forecast IN · Partial reset (capped growth)
- Current annual tax
- $2,345 · $195/mo
- Projected year-2 tax
- $2,345 · $195/mo
- Expected delta
- $0/yr ($0/mo · 0.0%)
ⓘ Screening estimate from a state-policy table — verify with the county assessor before closing.
Climate risk First Street
- Flood 6/10 Major FEMA zone X (unshaded) · 72% chance over 30 yrs
- Wildfire 1/10 Low
- Heat 4/10 Moderate 7 d/yr ≥101°F today · 19 d/yr by 30 yrs out
- Wind 2/10 Low 0% chance of damaging wind over 30 yrs
- Air quality 3/10 Moderate 2 unhealthy d/yr today · 3 by 30 yrs out
Nearby sold comps map
Loading sold comps map…
Walkable amenities ~0.75 mi
Loading nearby amenities…
Taxation est. · year 1
- Rental income
- $17,505
- − Mortgage interest
- −$5,372
- − Property taxes
- −$2,345
- − Insurance
- −$480
- − Repairs & maintenance
- −$1,400
- − Management
- −$1,400
- − Depreciation
- −$2,790
- Taxable income
- $3,718
- Est. tax owed @ 24.0%
- −$892
- After-tax cash flow
- $4,077/yr
For passive investors: Depreciation is non-cash, so a rental often shows a tax loss while cash-flowing — sheltering income. Rental losses are passive: they offset passive income freely, and up to $25,000/yr can offset ordinary (W-2) income if you actively participate and your MAGI is under $100k (phasing out to $0 by $150k); unused losses carry forward. On sale, claimed depreciation is recaptured at up to 25%, and gains may owe capital-gains tax (a 1031 exchange can defer both). Figures are a year-1 estimate at your 24.0% rate — not tax advice; consult a CPA.
Schools (NCES district)
- District
- Indianapolis Public Schools
- NCES district ID
- 1804770
- Math proficiency
- 14% ▼ -7.00%
- Reading proficiency
- 20% ▼ -3.00%
- Median HH income
- $32,034
- Composite
- 13.69/100
- National rank
- #9499
- State rank
- #286 of 301 in IN
Livability — Indianapolis city (balance)
No livability data for this city. (Only ~50 U.S. cities are tracked.)
Census & demographics
- Census place
- Indianapolis city (balance), IN
- County
- Marion County · 998,460 people
- City population
- 881,119
- Metro
- Indianapolis-Carmel-Anderson, IN
- Population (ZIP)
- 37,758
- Household income
- $57,393
- Rent vs Own
- Severe rent burden
- 1499.0
Population outlook (Marion County) Hauer SSP2
- Today (2025)
- 1,025,572 people
- By 2030
- 1,065,727 · +3.9%
- By 2040
- 1,141,577 · +11.3%
- By 2050
- 1,208,920 · +17.9%
- By 2075
- 1,367,288 · +33.3%
- By 2100
- 1,438,201 · +40.2%
Race, ethnicity, and origin ACS 2023
- Neighborhood character
- Predominantly White (69%)
- Race & ethnicity
- White 69% Hispanic / Latino 14% Black 12% Two or more races 8% Asian 2% Native American 1%
- Hispanic origin (detail)
- Mexican 12% Puerto Rican 1%
- Common ancestry
- Slovak 2% Lithuanian 2% Italian 1%
- Foreign-born
- 8% · Canada
- Languages at home
- 88% English-only · Spanish 10% Other Indo-European 1%
Political lean MEDSL · Marion
- 2024 margin
- Strong D (+27.7) · D 63.0% · R 35.3% · Other 1.7%
- 2008→2024 swing
- -0.7pp no change · 2008: 28.4pp · 2024: 27.7pp
- All cycles
- 2024: D+27.7 2020: D+29.1 2016: D+22.8 2012: D+22.2 2008: D+28.4
Not yet ingested
- Civics
- —
Market trends
- HPI YoY
- ▼ -127.37%
- Current HPI
- 349.579
- Rent YoY
- ▲ 2.88%
- Metro
- Indianapolis-Carmel-Anderson, IN
- State GDP YoY
- ▲ 2.90%
- F500 in state
- 18
Industry mix (Fortune 500 HQ in IN)
| Industry | F500 HQs | Revenue |
|---|---|---|
| Industrial Machinery | 2 | $37B |
|
||
| Healthcare | 1 | $177B |
|
||
| Pharmaceuticals | 1 | $45B |
|
||
| Metals / Steel | 1 | $18B |
|
||
| Agriculture | 1 | $17B |
|
||
| Packaging | 1 | $12B |
|
||
Price history
+44.3% since first listed23 events — show timeline
- 2026-05-01 Price Changed $100,900 MIBOR as Distributed by MLS Grid
- 2026-03-31 Price Changed $105,900 MIBOR as Distributed by MLS Grid
- 2026-02-12 Price Changed $110,900 MIBOR as Distributed by MLS Grid
- 2026-01-05 Price Changed $113,400 MIBOR as Distributed by MLS Grid
- 2025-12-01 Price Changed $115,900 MIBOR as Distributed by MLS Grid
- 2025-10-28 Price Changed $117,400 MIBOR as Distributed by MLS Grid
- 2025-08-24 Price Changed $119,900 MIBOR as Distributed by MLS Grid
- 2025-07-22 Price Changed $124,900 MIBOR as Distributed by MLS Grid
- 2025-06-19 Price Changed $134,900 MIBOR as Distributed by MLS Grid
- 2025-04-07 Price Changed $139,900 MIBOR as Distributed by MLS Grid
- 2025-02-21 Listed $149,900 MIBOR as Distributed by MLS Grid
- 2024-12-06 Pending — MIBOR as Distributed by MLS Grid
- 2024-12-01 Listing Removed — MIBOR as Distributed by MLS Grid
- 2024-11-25 Price Changed $89,000 MIBOR as Distributed by MLS Grid
- 2024-10-14 Price Changed $95,000 MIBOR as Distributed by MLS Grid
- 2024-09-23 Listed $100,000 MIBOR as Distributed by MLS Grid
- 2024-02-06 Listing Removed — MIBOR as Distributed by MLS Grid
- 2024-01-29 Listed $65,000 MIBOR as Distributed by MLS Grid
- 2023-02-22 Sold (MLS) $55,000 MIBOR as Distributed by MLS Grid
- 2023-02-02 Pending — MIBOR as Distributed by MLS Grid
- 2023-01-30 Relisted — MIBOR as Distributed by MLS Grid
- 2023-01-04 Pending — MIBOR as Distributed by MLS Grid
- 2022-11-29 Listed $69,900 MIBOR as Distributed by MLS Grid
Property tax history
+9.2%/yrLatest (2025): $2,345 · +4.1% YoY. Source: county tax records.
Cash-flow waterfall
monthlySold comps — $/sqft
last 12 mo · ≤1 miLoading sold comps…