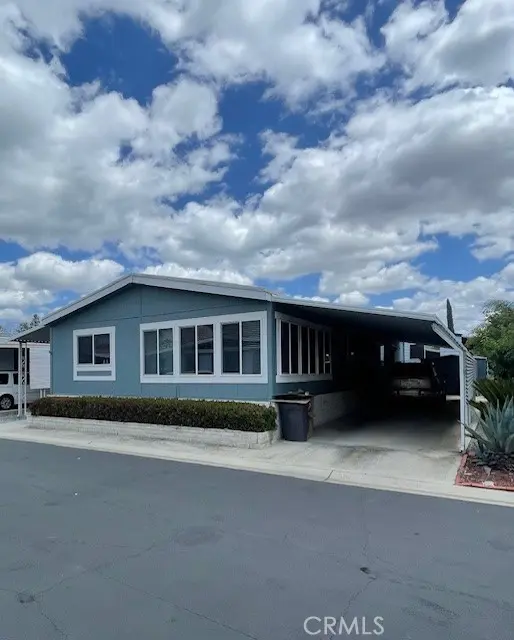
2230 Lake Park Dr #55 · San Jacinto, CA
Flood risk No data
- FEMA flood zone
- —
- Chance of flooding over 30 yrs
- —
- Est. flood insurance / yr
- —
Fire risk No data
- Est. fire insurance / yr
- —
Heat risk No data
- Hot days now (above threshold)
- —
- Hot days in 30 yrs
- —
Wind risk No data
- Chance of severe wind over 30 yrs
- —
Air-quality risk No data
- Unhealthy air days now
- —
- Unhealthy air days in 30 yrs
- —
Risk factors via First Street. Map © Google.
Why this score? — see what drove the B- grade
The composite is a weighted blend of 9 inputs, each scored 0–100. Each bar is that input's sub-score; the figure is the points it added to the 100-point composite (weight × sub-score).
- Cash flow +30.0/30.0
- 1% rule +10.0/10.0
- DSCR +10.0/10.0
- ARV discount +7.5/15.0
- Rent growth +3.2/5.0
- Livability +3.2/5.0
- Condition / age +2.5/5.0
- Schools +2.1/10.0
- Appreciation +0.0/10.0
$169,000
🖨 Deal sheet (PDF) 📄 Offer letter ✓ Due diligence
Listing remarks
Located in a desirable 55+ community. .. If you are looking for a turn-key home, look no further, this immaculate 3 bed 2 bath home is move in ready. Enjoy your morning coffee in the upgraded kitchen, with all new laminate flooring and carpet throughout. This home comes with large bedrooms, separate from the master suite. Conveniently located across from the Soboba Casino, championship golf course and many restaurants to chose from. This desirable 55+ community offers an array of activities and amenities for active seniors. Discover the lifestyle of your dreams!
Key facts
- 2 parking spots
- Community pool
- Built 1989
Property features AI
Finance
- Other: Pets allowed; Accessibility: 2+ access exits
- Financial info: Land lease (park) — $912.17 monthly
- HOA & community: Senior community; Park name: Soboba Spring Mobile Estates; Community features: lake, fishing, street lighting
Exterior
- Parking: Covered carport (2 spaces)
- Security: Gated community with automatic gate; Resident manager; Card/code access
- Utilities: District/public water; water connected; Public sewer; sewer connected; Natural gas connected; Electricity connected (220V in workshop); Cable available; Telephone in street
- Home design: Single-story/mobile home (double-wide); Entry level: 1 (front entry); Turnkey, updated/remodeled condition; Has a view; Model SHM6603A; mobile home remains (26' x 60')
- Construction: Hardboard exterior; Green/living roof; Brick skirt; Foundation: brick & mortar perimeter and pier jacks; Year built: other (source)
- Exterior features: Covered patio/porch; Rain gutters; Exterior lighting; In-ground community heated pool (gas) — fenced; Community spa (in-ground, heated); Shed on property; Landscaped lot; Lot on lakefront with community fishing; Private paved road frontage
Interior
- Kitchen: Remodeled kitchen open to family room; Kitchen island; 6-burner stove; Gas cooktop; Gas oven; Microwave; Refrigerator; Dishwasher
- Bedrooms: One-level home
- Flooring: Carpet; Laminate
- Bathrooms: 2 full bathrooms; Soaking tub and bathtub; Shower-in-tub; Closet in bathroom; Remodeled bathrooms with granite counters
- Heating & cooling: Central heating (central furnace); Central cooling
- Interior features: Ceiling fan; Pantry; Cathedral/vaulted ceilings; Formica counters; Double pane windows with blinds and screens; Formal entry; Living room; Entry (front)
- Laundry & utility: In-unit laundry room; Community laundry available
Neighborhood map
What this means for you Summary
Snapshot
- This is a 2-bed/2.0-bath manufactured listed at $169k.
Deal economics
- At list price, monthly cash flow is $1k ($12k/yr) — positive.
- The deal already cash-flows at list — no discount required.
- Meets the 1% rule at list price ($3k rent vs $169k).
- Recommended offer: $166k (1.5% below list) — sets the bar for market timing.
- Cap rate 13.6% vs local median 3.8% in San Jacinto — top-decile yield for the area; either an underpriced asset or a hidden risk that comps aren't pricing in. Stress-test before assuming the spread holds.
Location & tenants
- Location reads 63/100 on livability (#467 in CA) — a middle-class / working-renter tenant base. Strengths: housing A+; Watch: employment D+, amenities F, cost of living F.
- San Jacinto Unified (suburban): math 13% / reading 36% proficiency, ranked #421 of 517 in CA (top 81%) — low school quality limits family demand, transient renter base, plan for 1-2y turnover; 68% free/reduced lunch — lower-income household profile, screen leases tightly.
- Zoned schools: Estudillo Elementary (726 students, 82% FRL); North Mountain Middle (math 24% / reading 24%, grade F, #277 of 498 statewide, top 73%, 844 students, 90% FRL); San Jacinto High (math 14% / reading 38%, grade F, #807 of 1,170 statewide, top 69%, 2,617 students, 85% FRL) — zoned schools average 86% FRL vs 68% district-wide (18 pts higher); higher-poverty schools than district average — tighter screening recommended.
- Market conditions: Rents rising (+2.6%/yr); 160 active listings in the ZIP; 6 comparable units currently listed for rent nearby; rentals at typical pace (median 19d on market — plan ~3-4 weeks tenant-placement turnaround); 9,195 units permitted in Riverside County in 2024 (1,512 in 5+ unit buildings).
- This rent runs 45% of the median local income ($68k/yr) — at the standard rent-burdened threshold; future hikes will face affordability resistance.
Forward outlook
- Local home prices are declining (-3.0%/yr); year-one equity from $1k of loan paydown is wiped out by about $5k of value loss. Plan a longer hold.
- Riverside County population projected at +22% by 2050 — long-run rental-demand tailwind backs the buy-and-hold thesis.
- At projected returns (-3.0% appreciation + 2.6% rent growth), your $47k cash investment doubles in ~5 years — after that, you're playing with house money.
Negotiation context
- It's been on market 18 days — a 2% lower offer ($166k) is reasonable based on typical stale-listing flexibility.
- 4 sale attempts since 3y ago with the ask held roughly flat each time — persistent listings suggest the price (not the market) is what's stuck; bring a comps-based counter.
Questions for the listing agent
- Is there a deadline driving the sale (1031 exchange, divorce, estate, relocation)? That informs how much negotiation room exists.
- Schools are D-rated, which usually means shorter tenancies and higher turnover. Who's the typical renter profile here, and what's been the actual vacancy rate?
- What's the average days-on-market for RENTAL listings here right now (not sales)? A rising rental-DOM trend means longer vacancies and softer asking-rent achievability than the comps imply.
- What's the recent tenant-quality profile in this submarket — average credit score on applications, eviction rate, late-payment / NSF rate, and stable-employment percentage? A property-management company in the area should have these aggregated.
- How much new for-sale + rental construction is in the pipeline within 1–3 miles? Heavy new supply typically softens prices + rents 12–24 months out; constrained supply supports both.
Investment metrics
- 1% rule
- 1.52% ✓
- Cap rate
- 13.56%
- Cash-on-cash
- 25.97%
- DSCR
- 2.16
- GRM
- 5.5
CMA / ARV
- ARV (median comp)
- $96,171
- List price
- $169,000
- Delta
- 75.73%
- Verdict
- OVERPRICED
- Comps
- 20 within 1.0 mi
Show comp detail 12 sales within ~0.75 mi
| Address | Dist | Beds/Ba | Sqft | Sold | Price | $/sf | Match |
|---|---|---|---|---|---|---|---|
| 2230 Lake Park #127 | 0.00mi | 2/2.0 | 1,440 (-8%) | 3mo | $32,000 | $22 | 84 |
| 2230 Lake Park Dr #230 | 0.00mi | 2/2.0 | 1,625 (+4%) | 18mo | $142,000 | $87 | 78 |
| 2230 Lake Park Dr #106 | 0.16mi | 2/2.0 | 1,440 (-8%) | 2mo | $35,000 | $24 | 78 |
| 2230 Lake Park Dr #143 | 0.00mi | 2/2.0 | 1,440 (-8%) | 14mo | $75,000 | $52 | 76 |
| 2230 Lake Park Dr #87 | 0.00mi | 2/2.0 | 1,610 (+3%) | 23mo | $120,000 | $75 | 75 |
| 2230 Lake Park Dr #128 | 0.00mi | 2/2.0 | 1,760 (+13%) | 4mo | $62,500 | $36 | 75 |
| 2230 Lake Park Dr #116 | 0.16mi | 2/2.0 | 1,664 (+7%) | 10mo | $70,000 | $42 | 73 |
| 2230 Lake Park Dr #91 | 0.00mi | 2/2.0 | 1,440 (-8%) | 21mo | $67,000 | $47 | 69 |
| 2230 Lake Park Dr #81 | 0.00mi | 2/2.0 | 1,440 (-8%) | 24mo | $113,000 | $78 | 67 |
| 2230 Lake Park Dr #223 | 0.16mi | 2/2.0 | 1,344 (-14%) | 4mo | $77,500 | $58 | 66 |
| 2230 Lake Park Dr #174 | 0.18mi | 2/2.0 | 1,440 (-8%) | 16mo | $142,000 | $99 | 66 |
| 2230-223 Lake Park Dr | 0.00mi | 2/2.0 | 1,344 (-14%) | 17mo | $100,000 | $74 | 63 |
Match score weights: distance 35% · size 25% · config 20% · recency 20%. Top-matched comps best support the ARV.
Projected returns pro-forma
-3.0% appreciation · 2.61% rent growth · sell at horizon
- IRR
- 19.2%
- Equity multiple
- 1.78×
- Total profit
- $36,776
- Equity at exit
- $25,198
- IRR
- 27.3%
- Equity multiple
- 3.36×
- Total profit
- $111,674
- Equity at exit
- $14,612
Cash invested: $47,320 (down + closing). Projections, not guarantees.
Landlord ↔ Tenant lean methodology
- Overall (STATE)
- 18 Strongly Tenant-Friendly
- State California
- 18 Strongly Tenant-Friendly · D+13
- County
- — inherits STATE
- City
- — inherits STATE
ZIP-level market 92583
- Home prices YoY
- -14.8%
- Rents YoY
- 2.6%
- Active inventory
- 160
- Price-to-rent
- 5.5×
Monthly cashflow live
- Estimated rent
- $2,562 high interval (Pro) →
- Mortgage (P&I)
- −$886
- Tax from tax record
- −$43 /mo · $516/yr
- Insurance
- −$70
- HOA
- −$0
- Vacancy / Maint / Mgmt
- −$538
- Net cashflow
- $1,024
Break-even live
Sensitivity live
| Price | -10% $1,120 | -5% $1,072 | +0% $1,024 | +5% $976 | +10% $928 |
|---|---|---|---|---|---|
| Rent | -10% $822 | -5% $923 | +0% $1,024 | +5% $1,125 | +10% $1,227 |
| Rate | -1.0pp $1,109 | -0.5pp $1,067 | base $1,024 | +0.5pp $980 | +1.0pp $936 |
UW: 25.0% down · 7.5% · 30yr · 1.5% tax · 5.0% vac · 8.0% maint · 8.0% mgmt
Financing live
Cash to close
- Down payment
- $42,250
- Closing costs
- $5,070
- Reserves months
- —
- Total cash needed
- —
Loan-product check · same deal, 3 products live
Conventional
25% down · 7.5% · 30yr
- Down + closing
- —
- Monthly P&I
- —
- Monthly cashflow
- —
- DSCR
- —
- Eligible?
- —
Personal DTI + credit; lowest rate.
DSCR
20% down · 8.5% · 30yr
- Down + closing
- —
- Monthly P&I
- —
- Monthly cashflow
- —
- DSCR
- —
- Eligible?
- —
No personal income docs; deal must DSCR.
Hard money
10% down · 12.0% · 12mo
- Down + closing
- —
- Monthly P&I
- —
- Monthly cashflow
- —
- DSCR
- —
- Eligible?
- —
Short-term bridge; refi at stabilization.
Rent comps 6 comps
| Address | Beds | Baths | Sqft | Rent | $/sqft | DOM | Units | Dist |
|---|---|---|---|---|---|---|---|---|
| 904 Bergamo Ave San Jacinto, CA | 2.0 | 2.0 | 1596 | $2,600 | $1.63 | 12d | 1 | 0.59mi |
| 905 Verona Ave San Jacinto, CA | 2.0 | 2.0 | 1417 | $2,300 | $1.62 | 19d | 1 | 0.63mi |
| 1129 Osprey St San Jacinto, CA | 3.0 | 2.0 | 1582 | $2,700 | $1.71 | 45d | 1 | 1.03mi |
| 492 Foursquare Pl San Jacinto, CA | 3.0 | 2.0 | 1573 | $3,500 | $2.23 | 0d | 1 | 1.10mi |
| 646 Field Maple Pl GLMN HOT SPGS, CA | 3.0–4.0 | 2.0–3.0 | 1825 | $2,850 | $1.56 | 0d | 9 | 1.21mi |
| 621 S Mistletoe Ave San Jacinto, CA | 2.0 | 2.0 | 1500 | $2,000 | $1.33 | 45d | 1 | 1.37mi |
Listing history 20 events
-
2026-06-21days on market $169,000 Active 18 DOM
-
2026-06-18days on market $169,000 Active 15 DOM
-
2026-06-17days on market $169,000 Active 14 DOM
-
2026-06-16days on market $169,000 Active 13 DOM
-
2026-06-15days on market $169,000 Active 12 DOM
-
2026-06-13days on market $169,000 Active 10 DOM
-
2026-06-13days on market $169,000 Active 9 DOM
-
2026-06-09days on market $169,000 Active 6 DOM
-
2026-06-08days on market $169,000 Active 5 DOM
-
2026-06-07days on market $169,000 Active 4 DOM
-
2026-06-04statusdays on market $169,000 Active 1 DOM
-
2026-05-11historical
-
2025-05-16$169,000 Active
-
2025-04-30historical
-
2025-01-27status Active
-
2024-11-17price $169,999
-
2024-03-12price $197,999
-
2024-01-12price $198,000
-
2024-01-12price $175,000
-
2023-10-04$225,000 Active
ⓘ Source: listings_history table (triggers on properties + properties_extension) + one-shot
backfill from property_details.listing_events for pre-trigger history.
Tax reassessment forecast CA · Resets to sale price
- Current annual tax
- $516 · $43/mo
- Projected year-2 tax
- $1,284 · $107/mo
- Expected delta
- +$768/yr (+$64/mo · 148.7%)
ⓘ Screening estimate from a state-policy table — verify with the county assessor before closing.
Nearby sold comps map
Loading sold comps map…
Walkable amenities ~0.75 mi
Loading nearby amenities…
Taxation est. · year 1
- Rental income
- $30,742
- − Mortgage interest
- −$9,467
- − Property taxes
- −$516
- − Insurance
- −$845
- − Repairs & maintenance
- −$2,459
- − Management
- −$2,459
- − Depreciation
- −$4,916
- Taxable income
- $10,079
- Est. tax owed @ 24.0%
- −$2,419
- After-tax cash flow
- $9,871/yr
For passive investors: Depreciation is non-cash, so a rental often shows a tax loss while cash-flowing — sheltering income. Rental losses are passive: they offset passive income freely, and up to $25,000/yr can offset ordinary (W-2) income if you actively participate and your MAGI is under $100k (phasing out to $0 by $150k); unused losses carry forward. On sale, claimed depreciation is recaptured at up to 25%, and gains may owe capital-gains tax (a 1031 exchange can defer both). Figures are a year-1 estimate at your 24.0% rate — not tax advice; consult a CPA.
Schools (NCES district)
- District
- San Jacinto Unified
- NCES district ID
- 0634440
- Math proficiency
- 13% ▼ -9.00%
- Reading proficiency
- 36% ▬ 0.00%
- Median HH income
- $43,560
- Composite
- 20.94/100
- National rank
- #8478
- State rank
- #421 of 517 in CA
Livability — San Jacinto
- Score
- 63/100
- State rank
- #467
- US rank
- #15889
Category grades
Schools grade is shown separately in the Schools card above.
Census & demographics
- Census place
- San Jacinto, CA
- County
- Riverside County · 2,287,001 people
- City population
- 33,778
- Metro
- Riverside-San Bernardino-Ontario, CA
- Population (ZIP)
- 33,778
- Household income
- $68,351
- Rent vs Own
- Severe rent burden
- 747.0
Population outlook (Riverside County) Hauer SSP2
- Today (2025)
- 2,664,475 people
- By 2030
- 2,802,692 · +5.2%
- By 2040
- 3,050,904 · +14.5%
- By 2050
- 3,256,783 · +22.2%
- By 2075
- 3,655,058 · +37.2%
- By 2100
- 3,766,594 · +41.4%
Race, ethnicity, and origin ACS 2023
- Neighborhood character
- Diverse neighborhood (Simpson 0.57)
- Race & ethnicity
- Hispanic / Latino 60% White 26% Two or more races 23% Black 5% Asian 3% Native American 3%
- Hispanic origin (detail)
- Mexican 52%
- Common ancestry
- Lithuanian 1% Iranian 1% Portuguese 1%
- Foreign-born
- 20% · Canada
- Languages at home
- 56% English-only · Spanish 40% Tagalog/Filipino 2% Other Asian/Pacific 1%
Political lean MEDSL · Riverside
- 2024 margin
- Toss-up / Even · D 48.0% · R 49.3% · Other 2.6%
- 2008→2024 swing
- -3.6pp toward R · 2008: 2.3pp · 2024: -1.3pp
- All cycles
- 2024: R+1.3 2020: D+8.0 2016: D+4.3 2012: R+0.4 2008: D+2.3
Not yet ingested
- Civics
- —
Market trends
- HPI YoY
- ▼ -71.15%
- Current HPI
- 407.8584
- Rent YoY
- ▲ 2.61%
- Metro
- Riverside-San Bernardino-Ontario, CA
- State GDP YoY
- ▲ 3.21%
- F500 in state
- 116
Industry mix (Fortune 500 HQ in CA)
| Industry | F500 HQs | Revenue |
|---|---|---|
| Technology | 27 | $1,492B |
|
||
| Financial Services | 3 | $174B |
|
||
| Retail | 3 | $44B |
|
||
| Insurance | 3 | $26B |
|
||
| Media / Entertainment | 2 | $115B |
|
||
| Pharmaceuticals / Biotech | 2 | $62B |
|
||
Price history
-24.9% since first listed10 events — show timeline
- 2026-06-03 Listed $169,000 CRMLS
- 2026-05-11 Listing Removed — CRMLS
- 2025-05-16 Listed $169,000 CRMLS
- 2025-04-30 Listing Removed — CRMLS
- 2025-01-27 Relisted — CRMLS
- 2024-11-17 Price Changed $169,999 CRMLS
- 2024-03-12 Price Changed $197,999 CRMLS
- 2024-01-12 Price Changed $198,000 CRMLS
- 2024-01-12 Price Changed $175,000 CRMLS
- 2023-10-04 Listed $225,000 CRMLS
Property tax history
-0.5%/yrLatest (2025): $516 · +9.6% YoY. Source: county tax records.
Cash-flow waterfall
monthlySold comps — $/sqft
last 12 mo · ≤1 miLoading sold comps…