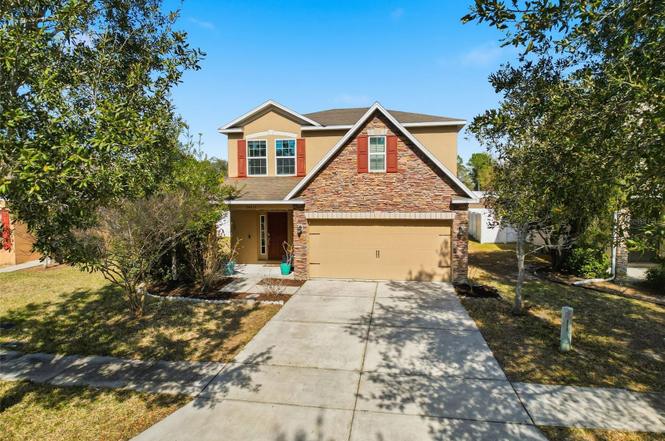
36115 Markree Castle Ave · Dade City, FL
Flood risk 1/10 · Minimal
- FEMA flood zone
- X (unshaded)
- Chance of flooding over 30 yrs
- 0.0%
- Est. flood insurance / yr
- $507 – $1,088
Fire risk 4/10 · Minor
- Est. fire insurance / yr
- $947 – $1,759
Heat risk 9/10 · Severe
- Hot days now (above 109°F)
- 7 days/yr
- Hot days in 30 yrs
- 25 days/yr
Wind risk 9/10 · Severe
- Chance of severe wind over 30 yrs
- 99.0%
Air-quality risk 1/10 · Minimal
- Unhealthy air days now
- 0 days/yr
- Unhealthy air days in 30 yrs
- 0 days/yr
Risk factors via First Street. Map © Google.
Why this score? — see what drove the D+ grade
The composite is a weighted blend of 9 inputs, each scored 0–100. Each bar is that input's sub-score; the figure is the points it added to the 100-point composite (weight × sub-score).
- ARV discount +14.9/15.0
- Cash flow +12.3/30.0
- Schools +4.3/10.0
- DSCR +3.7/10.0
- Livability +3.7/5.0
- Rent growth +3.3/5.0
- 1% rule +3.2/10.0
- Condition / age +2.5/5.0
- Appreciation +0.0/10.0
$299,900
🖨 Deal sheet (PDF) 📄 Offer letter ✓ Due diligence
Listing remarks MLS
Brand new builder owned 4/2.5 two story spec home available for immediate occupancy. CBS construction w/ full builder warranties. Terrific plan featuring eat in kitchen, indoor utilrm, large greatrm and kitchen, garden tub, carpet upgrade, extensive ceramic tile flooring, SS appliances, blind pkg, garage door opener, cabinet upgrade +++
Key facts
- Large backyard
- Walk-in closets
- Neighborhood park
Tags
Property features AI
Finance
- Other: Homestead exemption applied
- Financial info: Lease restrictions apply
- HOA & community: Has HOA (quarterly association fee approximately $158; monthly equivalent $52.67); Association managed by Joseph Vilardi, LCAM; Pets: dogs allowed
Exterior
- Parking: Attached garage; 2-car garage
- Utilities: Public water; Public sewer; Electricity connected; Cable available
- Home design: Single family residence; Two-story; South facing; Residential zoning (PDH1)
- Construction: Block, stucco, and frame construction; Shingle roof; Slab foundation; Built on a 0.14-acre lot
- Exterior features: Private mailbox; Sidewalk; Sliding doors; Paved road access
Interior
- Kitchen: Dishwasher; Microwave; Range; Range hood; Refrigerator
- Bedrooms: 4 bedrooms
- Flooring: Carpet
- Bathrooms: 2 full baths; 1 half bath
- Heating & cooling: Central heating; Central air conditioning
- Interior features: In-wall pest control system; Kitchen/family room combo; Open floorplan; Thermostat; Walk-in closets; Window treatments; Skylights
- Laundry & utility: Inside laundry; Laundry closet
Neighborhood map
What this means for you Summary
Snapshot
- This is a 4-bed/3.0-bath single-family listed at $300k.
Deal economics
- At list price, monthly cash flow is $-54 ($-647/yr) — negative.
- To cash-flow at today's rent, offer at most $290k (3.2% below list).
- To meet the 1% rule (rent ≥ 1% of price), the offer needs to be $246k (18.1% below list).
- Recommended offer: $246k (18.1% below list) — sets the bar for 1% rule.
- Cap rate 6.1% vs local median 4.6% in Dade City — top-decile yield for the area; either an underpriced asset or a hidden risk that comps aren't pricing in. Stress-test before assuming the spread holds.
Location & tenants
- Location reads 73/100 on livability (#307 in FL) — a middle-class / working-renter tenant base. Strengths: cost of living A+, housing A+, health & safety A+; Watch: employment C-, amenities F, commute F.
- Pasco (suburban): math 50% / reading 52% proficiency, ranked #32 of 73 in FL (top 44%) — acceptable for families but not a draw, mixed tenant base, ~2y average lease.
- Zoned schools: Pasco Elementary School (math 29% / reading 30%, grade F, #1,896 of 2,144 statewide, top 90%, 586 students, 89% FRL); Pasco Middle School (math 38% / reading 38%, grade F, #388 of 571 statewide, top 69%, 903 students, 73% FRL); Pasco High School (math 40% / reading 40%, grade F, #296 of 667 statewide, top 45%, 1,639 students, 66% FRL) — zoned schools average 76% FRL vs 48% district-wide (27 pts higher); higher-poverty schools than district average — tighter screening recommended.
- Zoned-school proficiency averages 36% at this address vs 51% district-wide (-15 pts) — the specific schools serving this property underperform the Pasco average; the district grade overstates school quality for this exact location.
- Market conditions: Rents rising (+3.0%/yr); 674 active listings in the ZIP; 11 comparable units currently listed for rent nearby; rentals leasing fast (median 13d on market — plan ~1-2 weeks tenant-placement turnaround); 6,765 units permitted in Pasco County in 2024 (1,250 in 5+ unit buildings).
- This rent runs 43% of the median local income ($69k/yr) — at the standard rent-burdened threshold; future hikes will face affordability resistance.
Forward outlook
- Local home prices are declining (-3.0%/yr); year-one equity from $2k of loan paydown is wiped out by about $9k of value loss. Plan a longer hold.
- Pasco County population projected at +29% by 2050 — long-run rental-demand tailwind backs the buy-and-hold thesis.
Negotiation context
- It's been on market 86 days — a 6% lower offer ($282k) is reasonable based on typical stale-listing flexibility.
- 2 sale attempts since 13y ago; this cycle's ask has dropped $30k (9%) from the opening price — seller is motivated, your offer sets the floor, not the list.
- Current owner paid $155k; list at $300k implies a 93% gain — meaningful room to come down on a strong offer.
Risks & watch-outs
- Climate carrying-cost: severe wind risk, 99% chance of damaging wind over 30y; extreme-heat days projected 7→25/yr by 2055 (HVAC capex compounding) — expect insurance premiums to compound above CPI over the hold.
Questions for the listing agent
- What do current leases actually rent for vs. the listed asking? Can we see a recent rent roll and the last 12 months of T-12 income?
- It's been on market 86 days. Have you received any prior offers? Is the seller open to a 18% concession, seller financing, or rate buy-down credit?
- What does the HOA fee cover, when was the last increase, and are there any pending special assessments or reserve-fund shortfalls?
- Why hasn't it sold? Are there any deal-killer items the seller is aware of (foundation, flood, title, zoning, code violations)?
- Is there a deadline driving the sale (1031 exchange, divorce, estate, relocation)? That informs how much negotiation room exists.
- Schools are D-rated, which usually means shorter tenancies and higher turnover. Who's the typical renter profile here, and what's been the actual vacancy rate?
- The area grade is low — what's the realistic commute time and amenity access for the typical tenant pool here? Any planned neighborhood developments (good or bad) we should know about?
- What's the average days-on-market for RENTAL listings here right now (not sales)? A rising rental-DOM trend means longer vacancies and softer asking-rent achievability than the comps imply.
- What's the recent tenant-quality profile in this submarket — average credit score on applications, eviction rate, late-payment / NSF rate, and stable-employment percentage? A property-management company in the area should have these aggregated.
- How much new for-sale + rental construction is in the pipeline within 1–3 miles? Heavy new supply typically softens prices + rents 12–24 months out; constrained supply supports both.
Investment metrics
- 1% rule
- 0.82% ✗
- Cap rate
- 6.08%
- Cash-on-cash
- -0.77%
- DSCR
- 0.97
- GRM
- 10.2
CMA / ARV
- ARV (on-the-fly)
- $359,046
- Comps found
- 12
Show comp detail 12 sales within ~0.75 mi
| Address | Dist | Beds/Ba | Sqft | Sold | Price | $/sf | Match |
|---|---|---|---|---|---|---|---|
| 36115 Markree Castle Ave | 0.00mi | 4/2.5 | 1,962 (0%) | 0mo | $279,000 | $142 | 98 |
| 13072 Kent Bradley St | 0.32mi | 3/2.0 (-1) | 1,970 (+0%) | 2mo | $363,850 | $185 | 74 |
| 13019 Ogden Glade Rd | 0.37mi | 3/2.0 (-1) | 2,017 (+3%) | 1mo | $310,500 | $154 | 68 |
| 13170 Kent Bradley ST Rd | 0.23mi | 4/3.0 | 2,200 (+12%) | 1mo | $366,500 | $167 | 68 |
| 13092 Kent Bradley St | 0.30mi | 4/2.0 | 1,820 (-7%) | 3mo | $357,830 | $197 | 68 |
| 13022 Kent Bradley St | 0.37mi | 4/2.0 | 1,820 (-7%) | 2mo | $356,500 | $196 | 65 |
| 35446 Brick Church Loop | 0.69mi | 4/3.0 | 2,020 (+3%) | 1mo | $369,990 | $183 | 62 |
| 35472 Brick Church Loop | 0.66mi | 4/3.0 | 2,020 (+3%) | 3mo | $349,990 | $173 | 62 |
| 35432 Brick Church Loop | 0.70mi | 4/3.0 | 2,020 (+3%) | 2mo | $372,990 | $185 | 61 |
| 35414 Brick Church Loop | 0.71mi | 4/3.0 | 2,020 (+3%) | 2mo | $363,225 | $180 | 61 |
| 35515 Brick Church Loop | 0.62mi | 4/2.0 | 1,828 (-7%) | 1mo | $328,990 | $180 | 55 |
| 35445 Brick Church Loop | 0.67mi | 4/2.0 | 1,828 (-7%) | 1mo | $333,665 | $183 | 52 |
Match score weights: distance 35% · size 25% · config 20% · recency 20%. Top-matched comps best support the ARV.
Projected returns pro-forma
-3.0% appreciation · 3.02% rent growth · sell at horizon
- IRR
- -17.6%
- Equity multiple
- 0.38×
- Total profit
- $-51,993
- Equity at exit
- $44,716
- IRR
- -9.6%
- Equity multiple
- 0.41×
- Total profit
- $-49,541
- Equity at exit
- $25,930
Cash invested: $83,972 (down + closing). Projections, not guarantees.
Landlord ↔ Tenant lean methodology
- Overall (STATE)
- 87 Strongly Landlord-Friendly
- State Florida
- 87 Strongly Landlord-Friendly · R+3
- County
- — inherits STATE
- City
- — inherits STATE
ZIP-level market 33525
- Home prices YoY
- -15.4%
- Rents YoY
- 3.0%
- Active inventory
- 674
- Price-to-rent
- 10.2×
Monthly cashflow live
- Estimated rent
- $2,455 high interval (Pro) →
- Mortgage (P&I)
- −$1,573
- Tax from tax record
- −$244 /mo · $2,927/yr
- Insurance
- −$125
- HOA
- −$52
- Vacancy / Maint / Mgmt
- −$516
- Net cashflow
- $-54
Break-even live
Sensitivity live
| Price | -10% $116 | -5% $31 | +0% $-54 | +5% $-139 | +10% $-224 |
|---|---|---|---|---|---|
| Rent | -10% $-248 | -5% $-151 | +0% $-54 | +5% $43 | +10% $140 |
| Rate | -1.0pp $97 | -0.5pp $22 | base $-54 | +0.5pp $-132 | +1.0pp $-211 |
UW: 25.0% down · 7.5% · 30yr · 1.5% tax · 5.0% vac · 8.0% maint · 8.0% mgmt
Financing live
Cash to close
- Down payment
- $74,975
- Closing costs
- $8,997
- Reserves months
- —
- Total cash needed
- —
Loan-product check · same deal, 3 products live
Conventional
25% down · 7.5% · 30yr
- Down + closing
- —
- Monthly P&I
- —
- Monthly cashflow
- —
- DSCR
- —
- Eligible?
- —
Personal DTI + credit; lowest rate.
DSCR
20% down · 8.5% · 30yr
- Down + closing
- —
- Monthly P&I
- —
- Monthly cashflow
- —
- DSCR
- —
- Eligible?
- —
No personal income docs; deal must DSCR.
Hard money
10% down · 12.0% · 12mo
- Down + closing
- —
- Monthly P&I
- —
- Monthly cashflow
- —
- DSCR
- —
- Eligible?
- —
Short-term bridge; refi at stabilization.
Rent comps 11 comps
| Address | Beds | Baths | Sqft | Rent | $/sqft | DOM | Units | Dist |
|---|---|---|---|---|---|---|---|---|
| 36350 Spanish Rose Dr Dade City, FL | 4.0 | 2.0 | 1828 | $2,149 | $1.18 | 6d | 1 | 0.28mi |
| 36169 Trinity Glade Rd Dade City, FL | 4.0 | 2.5 | 2181 | $2,600 | $1.19 | 13d | 1 | 0.29mi |
| 36132 Trinity Glade Rd Dade City, FL | 3.0 | 2.0 | 1515 | $2,425 | $1.60 | 16d | 1 | 0.32mi |
| 12945 Ogden Glade Rd Dade City, FL | 4.0 | 2.0 | 1815 | $2,195 | $1.21 | 19d | 1 | 0.37mi |
| 13576 Whiskey Daisy Dr Dade City, FL | 4.0 | 2.5 | 2238 | $2,500 | $1.12 | 1d | 1 | 0.48mi |
| 35514 Mahwah Ave Dade City, FL | 4.0 | 3.0 | 2020 | $2,400 | $1.19 | 22d | 1 | 0.66mi |
| 35288 Spruce Knob Ct Dade City, FL | 4.0 | 2.5 | 2305 | $2,300 | $1.00 | 19d | 1 | 0.86mi |
| 12813 Ware Ln Dade City, FL | 1.0–3.0 | 1.0–2.0 | 1103 | $1,795 | $1.63 | 0d | 13 | 1.02mi |
| 36111 Canelli Way Dade City, FL | 4.0 | 2.0 | 2008 | $2,295 | $1.14 | 4d | 1 | 1.32mi |
| 37011 Bear Branch Dr Dade City, FL | 3.0–4.0 | 2.0–3.0 | 1730 | $2,419 | $1.40 | 0d | 15 | 1.33mi |
| 37015 Waldo Dr Dade City, FL | 4.0 | 2.0 | 1480 | $3,750 | $2.53 | 26d | 1 | 1.46mi |
HOA detail
- Monthly dues
- $52 · $624/yr
Listing history 8 events
-
2026-05-03status Pending
-
2026-03-30price $299,900
-
2026-03-30price $304,900
-
2026-03-05price $314,900
-
2026-02-18price $324,900
-
2026-02-05$329,900 Active
-
2014-04-28soldstatus $155,270 Sold 338-char remark
Show marketing remark (338 chars)
Brand new builder owned 4/2.5 two story spec home available for immediate occupancy. CBS construction w/ full builder warranties. Terrific plan featuring eat in kitchen, indoor utilrm, large greatrm and kitchen, garden tub, carpet upgrade, extensive ceramic tile flooring, SS appliances, blind pkg, garage door opener, cabinet upgrade +++
-
2013-07-22$155,270 338-char remark
Show marketing remark (338 chars)
Brand new builder owned 4/2.5 two story spec home available for immediate occupancy. CBS construction w/ full builder warranties. Terrific plan featuring eat in kitchen, indoor utilrm, large greatrm and kitchen, garden tub, carpet upgrade, extensive ceramic tile flooring, SS appliances, blind pkg, garage door opener, cabinet upgrade +++
ⓘ Source: listings_history table (triggers on properties + properties_extension) + one-shot
backfill from property_details.listing_events for pre-trigger history.
Tax reassessment forecast FL · Resets to sale price
- Current annual tax
- $2,927 · $244/mo
- Projected year-2 tax
- $2,927 · $244/mo
- Expected delta
- $0/yr ($0/mo · 0.0%)
ⓘ Screening estimate from a state-policy table — verify with the county assessor before closing.
Climate risk First Street
- Flood 1/10 Low FEMA zone X (unshaded) · 0% chance over 30 yrs
- Wildfire 4/10 Moderate
- Heat 9/10 Extreme 7 d/yr ≥109°F today · 25 d/yr by 30 yrs out
- Wind 9/10 Extreme 99% chance of damaging wind over 30 yrs
- Air quality 1/10 Low 0 unhealthy d/yr today · 0 by 30 yrs out
Nearby sold comps map
Loading sold comps map…
Walkable amenities ~0.75 mi
Loading nearby amenities…
Taxation est. · year 1
- Rental income
- $29,463
- − Mortgage interest
- −$16,799
- − Property taxes
- −$2,927
- − Insurance
- −$1,500
- − Repairs & maintenance
- −$2,357
- − Management
- −$2,357
- − HOA
- −$624
- − Depreciation
- −$8,724
- Taxable loss
- −$5,825
- Est. tax savings @ 24.0%
- +$1,398
- After-tax cash flow
- $751/yr
For passive investors: Depreciation is non-cash, so a rental often shows a tax loss while cash-flowing — sheltering income. Rental losses are passive: they offset passive income freely, and up to $25,000/yr can offset ordinary (W-2) income if you actively participate and your MAGI is under $100k (phasing out to $0 by $150k); unused losses carry forward. On sale, claimed depreciation is recaptured at up to 25%, and gains may owe capital-gains tax (a 1031 exchange can defer both). Figures are a year-1 estimate at your 24.0% rate — not tax advice; consult a CPA.
Schools (NCES district)
- District
- Pasco
- NCES district ID
- 1201530
- Math proficiency
- 50% ▼ -10.00%
- Reading proficiency
- 52% ▼ -5.00%
- Median HH income
- $45,039
- Composite
- 43.14/100
- National rank
- #3074
- State rank
- #32 of 73 in FL
Livability — Dade City
- Score
- 73/100
- State rank
- #307
- US rank
- #5215
Category grades
Schools grade is shown separately in the Schools card above.
Census & demographics
- Census place
- Dade City, FL
- County
- Pasco County · 524,098 people
- City population
- 21,077
- Metro
- Tampa-St. Petersburg-Clearwater, FL
- Population (ZIP)
- 21,077
- Household income
- $69,068
- Rent vs Own
- Severe rent burden
- 322.0
Population outlook (Pasco County) Hauer SSP2
- Today (2025)
- 570,045 people
- By 2030
- 605,844 · +6.3%
- By 2040
- 674,806 · +18.4%
- By 2050
- 736,022 · +29.1%
- By 2075
- 862,900 · +51.4%
- By 2100
- 906,364 · +59.0%
Race, ethnicity, and origin ACS 2023
- Neighborhood character
- Predominantly White (76%)
- Race & ethnicity
- White 76% Hispanic / Latino 16% Two or more races 7% Black 3%
- Hispanic origin (detail)
- Mexican 9% Puerto Rican 3%
- Common ancestry
- Lithuanian 2% Romanian 2% Serbian 2%
- Foreign-born
- 6% · Canada, Jamaica
- Languages at home
- 87% English-only · Spanish 11% Other Asian/Pacific 1% Other Indo-European 1%
Political lean MEDSL · Pasco
- 2024 margin
- Strong R (+25.2) · D 36.9% · R 62.1% · Other 1.0%
- 2008→2024 swing
- -21.6pp toward R · 2008: -3.6pp · 2024: -25.2pp
- All cycles
- 2024: R+25.2 2020: R+20.1 2016: R+21.6 2012: R+6.7 2008: R+3.6
Not yet ingested
- Civics
- —
Market trends
- HPI YoY
- ▼ -65.48%
- Current HPI
- 358.2149
- Rent YoY
- ▲ 3.02%
- Metro
- Tampa-St. Petersburg-Clearwater, FL
- State GDP YoY
- ▲ 3.28%
- F500 in state
- 36
Industry mix (Fortune 500 HQ in FL)
| Industry | F500 HQs | Revenue |
|---|---|---|
| Industrial Technology | 2 | $29B |
|
||
| Insurance | 2 | $17B |
|
||
| Retail | 1 | $60B |
|
||
| Technology Distribution | 1 | $58B |
|
||
| Homebuilding | 1 | $35B |
|
||
| Technology Manufacturing | 1 | $35B |
|
||
Price history
+93.1% since first listed8 events — show timeline
- 2026-05-03 Pending — Stellar MLS as Distributed by MLS Grid
- 2026-03-30 Price Changed $299,900 Stellar MLS as Distributed by MLS Grid
- 2026-03-30 Price Changed $304,900 Stellar MLS as Distributed by MLS Grid
- 2026-03-05 Price Changed $314,900 Stellar MLS as Distributed by MLS Grid
- 2026-02-18 Price Changed $324,900 Stellar MLS as Distributed by MLS Grid
- 2026-02-05 Listed $329,900 Stellar MLS as Distributed by MLS Grid
- 2014-04-28 Sold (MLS) $155,270 Stellar MLS as Distributed by MLS Grid
- 2013-07-22 Listed $155,270 Stellar MLS as Distributed by MLS Grid
Property tax history
+22.5%/yrLatest (2025): $2,927 · +1.8% YoY. Source: county tax records.
Cash-flow waterfall
monthlySold comps — $/sqft
last 12 mo · ≤1 miLoading sold comps…