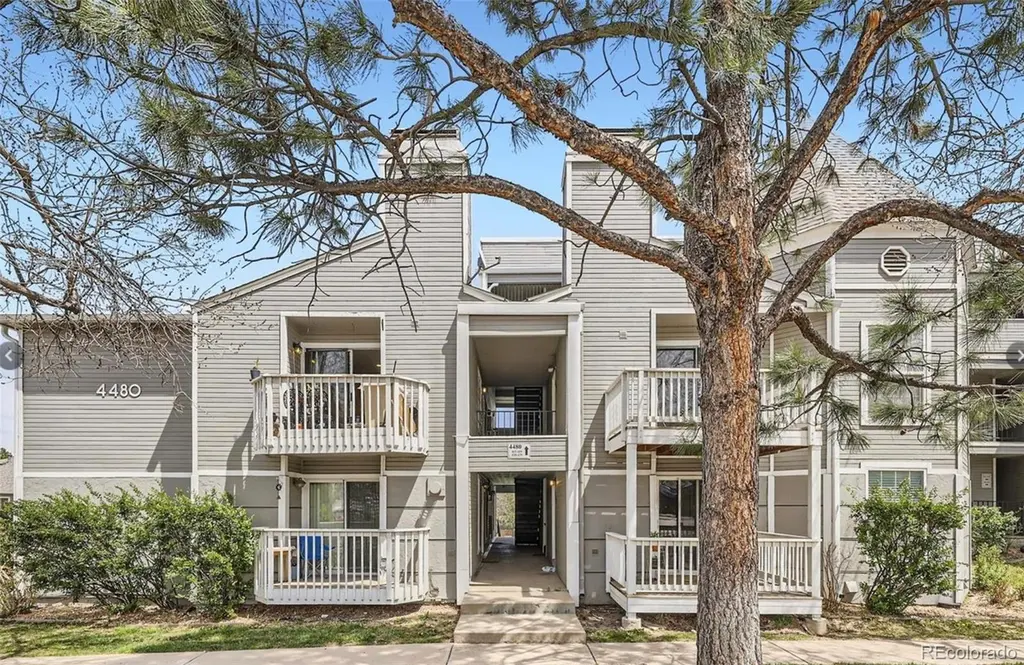
4480 S Pitkin St #127 · Aurora, CO
Flood risk 1/10 · Minimal
- FEMA flood zone
- X (unshaded)
- Chance of flooding over 30 yrs
- 0.0%
- Est. flood insurance / yr
- $507 – $1,088
Fire risk 2/10 · Minimal
- Est. fire insurance / yr
- $939 – $1,743
Heat risk 3/10 · Minor
- Hot days now (above 91°F)
- 6 days/yr
- Hot days in 30 yrs
- 16 days/yr
Wind risk 2/10 · Minimal
- Chance of severe wind over 30 yrs
- —
Air-quality risk 2/10 · Minimal
- Unhealthy air days now
- 0 days/yr
- Unhealthy air days in 30 yrs
- 2 days/yr
Risk factors via First Street. Map © Google.
Why this score? — see what drove the D grade
The composite is a weighted blend of 9 inputs, each scored 0–100. Each bar is that input's sub-score; the figure is the points it added to the 100-point composite (weight × sub-score).
- Cash flow +12.8/30.0
- ARV discount +7.5/15.0
- 1% rule +5.3/10.0
- Schools +4.4/10.0
- DSCR +3.8/10.0
- Livability +3.6/5.0
- Condition / age +2.5/5.0
- Rent growth +1.9/5.0
- Appreciation +0.0/10.0
$203,999
🖨 Deal sheet (PDF) 📄 Offer letter ✓ Due diligence
Listing remarks MLS
Charming 2-Bedroom Condo with Open Space Views - Sold As-Is Welcome to this cute and inviting 2-bedroom, 1-bath condo in desirable Meadow Point Condos. Situated on the second floor with no neighbors above, this home offers privacy and peaceful views of the open space from your private deck. The functional floor plan features an eat-in kitchen with all kitchen appliances included, a cozy living room with a wood-burning fireplace, and the convenience of an in-unit washer and dryer. Several important updates have already been completed, including four newer windows, a sliding glass door, dishwasher, LVP flooring and water heater. Whether you're a first-time homebuyer, investor, or someone looking to add their personal touches, this property presents a wonderful opportunity to own in a great community at an attractive value. Don't miss your chance to enjoy comfortable condo living with scenic open space views and the opportunity to make this home your own!
Key facts
- Private deck
- Newer windows
- Eat-in kitchen
Tags
Property features AI
Finance
- HOA & community: Professionally managed association (Meadow Point Condo Association); Monthly association fee: $415; Association fee includes sewer, snow removal, trash, and water
Exterior
- Parking: Asphalt parking
- Security: Smoke detector(s)
- Utilities: Cable available; Electricity connected; Natural gas connected; Community sewer
- Home design: Condominium (low-rise 1–3 stories); End unit; Entry level: 2; One level
- Construction: Wood siding; Composition roof
- Exterior features: Balcony; Deck; Near public transit
Interior
- Kitchen: Dishwasher; Disposal; Microwave; Range; Refrigerator
- Bedrooms: 2 bedrooms (both on the main level)
- Flooring: Laminate
- Bathrooms: 1 three-quarter bathroom (main level)
- Heating & cooling: Forced air heating; Central air conditioning
- Interior features: Breakfast bar; Ceiling fan(s); Eat-in kitchen; Laminate counters; Primary suite; Living room fireplace
- Laundry & utility: Washer; Dryer
Neighborhood map
What this means for you Summary
Snapshot
- This is a 2-bed/1.0-bath condo listed at $204k.
Deal economics
- At list price, monthly cash flow is $-19 ($-224/yr) — negative.
- To cash-flow at today's rent, offer at most $201k (1.6% below list).
- Meets the 1% rule at list price ($2k rent vs $204k).
- Recommended offer: $201k (1.6% below list) — sets the bar for cash-flow.
- Cap rate 6.2% vs local median 3.3% in Aurora — top-decile yield for the area; either an underpriced asset or a hidden risk that comps aren't pricing in. Stress-test before assuming the spread holds.
Location & tenants
- Location reads 72/100 on livability (#70 in CO) — a middle-class / working-renter tenant base. Strengths: commute A+, housing A+, employment A-; Watch: crime F, cost of living F.
- Cherry Creek School District No. 5 In The County Of Arapah (urban): math 40% / reading 58% proficiency, ranked #11 of 86 in CO (top 13%) — families likely to look elsewhere, expect single-tenant / working-renter base with shorter leases.
- Zoned schools: Meadow Point Elementary School (math 5% / reading 17%, grade F, #879 of 966 statewide, top 94%, 400 students, 53% FRL); Falcon Creek Middle School (math 37% / reading 47%, grade D-, #69 of 270 statewide, top 27%, 687 students, 31% FRL); Grandview High School (math 53% / reading 80%, grade B, #28 of 381 statewide, top 7%, 2,774 students, 22% FRL).
- Market conditions: Rents soft (-2.4%/yr); 272 active listings in the ZIP; 13 comparable units currently listed for rent nearby; rentals leasing fast (median 13d on market — plan ~1-2 weeks tenant-placement turnaround); high-income renter base; 3,927 units permitted in Arapahoe County in 2024 (1,525 in 5+ unit buildings).
Forward outlook
- Local home prices are declining (-3.0%/yr); year-one equity from $1k of loan paydown is wiped out by about $6k of value loss. Plan a longer hold.
- Arapahoe County population projected at +39% by 2050 — long-run rental-demand tailwind backs the buy-and-hold thesis.
Negotiation context
- Only 11 days on market — expect competitive offers; lowballing is unlikely to land.
- 2 sale attempts with the ask held roughly flat each time — persistent listings suggest the price (not the market) is what's stuck; bring a comps-based counter.
- Current owner paid $94k; list at $204k implies a 116% gain — meaningful room to come down on a strong offer.
Questions for the listing agent
- What do current leases actually rent for vs. the listed asking? Can we see a recent rent roll and the last 12 months of T-12 income?
- What does the HOA fee cover, when was the last increase, and are there any pending special assessments or reserve-fund shortfalls?
- Any open or pending special assessments — roof, HVAC, plumbing, elevator, façade? What's the per-unit balance and payoff schedule, and is the seller paying it off at close or rolling it to the buyer?
- Is there a deadline driving the sale (1031 exchange, divorce, estate, relocation)? That informs how much negotiation room exists.
- Schools are D-rated, which usually means shorter tenancies and higher turnover. Who's the typical renter profile here, and what's been the actual vacancy rate?
- Crime grade is F in this area — have there been break-ins, vandalism, or insurance claims at this property in the last 3 years? What carrier currently insures it and at what premium?
- The area grade is low — what's the realistic commute time and amenity access for the typical tenant pool here? Any planned neighborhood developments (good or bad) we should know about?
- What's the average days-on-market for RENTAL listings here right now (not sales)? A rising rental-DOM trend means longer vacancies and softer asking-rent achievability than the comps imply.
- What's the recent tenant-quality profile in this submarket — average credit score on applications, eviction rate, late-payment / NSF rate, and stable-employment percentage? A property-management company in the area should have these aggregated.
- How much new apartment / multifamily construction is in the pipeline within 1–3 miles? Heavy new supply (>2% of stock underway) typically softens rents 12–24 months out; light construction supports rent growth.
Investment metrics
- 1% rule
- 1.03% ✓
- Cap rate
- 6.18%
- Cash-on-cash
- -0.39%
- DSCR
- 0.98
- GRM
- 8.1
CMA / ARV
No comps found within radius.
Projected returns pro-forma
-3.0% appreciation · 0.0% rent growth · sell at horizon
- IRR
- -20.9%
- Equity multiple
- 0.30×
- Total profit
- $-40,196
- Equity at exit
- $30,417
- IRR
- -25.7%
- Equity multiple
- -0.04×
- Total profit
- $-59,496
- Equity at exit
- $17,638
Cash invested: $57,120 (down + closing). Projections, not guarantees.
Landlord ↔ Tenant lean methodology
- Overall (STATE)
- 38 Tenant-Leaning
- State Colorado
- 38 Tenant-Leaning · D+4
- County
- — inherits STATE
- City
- — inherits STATE
ZIP-level market 80015
- Rents YoY
- -2.4%
- Active inventory
- 272
- Price-to-rent
- 8.1×
Monthly cashflow live
- Estimated rent
- $2,098 high interval (Pro) →
- Mortgage (P&I)
- −$1,070
- Tax from tax record
- −$106 /mo · $1,273/yr
- Insurance
- −$85
- HOA
- −$415
- Vacancy / Maint / Mgmt
- −$441
- Net cashflow
- $-19
Break-even live
Sensitivity live
| Price | -10% $97 | -5% $39 | +0% $-19 | +5% $-76 | +10% $-134 |
|---|---|---|---|---|---|
| Rent | -10% $-184 | -5% $-101 | +0% $-19 | +5% $64 | +10% $147 |
| Rate | -1.0pp $84 | -0.5pp $33 | base $-19 | +0.5pp $-71 | +1.0pp $-125 |
UW: 25.0% down · 7.5% · 30yr · 1.5% tax · 5.0% vac · 8.0% maint · 8.0% mgmt
Financing live
Cash to close
- Down payment
- $51,000
- Closing costs
- $6,120
- Reserves months
- —
- Total cash needed
- —
Loan-product check · same deal, 3 products live
Conventional
25% down · 7.5% · 30yr
- Down + closing
- —
- Monthly P&I
- —
- Monthly cashflow
- —
- DSCR
- —
- Eligible?
- —
Personal DTI + credit; lowest rate.
DSCR
20% down · 8.5% · 30yr
- Down + closing
- —
- Monthly P&I
- —
- Monthly cashflow
- —
- DSCR
- —
- Eligible?
- —
No personal income docs; deal must DSCR.
Hard money
10% down · 12.0% · 12mo
- Down + closing
- —
- Monthly P&I
- —
- Monthly cashflow
- —
- DSCR
- —
- Eligible?
- —
Short-term bridge; refi at stabilization.
Rent comps 13 comps
| Address | Beds | Baths | Sqft | Rent | $/sqft | DOM | Units | Dist |
|---|---|---|---|---|---|---|---|---|
| 4496 S Pagosa Cir Aurora, CO | 2.0 | 2.0 | 732 | $2,195 | $3.00 | 26d | 1 | 0.06mi |
| 17326 E Rice Cir Unit E Aurora, CO | 2.0 | 2.5 | 1088 | $2,200 | $2.02 | 26d | 1 | 0.06mi |
| 17375 E Rice Cir Unit A Aurora, CO | 2.0 | 1.0 | 998 | $1,850 | $1.85 | 7d | 1 | 0.08mi |
| 4283 S Salida Way #14 Aurora, CO | 2.0 | 1.0 | 913 | $1,550 | $1.70 | 0d | 1 | 0.40mi |
| 17502 E Whitaker Dr Aurora, CO | 3.0 | 2.0 | 1100 | $2,475 | $2.25 | 13d | 1 | 0.60mi |
| 17600 E Loyola Dr Unit 1521R Aurora, CO | 1.0 | 1.0 | 800 | $1,495 | $1.87 | 12d | 1 | 0.60mi |
| 16515 E Wagon Trail Dr Aurora, CO | 1.0 | 1.0 | 786 | $700 | $0.89 | 26d | 1 | 0.61mi |
| 17672 E Loyola Dr Unit 2221R Aurora, CO | 1.0 | 1.0 | 800 | $1,495 | $1.87 | 26d | 1 | 0.71mi |
| 4351 S Andes Way Aurora, CO | 2.0 | 2.5 | 1106 | $2,100 | $1.90 | 22d | 1 | 0.79mi |
| 18625 E Saratoga Pl Aurora, CO | 2.0 | 1.0 | 988 | $1,795 | $1.82 | 7d | 1 | 0.97mi |
| 18792 E Union Pl Aurora, CO | 1.0 | 1.0 | 800 | $1,499 | $1.87 | 13d | 1 | 1.00mi |
| 4404 S Hannibal Way Aurora, CO | 1.0–2.0 | 1.0 | 721 | $1,650 | $2.29 | 26d | 1 | 1.20mi |
| 3504 S Zeno Way Aurora, CO | 2.0 | 2.0 | 1070 | $1,792 | $1.67 | 7d | 4 | 1.40mi |
HOA detail condo
- Monthly dues
- $415 · $4,980/yr
- Likely covers
- water
- Assessments
- None detected in remarks — confirm with the listing agent.
Listing history 8 events
-
2026-06-21days on market $203,999 Active 11 DOM
-
2026-06-18days on market $203,999 Active 8 DOM
-
2026-06-17days on market $203,999 Active 7 DOM
-
2026-06-16days on market $203,999 Active 6 DOM
-
2026-06-15days on market $203,999 Active 5 DOM
-
2026-06-13days on market $203,999 Active 3 DOM
-
2026-06-13remarks 693-char remark
-
2026-06-13$203,999 Active 2 DOM
ⓘ Source: listings_history table (triggers on properties + properties_extension) + one-shot
backfill from property_details.listing_events for pre-trigger history.
Tax reassessment forecast CO · Resets to sale price
- Current annual tax
- $1,273 · $106/mo
- Projected year-2 tax
- $1,273 · $106/mo
- Expected delta
- $0/yr ($0/mo · 0.0%)
ⓘ Screening estimate from a state-policy table — verify with the county assessor before closing.
Climate risk First Street
- Flood 1/10 Low FEMA zone X (unshaded) · 0% chance over 30 yrs
- Wildfire 2/10 Low
- Heat 3/10 Moderate 6 d/yr ≥91°F today · 16 d/yr by 30 yrs out
- Wind 2/10 Low
- Air quality 2/10 Low 0 unhealthy d/yr today · 2 by 30 yrs out
Nearby sold comps map
Loading sold comps map…
Walkable amenities ~0.75 mi
Loading nearby amenities…
Taxation est. · year 1
- Rental income
- $25,174
- − Mortgage interest
- −$11,427
- − Property taxes
- −$1,273
- − Insurance
- −$1,020
- − Repairs & maintenance
- −$2,014
- − Management
- −$2,014
- − HOA
- −$4,980
- − Depreciation
- −$5,935
- Taxable loss
- −$3,489
- Est. tax savings @ 24.0%
- +$837
- After-tax cash flow
- $614/yr
For passive investors: Depreciation is non-cash, so a rental often shows a tax loss while cash-flowing — sheltering income. Rental losses are passive: they offset passive income freely, and up to $25,000/yr can offset ordinary (W-2) income if you actively participate and your MAGI is under $100k (phasing out to $0 by $150k); unused losses carry forward. On sale, claimed depreciation is recaptured at up to 25%, and gains may owe capital-gains tax (a 1031 exchange can defer both). Figures are a year-1 estimate at your 24.0% rate — not tax advice; consult a CPA.
Schools (NCES district)
- District
- Cherry Creek School District No. 5 In The County Of Arapah
- NCES district ID
- 0802910
- Math proficiency
- 40% ▼ -4.00%
- Reading proficiency
- 58% ▲ 5.00%
- Median HH income
- $73,326
- Composite
- 44.12/100
- National rank
- #2866
- State rank
- #11 of 86 in CO
Livability — Aurora
- Score
- 72/100
- State rank
- #70
- US rank
- #6441
Category grades
Schools grade is shown separately in the Schools card above.
Census & demographics
- Census place
- Aurora, CO
- County
- Arapahoe County · 715,018 people
- City population
- 397,430
- Metro
- Denver-Aurora-Lakewood, CO
- Population (ZIP)
- 72,316
- Household income
- $124,702
- Rent vs Own
- Severe rent burden
- 1012.0
Population outlook (Arapahoe County) Hauer SSP2
- Today (2025)
- 757,407 people
- By 2030
- 819,724 · +8.2%
- By 2040
- 940,367 · +24.2%
- By 2050
- 1,053,720 · +39.1%
- By 2075
- 1,297,693 · +71.3%
- By 2100
- 1,412,796 · +86.5%
Race, ethnicity, and origin ACS 2023
- Neighborhood character
- Diverse neighborhood (Simpson 0.59)
- Race & ethnicity
- White 61% Hispanic / Latino 16% Two or more races 11% Black 9% Asian 9%
- Hispanic origin (detail)
- Mexican 11% Puerto Rican 1%
- Common ancestry
- Italian 4% Lithuanian 2% Romanian 2%
- Foreign-born
- 15% · Canada, South Korea, China
- Languages at home
- 79% English-only · Spanish 8% Other Indo-European 2% Korean 2%
Political lean MEDSL · Arapahoe
- 2024 margin
- Strong D (+20.1) · D 58.6% · R 38.5% · Other 2.9%
- 2008→2024 swing
- +7.2pp toward D · 2008: 12.9pp · 2024: 20.1pp
- All cycles
- 2024: D+20.1 2020: D+24.6 2016: D+13.8 2012: D+8.3 2008: D+12.9
Not yet ingested
- Civics
- —
Market trends
- HPI YoY
- ▼ -235.01%
- Current HPI
- 252.5903
- Rent YoY
- ▼ -2.37%
- Metro
- Denver-Aurora-Lakewood, CO
- State GDP YoY
- ▲ 1.95%
- F500 in state
- 14
Industry mix (Fortune 500 HQ in CO)
| Industry | F500 HQs | Revenue |
|---|---|---|
| Technology Distribution | 1 | $31B |
|
||
| Food / Agriculture | 1 | $18B |
|
||
| Packaging | 1 | $14B |
|
||
| Healthcare | 1 | $13B |
|
||
| Energy | 1 | $10B |
|
||
| Technology | 1 | $4B |
|
||
Price history
+1002.7% since first listed5 events — show timeline
- 2026-06-10 Listed $203,999 IRES
- 2026-06-10 Listed $203,999 REColorado as Distributed by MLS Grid
- 2002-04-16 Sold (Public Records) $94,300 Public Records
- 1998-08-24 Sold (Public Records) $57,500 Public Records
- 1988-11-16 Sold (Public Records) $18,500 Public Records
Property tax history
+7.3%/yrLatest (2025): $1,273 · +29.1% YoY. Source: county tax records.
Cash-flow waterfall
monthlySold comps — $/sqft
last 12 mo · ≤1 miLoading sold comps…