28 Mecca Drive Plan · Cathedral City, CA
Flood risk 1/10 · Minimal
- FEMA flood zone
- X
- Chance of flooding over 30 yrs
- 0.0%
- Est. flood insurance / yr
- $507 – $1,088
Fire risk 4/10 · Minor
- Est. fire insurance / yr
- $659 – $1,223
Heat risk 9/10 · Severe
- Hot days now (above 113°F)
- 7 days/yr
- Hot days in 30 yrs
- 20 days/yr
Wind risk 1/10 · Minimal
- Chance of severe wind over 30 yrs
- —
Air-quality risk 5/10 · Moderate
- Unhealthy air days now
- 6 days/yr
- Unhealthy air days in 30 yrs
- 8 days/yr
Risk factors via First Street. Map © Google.
Why this score? — see what drove the B grade
The composite is a weighted blend of 9 inputs, each scored 0–100. Each bar is that input's sub-score; the figure is the points it added to the 100-point composite (weight × sub-score).
- Cash flow +30.0/30.0
- 1% rule +10.0/10.0
- DSCR +10.0/10.0
- ARV discount +7.5/15.0
- Condition / age +5.0/5.0
- Rent growth +3.3/5.0
- Livability +3.3/5.0
- Schools +2.7/10.0
- Appreciation +0.0/10.0
$169,995
🖨 Deal sheet (PDF) 📄 Offer letter ✓ Due diligence
Listing remarks MLS
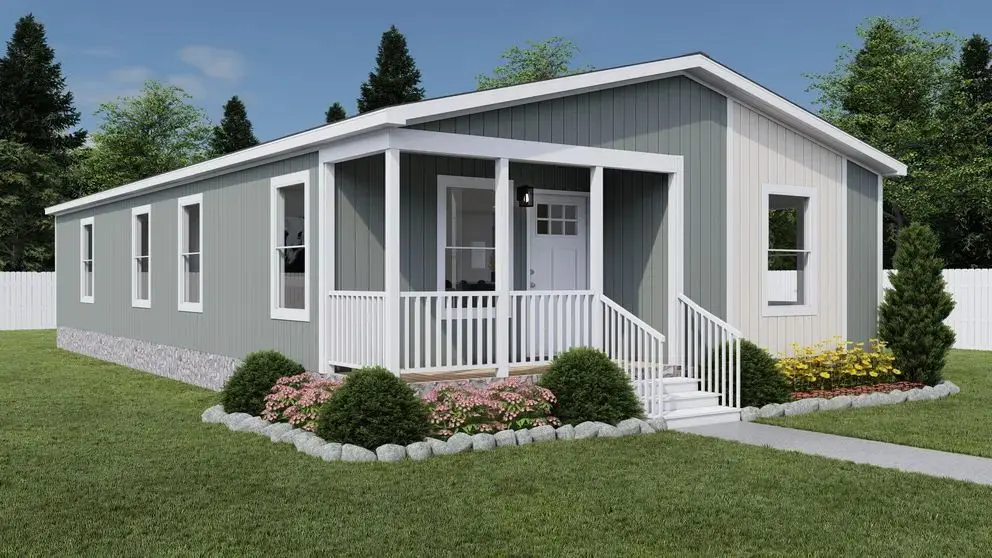
New 2025 Clayton Trade name Johnny B Goode 3 bedroom, 2 baths. Double wide home 26 X 52 1352 sq. ft. se. is (Approximate). Nice size pantry, Appliances Include Stainless Steel Fridge, dishwasher, Range/oven, Micro wave, A/C & Heating. Open Kitchen with an eat Island. Located in Caliente Sands 35100 Date Palm Drive, Cathedral City CA 92234. 55+ Community. Community Home has Beautiful mountain views Community offers many activities, Clubhouse, Full Kitchen, Library, Pool, Spa, Sauna, Laundry Facility, dog park for the enjoyment of your pets. Call us today for an appointment to view this beautiful home. this home will not last! * Photos are for illustrative purposes until actual images of home are available.
Key facts
- Nice size pantry
- Full kitchen
- Clubhouse
Tags
Neighborhood map
What this means for you Summary
Snapshot
- This is a 3-bed/2.0-bath manufactured listed at $170k. Condition is rated excellent.
Deal economics
- At list price, monthly cash flow is $1k ($13k/yr) — positive.
- The deal already cash-flows at list — no discount required.
- Meets the 1% rule at list price ($3k rent vs $170k).
- Recommended offer: $150k (12.0% below list) — sets the bar for market timing.
- Cap rate 13.9% vs local median 5.1% in Cathedral City — top-decile yield for the area; either an underpriced asset or a hidden risk that comps aren't pricing in. Stress-test before assuming the spread holds.
Location & tenants
- Location reads 66/100 on livability (#344 in CA) — a middle-class / working-renter tenant base. Strengths: commute A+, housing B+; Watch: employment D+, amenities D-, cost of living F.
- Palm Springs Unified (suburban): math 21% / reading 42% proficiency, ranked #328 of 517 in CA (top 63%) — families likely to look elsewhere, expect single-tenant / working-renter base with shorter leases; 73% free/reduced lunch — lower-income household profile, screen leases tightly.
- Zoned schools: Cathedral City Elementary (math 12% / reading 24%, grade F, #1,322 of 1,571 statewide, top 85%, 653 students, 98% FRL); Nellie N. Coffman Middle (953 students, 98% FRL); Cathedral City High (math 25% / reading 61%, grade F, #460 of 1,170 statewide, top 40%, 1,395 students, 98% FRL) — zoned schools average 98% FRL vs 73% district-wide (25 pts higher); higher-poverty schools than district average — tighter screening recommended.
- Market conditions: Rents rising (+3.2%/yr); 529 active listings in the ZIP; 40 comparable units currently listed for rent nearby; rentals at typical pace (median 26d on market — plan ~3-4 weeks tenant-placement turnaround); 42% of comp listings sitting > 30 days — soft ceiling on asking rent; 9,195 units permitted in Riverside County in 2024 (1,512 in 5+ unit buildings).
- At $2,852/mo this rent would consume 47% of the median local household income ($74k/yr) (locally 1682% of renters already pay >50% of income on rent) — very limited rent-growth headroom before tenants either downsize or default.
Forward outlook
- Local home prices are declining (-3.0%/yr); year-one equity from $1k of loan paydown is wiped out by about $5k of value loss. Plan a longer hold.
- Riverside County population projected at +22% by 2050 — long-run rental-demand tailwind backs the buy-and-hold thesis.
- At projected returns (-3.0% appreciation + 3.2% rent growth), your $48k cash investment doubles in ~5 years — after that, you're playing with house money.
Negotiation context
- It's been on market 459 days — a 12% lower offer ($150k) is reasonable based on typical stale-listing flexibility.
Risks & watch-outs
- Climate carrying-cost: extreme-heat days projected 7→20/yr by 2055 (HVAC capex compounding) — expect insurance premiums to compound above CPI over the hold.
Questions for the listing agent
- It's been on market 459 days. Have you received any prior offers? Is the seller open to a 12% concession, seller financing, or rate buy-down credit?
- Why hasn't it sold? Are there any deal-killer items the seller is aware of (foundation, flood, title, zoning, code violations)?
- Is there a deadline driving the sale (1031 exchange, divorce, estate, relocation)? That informs how much negotiation room exists.
- Schools are F-rated, which usually means shorter tenancies and higher turnover. Who's the typical renter profile here, and what's been the actual vacancy rate?
- What's the average days-on-market for RENTAL listings here right now (not sales)? A rising rental-DOM trend means longer vacancies and softer asking-rent achievability than the comps imply.
- What's the recent tenant-quality profile in this submarket — average credit score on applications, eviction rate, late-payment / NSF rate, and stable-employment percentage? A property-management company in the area should have these aggregated.
- How much new for-sale + rental construction is in the pipeline within 1–3 miles? Heavy new supply typically softens prices + rents 12–24 months out; constrained supply supports both.
Investment metrics
- 1% rule
- 1.68% ✓
- Cap rate
- 13.91%
- Cash-on-cash
- 27.19%
- DSCR
- 2.21
- GRM
- 5.0
CMA / ARV
- ARV (median comp)
- $81,977
- List price
- $169,995
- Delta
- 107.37%
- Verdict
- OVERPRICED
- Comps
- 20 within 1.0 mi
Show comp detail 12 sales within ~0.75 mi
| Address | Dist | Beds/Ba | Sqft | Sold | Price | $/sf | Match |
|---|---|---|---|---|---|---|---|
| 24 Mesa View Dr | 0.06mi | 2/2.0 (-1) | 1,440 (+6%) | 2mo | $68,000 | $47 | 79 |
| 392 Standing Bear | 0.28mi | 2/2.0 (-1) | 1,368 (+1%) | 2mo | $113,000 | $83 | 78 |
| 257 Wolf | 0.14mi | 2/2.0 (-1) | 1,440 (+6%) | 3mo | $75,000 | $52 | 75 |
| 89 Armenia Dr | 0.47mi | 2/2.0 (-1) | 1,416 (+5%) | 3mo | $177,000 | $125 | 62 |
| 244 Settles Dr | 0.57mi | 2/2.0 (-1) | 1,440 (+6%) | 1mo | $135,000 | $94 | 57 |
| 153 Estrada Way | 0.63mi | 2/2.0 (-1) | 1,440 (+6%) | 1mo | $46,500 | $32 | 54 |
| 126 Via Valverde | 0.59mi | 2/2.0 (-1) | 1,440 (+6%) | 2mo | $179,500 | $125 | 54 |
| 35 N Paseo Laredo | 0.60mi | 2/2.0 (-1) | 1,440 (+6%) | 4mo | $157,000 | $109 | 53 |
| 67 Paseo Laredo North | 0.66mi | 2/2.0 (-1) | 1,440 (+6%) | 1mo | $55,000 | $38 | 53 |
| 32 Coble Dr | 0.44mi | 2/1.5 (-1) | 1,152 (-15%) | 1mo | $155,000 | $135 | 47 |
| 162 Hilligoss Dr | 0.60mi | 2/2.0 (-1) | 1,504 (+11%) | 3mo | $66,000 | $44 | 46 |
| 234 Settles Dr | 0.63mi | 2/2.0 (-1) | 1,512 (+12%) | 3mo | $117,000 | $77 | 44 |
Match score weights: distance 35% · size 25% · config 20% · recency 20%. Top-matched comps best support the ARV.
Projected returns pro-forma
-3.0% appreciation · 3.22% rent growth · sell at horizon
- IRR
- 21.4%
- Equity multiple
- 1.88×
- Total profit
- $41,811
- Equity at exit
- $25,347
- IRR
- 29.7%
- Equity multiple
- 3.68×
- Total profit
- $127,630
- Equity at exit
- $14,698
Cash invested: $47,599 (down + closing). Projections, not guarantees.
Landlord ↔ Tenant lean methodology
- Overall (STATE)
- 18 Strongly Tenant-Friendly
- State California
- 18 Strongly Tenant-Friendly · D+13
- County
- — inherits STATE
- City
- — inherits STATE
ZIP-level market 92234
- Home prices YoY
- -27.7%
- Rents YoY
- 3.2%
- Active inventory
- 529
- Price-to-rent
- 5.0×
Monthly cashflow live
- Estimated rent
- $2,852 high interval (Pro) →
- Mortgage (P&I)
- −$891
- Tax est. 1.5%
- −$212 /mo · $2,550/yr
- Insurance
- −$71
- HOA
- −$0
- Vacancy / Maint / Mgmt
- −$599
- Net cashflow
- $1,078
Break-even live
Sensitivity live
| Price | -10% $1,196 | -5% $1,137 | +0% $1,078 | +5% $1,020 | +10% $961 |
|---|---|---|---|---|---|
| Rent | -10% $853 | -5% $966 | +0% $1,078 | +5% $1,191 | +10% $1,304 |
| Rate | -1.0pp $1,164 | -0.5pp $1,122 | base $1,078 | +0.5pp $1,034 | +1.0pp $990 |
UW: 25.0% down · 7.5% · 30yr · 1.5% tax · 5.0% vac · 8.0% maint · 8.0% mgmt
Financing live
Cash to close
- Down payment
- $42,499
- Closing costs
- $5,100
- Reserves months
- —
- Total cash needed
- —
Loan-product check · same deal, 3 products live
Conventional
25% down · 7.5% · 30yr
- Down + closing
- —
- Monthly P&I
- —
- Monthly cashflow
- —
- DSCR
- —
- Eligible?
- —
Personal DTI + credit; lowest rate.
DSCR
20% down · 8.5% · 30yr
- Down + closing
- —
- Monthly P&I
- —
- Monthly cashflow
- —
- DSCR
- —
- Eligible?
- —
No personal income docs; deal must DSCR.
Hard money
10% down · 12.0% · 12mo
- Down + closing
- —
- Monthly P&I
- —
- Monthly cashflow
- —
- DSCR
- —
- Eligible?
- —
Short-term bridge; refi at stabilization.
Rent comps 40 comps
| Address | Beds | Baths | Sqft | Rent | $/sqft | DOM | Units | Dist |
|---|---|---|---|---|---|---|---|---|
| 69200 Nilda Dr Cathedral City, CA | 3.0 | 2.0 | 1330 | $2,495 | $1.88 | 23d | 1 | 0.16mi |
| 34750 Marcia Rd Unit 02 Cathedral City, CA | 3.0 | 2.0 | 1325 | $2,000 | $1.51 | 19d | 1 | 0.18mi |
| 68859 Paseo Real Cathedral City, CA | 2.0 | 2.0 | 1406 | $3,960 | $2.82 | 45d | 1 | 0.23mi |
| 68859 Paseo Real Cathedral City, CA | 2.0 | 2.0 | 1406 | $3,960 | $2.82 | 16d | 1 | 0.23mi |
| 69180 Victoria Dr #8 Cathedral City, CA | 3.0 | 2.0 | 1230 | $1,995 | $1.62 | 4d | 1 | 0.32mi |
| 68882 Calle Mula Cathedral City, CA | 2.0 | 2.0 | 1714 | $2,500 | $1.46 | 22d | 1 | 0.42mi |
| 69155 Dinah Shore Dr Cathedral City, CA | 2.0 | 2.0 | 1100 | $1,795 | $1.63 | 45d | 1 | 0.46mi |
| 69155 Dinah Shore Dr Apt 20 Cathedral City, CA | 2.0 | 2.0 | 1200 | $2,050 | $1.71 | 45d | 1 | 0.47mi |
| 35200 Cathedral Canyon Dr Unit H64 Cathedral City, CA | 2.0 | 2.0 | 1375 | $2,500 | $1.82 | 45d | 1 | 0.47mi |
| 68615 Paseo Soria Cathedral City, CA | 2.0 | 2.0 | 1462 | $3,500 | $2.39 | 9d | 1 | 0.50mi |
| 35200 Cathedral Canyon Dr Unit B10 Cathedral City, CA | 2.0 | 2.0 | 1384 | $2,600 | $1.88 | 45d | 1 | 0.53mi |
| 69603 Heather Way Rancho Mirage, CA | 3.0 | 2.0 | 1218 | $2,300 | $1.89 | 45d | 1 | 0.64mi |
| 152 Estrada Way #152 Cathedral City, CA | 2.0 | 2.0 | 1500 | $2,200 | $1.47 | 45d | 1 | 0.65mi |
| 36040 Avenida de las Montanas Unit E Cathedral City, CA | 2.0 | 2.0 | 1220 | $3,200 | $2.62 | 45d | 1 | 0.66mi |
| 69646 Antonia Way Rancho Mirage, CA | 2.0 | 2.0 | 966 | $2,450 | $2.54 | 20d | 1 | 0.66mi |
| 34197 Calle Mora Cathedral City, CA | 2.0 | 2.0 | 1171 | $2,300 | $1.96 | 12d | 1 | 0.67mi |
| 34197 Calle Mora Cathedral City, CA | 2.0 | 2.0 | 1171 | $2,300 | $1.96 | 15d | 1 | 0.67mi |
| 34197 Calle Mora Cathedral City, CA | 2.0 | 2.0 | 1171 | $2,300 | $1.96 | 23d | 1 | 0.67mi |
| 159 Estrada Way Cathedral City, CA | 3.0 | 2.0 | 1800 | $2,850 | $1.58 | 45d | 1 | 0.68mi |
| 34361 Denise Way Rancho Mirage, CA | 3.0 | 2.0 | 1400 | $2,800 | $2.00 | 45d | 1 | 0.69mi |
| 34073 Emily Way Rancho Mirage, CA | 2.0 | 2.0 | 966 | $2,100 | $2.17 | 19d | 1 | 0.73mi |
| 34073 Emily Way Rancho Mirage, CA | 2.0 | 2.0 | 966 | $2,100 | $2.17 | 23d | 1 | 0.73mi |
| 34071 Denise Way Rancho Mirage, CA | 3.0 | 2.0 | 1218 | $2,599 | $2.13 | 26d | 1 | 0.76mi |
| 68368 Calle Leon Cathedral City, CA | 2.0 | 2.0 | 1406 | $3,790 | $2.70 | 16d | 1 | 0.78mi |
| 68368 Calle Leon Cathedral City, CA | 2.0 | 2.0 | 1406 | $3,790 | $2.70 | 45d | 1 | 0.78mi |
| 68153 Lakeland Dr Cathedral City, CA | 2.0 | 2.0 | 1255 | $2,500 | $1.99 | 26d | 1 | 0.78mi |
| 33865 Cathedral Canyon Dr Cathedral City, CA | 4.0 | 3.0 | 1714 | $3,300 | $1.93 | 26d | 1 | 0.82mi |
| 33255 Date Palm Dr Cathedral City, CA | 2.0 | 2.0 | 1050 | $1,795 | $1.71 | 45d | 1 | 0.84mi |
| 33909 Navajo Trl Cathedral City, CA | 4.0 | 2.0 | 1684 | $3,400 | $2.02 | 45d | 1 | 0.90mi |
| 33892 Sky Blue Water Trl Cathedral City, CA | 3.0 | 2.0 | 1352 | $2,800 | $2.07 | 6d | 1 | 0.92mi |
| 33495 Cathedral Canyon Dr Cathedral City, CA | 2.0 | 1.0 | 1100 | $2,200 | $2.00 | 45d | 1 | 0.96mi |
| 33495 Cathedral Canyon Dr Unit B Cathedral City, CA | 2.0 | 1.0 | 1100 | $2,100 | $1.91 | 45d | 1 | 0.96mi |
| 250 S Paseo Laredo Cathedral City, CA | 2.0 | 2.0 | 1600 | $1,800 | $1.12 | 14d | 1 | 1.10mi |
| 251 S Paseo Laredo Cathedral City, CA | 2.0 | 2.0 | 1440 | $2,400 | $1.67 | 45d | 1 | 1.12mi |
| 33387 Shifting Sands Trl Unit 2 Cathedral City, CA | 2.0 | 2.0 | 1300 | $1,999 | $1.54 | 26d | 1 | 1.22mi |
| 35082 Mission Hills Dr Rancho Mirage, CA | 2.0 | 2.5 | 1624 | $3,250 | $2.00 | 14d | 1 | 1.30mi |
| 35090 Mission Hills Dr Rancho Mirage, CA | 2.0 | 2.0 | 1596 | $3,950 | $2.47 | 26d | 1 | 1.30mi |
| 6134 Arroyo Rd #6 Palm Springs, CA | 4.0 | 2.5 | 1551 | $3,500 | $2.26 | 45d | 1 | 1.31mi |
| 8 Mission Ct Rancho Mirage, CA | 2.0 | 2.0 | 1540 | $2,500 | $1.62 | 20d | 1 | 1.31mi |
| 35054 Mission Hills Dr Rancho Mirage, CA | 2.0 | 2.0 | 1396 | $2,549 | $1.83 | 6d | 1 | 1.32mi |
Listing history 16 events
-
2026-06-21days on market $169,995 Active 459 DOM
-
2026-06-18days on market $169,995 Active 456 DOM
-
2026-06-17days on market $169,995 Active 455 DOM
-
2026-06-16days on market $169,995 Active 454 DOM
-
2026-06-15days on market $169,995 Active 453 DOM
-
2026-06-13days on market $169,995 Active 451 DOM
-
2026-06-13days on market $169,995 Active 450 DOM
-
2026-06-09days on market $169,995 Active 447 DOM
-
2026-06-08days on market $169,995 Active 446 DOM
-
2026-06-07days on market $169,995 Active 445 DOM
-
2026-06-04days on market $169,995 Active 442 DOM
-
2026-06-03days on market $169,995 Active 441 DOM
-
2026-06-02days on market $169,995 Active 440 DOM
-
2026-06-01days on market $169,995 Active 439 DOM
-
2026-05-31days on market $169,995 Active 438 DOM
-
2025-03-19$169,995 Active 721-char remark
Show marketing remark (721 chars)
New 2025 Clayton Trade name Johnny B Goode 3 bedroom, 2 baths. Double wide home 26 X 52 1352 sq. ft. se. is (Approximate). Nice size pantry, Appliances Include Stainless Steel Fridge, dishwasher, Range/oven, Micro wave, A/C & Heating. Open Kitchen with an eat Island. Located in Caliente Sands 35100 Date Palm Drive, Cathedral City CA 92234. 55+ Community. Community Home has Beautiful mountain views Community offers many activities, Clubhouse, Full Kitchen, Library, Pool, Spa, Sauna, Laundry Facility, dog park for the enjoyment of your pets. Call us today for an appointment to view this beautiful home. this home will not last! * Photos are for illustrative purposes until actual images of home are available.
ⓘ Source: listings_history table (triggers on properties + properties_extension) + one-shot
backfill from property_details.listing_events for pre-trigger history.
Climate risk First Street
- Flood 1/10 Low FEMA zone X · 0% chance over 30 yrs
- Wildfire 4/10 Moderate
- Heat 9/10 Extreme 7 d/yr ≥113°F today · 20 d/yr by 30 yrs out
- Wind 1/10 Low
- Air quality 5/10 Major 6 unhealthy d/yr today · 8 by 30 yrs out
Nearby sold comps map
Loading sold comps map…
Walkable amenities ~0.75 mi
Loading nearby amenities…
Taxation est. · year 1
- Rental income
- $34,225
- − Mortgage interest
- −$9,522
- − Property taxes
- −$2,550
- − Insurance
- −$850
- − Repairs & maintenance
- −$2,738
- − Management
- −$2,738
- − Depreciation
- −$4,945
- Taxable income
- $10,882
- Est. tax owed @ 24.0%
- −$2,612
- After-tax cash flow
- $10,329/yr
For passive investors: Depreciation is non-cash, so a rental often shows a tax loss while cash-flowing — sheltering income. Rental losses are passive: they offset passive income freely, and up to $25,000/yr can offset ordinary (W-2) income if you actively participate and your MAGI is under $100k (phasing out to $0 by $150k); unused losses carry forward. On sale, claimed depreciation is recaptured at up to 25%, and gains may owe capital-gains tax (a 1031 exchange can defer both). Figures are a year-1 estimate at your 24.0% rate — not tax advice; consult a CPA.
Condition & rehab AI · 3 photos
This manufactured home is in excellent condition with no visible repairs or maintenance needed. It offers a modern kitchen, well-maintained exterior, and a clean interior. Upgrades in paint, landscaping, and smart home features can further enhance its value.
Value-add opportunities
- Both Painting the exterior and interior walls — Fresh paint can enhance curb appeal and interior aesthetics.
- Both Landscaping improvements — Enhanced landscaping can improve curb appeal and attract potential buyers/tenants.
- Both Upgrading the kitchen appliances — Modernizing the kitchen can increase both resale and rental value.
- Both Adding smart home features — Smart home features can increase both resale and rental value by attracting tech-savvy buyers/tenants.
- Both Upgrading the flooring in the bathrooms — Upgrading the flooring can improve the overall aesthetic and functionality of the bathrooms, increasing both resale and rental value.
Renovation cost estimate screening
Value-add ROI direction
- Both Painting the exterior and interior walls — Fresh paint can enhance curb appeal and interior aesthetics. ↑
- Both Landscaping improvements — Enhanced landscaping can improve curb appeal and attract potential buyers/tenants. ↑
- Both Upgrading the kitchen appliances — Modernizing the kitchen can increase both resale and rental value. ↑
- Both Adding smart home features — Smart home features can increase both resale and rental value by attracting tech-savvy buyers/tenants. ↑
- Both Upgrading the flooring in the bathrooms — Upgrading the flooring can improve the overall aesthetic and functionality of the bathrooms, increasing both resale and rental value. ↑
ⓘ Cost ranges are severity-bucket heuristics (US national rule-of-thumb). Get contractor quotes + a written scope before underwriting a rehab budget.
Schools (NCES district)
- District
- Palm Springs Unified
- NCES district ID
- 0629550
- Math proficiency
- 21% ▼ -7.00%
- Reading proficiency
- 42% ▬ 0.00%
- Median HH income
- $43,638
- Composite
- 26.76/100
- National rank
- #7131
- State rank
- #328 of 517 in CA
Livability — Cathedral City
- Score
- 66/100
- State rank
- #344
- US rank
- #11749
Category grades
Schools grade is shown separately in the Schools card above.
Census & demographics
- Census place
- Cathedral City, CA
- County
- Riverside County · 2,287,001 people
- City population
- 52,267
- Metro
- Riverside-San Bernardino-Ontario, CA
- Population (ZIP)
- 52,267
- Household income
- $73,572
- Rent vs Own
- Severe rent burden
- 1682.0
Population outlook (Riverside County) Hauer SSP2
- Today (2025)
- 2,664,475 people
- By 2030
- 2,802,692 · +5.2%
- By 2040
- 3,050,904 · +14.5%
- By 2050
- 3,256,783 · +22.2%
- By 2075
- 3,655,058 · +37.2%
- By 2100
- 3,766,594 · +41.4%
Race, ethnicity, and origin ACS 2023
- Neighborhood character
- Diverse neighborhood (Simpson 0.56)
- Race & ethnicity
- Hispanic / Latino 59% White 30% Two or more races 27% Asian 6% Native American 2% Black 2%
- Hispanic origin (detail)
- Mexican 51%
- Common ancestry
- Lithuanian 2% Romanian 1% Italian 1%
- Foreign-born
- 28% · Canada, Vietnam
- Languages at home
- 48% English-only · Spanish 46% Tagalog/Filipino 3% Other Asian/Pacific 1%
Political lean MEDSL · Riverside
- 2024 margin
- Toss-up / Even · D 48.0% · R 49.3% · Other 2.6%
- 2008→2024 swing
- -3.6pp toward R · 2008: 2.3pp · 2024: -1.3pp
- All cycles
- 2024: R+1.3 2020: D+8.0 2016: D+4.3 2012: R+0.4 2008: D+2.3
Not yet ingested
- Civics
- —
Market trends
- HPI YoY
- ▼ -136.57%
- Current HPI
- 356.9845
- Rent YoY
- ▲ 3.22%
- Metro
- Riverside-San Bernardino-Ontario, CA
- State GDP YoY
- ▲ 3.21%
- F500 in state
- 116
Industry mix (Fortune 500 HQ in CA)
| Industry | F500 HQs | Revenue |
|---|---|---|
| Technology | 27 | $1,492B |
|
||
| Financial Services | 3 | $174B |
|
||
| Retail | 3 | $44B |
|
||
| Insurance | 3 | $26B |
|
||
| Media / Entertainment | 2 | $115B |
|
||
| Pharmaceuticals / Biotech | 2 | $62B |
|
||
Price history
1 event — show timeline
- 2025-03-19 Listed $169,995 Zillow
Cash-flow waterfall
monthlySold comps — $/sqft
last 12 mo · ≤1 miLoading sold comps…