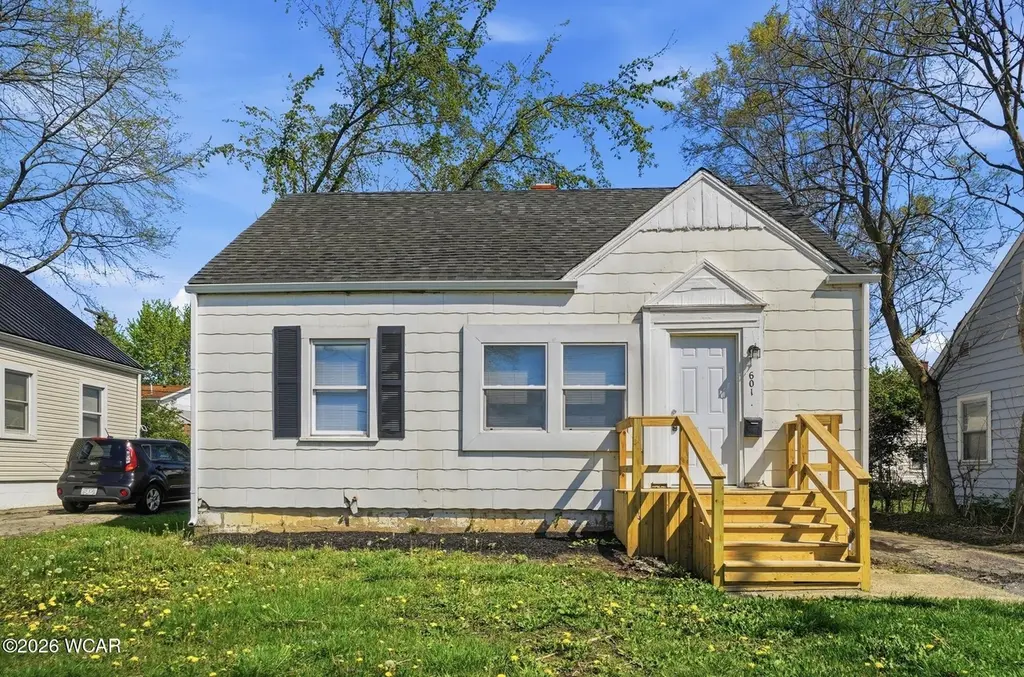
601 E 4th St · Lima, OH
Flood risk 1/10 · Minimal
- FEMA flood zone
- X (unshaded)
- Chance of flooding over 30 yrs
- 0.0%
- Est. flood insurance / yr
- $473 – $860
Fire risk 1/10 · Minimal
- Est. fire insurance / yr
- $713 – $1,323
Heat risk 3/10 · Minor
- Hot days now (above 100°F)
- 7 days/yr
- Hot days in 30 yrs
- 18 days/yr
Wind risk 2/10 · Minimal
- Chance of severe wind over 30 yrs
- —
Air-quality risk 2/10 · Minimal
- Unhealthy air days now
- 1 days/yr
- Unhealthy air days in 30 yrs
- 2 days/yr
Risk factors via First Street. Map © Google.
Why this score? — see what drove the C grade
The composite is a weighted blend of 9 inputs, each scored 0–100. Each bar is that input's sub-score; the figure is the points it added to the 100-point composite (weight × sub-score).
- Cash flow +29.6/30.0
- DSCR +10.0/10.0
- 1% rule +7.2/10.0
- Livability +3.2/5.0
- Schools +2.6/10.0
- Rent growth +2.5/5.0
- Condition / age +2.5/5.0
- ARV discount +0.0/15.0
- Appreciation +0.0/10.0
$79,900
🖨 Deal sheet (PDF) 📄 Offer letter ✓ Due diligence
Listing remarks MLS
Welcome to a newly renovated residential property offering a functional layout with comfortable living space. This home features total of 3 bedrooms, a renovated full bathroom downstairs along with two of the bedrooms, a spacious living area, and an updated kitchen with ample storage and new flooring. Floor plan provides good balance between living and sleeping areas. Home offers privet off street parking, nice size backyard for you to enjoy and unfinished basement that is the full footprint of home for storage. Contact your real estate agent for full list of updates and for a showing today!
Key facts
- Nice size backyard
- Unfinished basement
- Updated kitchen
Tags
Neighborhood map
What this means for you Summary
Snapshot
- This is a 3-bed/1.0-bath single-family listed at $80k.
Deal economics
- At list price, monthly cash flow is $288 ($3k/yr) — positive.
- The deal already cash-flows at list — no discount required.
- Meets the 1% rule at list price ($975 rent vs $80k).
- Recommended offer: $78k (3.0% below list) — sets the bar for market timing.
- Cap rate 10.6% vs local median 7.6% in Lima — top-decile yield for the area; either an underpriced asset or a hidden risk that comps aren't pricing in. Stress-test before assuming the spread holds.
Location & tenants
- Location reads 64/100 on livability (#787 in OH) — a middle-class / working-renter tenant base. Strengths: cost of living A+, housing A+, health & safety A-; Watch: crime F, amenities F, commute F.
- Lima City (urban): math 29% / reading 36% proficiency, ranked #575 of 656 in OH (top 88%) — families likely to look elsewhere, expect single-tenant / working-renter base with shorter leases; 83% free/reduced lunch — lower-income household profile, screen leases tightly.
- Zoned schools: Liberty Arts Magnet K-8 (math 40% / reading 46%, grade F, #1,023 of 1,584 statewide, top 65%, 416 students, 0% FRL); Lima West Middle School (math 22% / reading 24%, grade F, #600 of 654 statewide, top 92%, 352 students, 0% FRL); Lima Senior High School (math 16% / reading 42%, grade F, #627 of 781 statewide, top 81%, 1,013 students, 0% FRL) — zoned schools average 0% FRL vs 83% district-wide (83 pts lower); this property's tenant base skews higher-income than the district average.
- Market conditions: 79 active listings in the ZIP; 3 comparable units currently listed for rent nearby; rentals lingering (median 45d on market — plan ~5-8 weeks vacancy on turnover, expect pricing pressure); 100% of comp listings sitting > 30 days — soft ceiling on asking rent; lower-income renter base — watch delinquency; 88 units permitted in Allen County in 2024 (0 in 5+ unit buildings).
Forward outlook
- Local home prices are declining (-3.0%/yr); year-one equity from $552 of loan paydown is wiped out by about $2k of value loss. Plan a longer hold.
- Allen County population projected at -14% by 2050 — secular population decline; favor cash flow + early exit over multi-decade hold.
- At projected returns (-3.0% appreciation + 3.0% rent growth), your $22k cash investment doubles in ~8 years — after that, you're playing with house money.
Negotiation context
- It's been on market 60 days — a 3% lower offer ($78k) is reasonable based on typical stale-listing flexibility.
- Current owner paid $66k; 21% above their basis — modest negotiation headroom, anchor on the comps not their cost.
Risks & watch-outs
- Watch-outs: built in 1941 — expect roof / HVAC / electrical / plumbing capex.
Questions for the listing agent
- It's been on market 60 days. Have you received any prior offers? Is the seller open to a 3% concession, seller financing, or rate buy-down credit?
- Built in 1941 — when were the roof, HVAC, electrical panel, plumbing, and water heater last replaced?
- Is there a deadline driving the sale (1031 exchange, divorce, estate, relocation)? That informs how much negotiation room exists.
- Crime grade is F in this area — have there been break-ins, vandalism, or insurance claims at this property in the last 3 years? What carrier currently insures it and at what premium?
- What's the average days-on-market for RENTAL listings here right now (not sales)? A rising rental-DOM trend means longer vacancies and softer asking-rent achievability than the comps imply.
- What's the recent tenant-quality profile in this submarket — average credit score on applications, eviction rate, late-payment / NSF rate, and stable-employment percentage? A property-management company in the area should have these aggregated.
- How much new for-sale + rental construction is in the pipeline within 1–3 miles? Heavy new supply typically softens prices + rents 12–24 months out; constrained supply supports both.
Investment metrics
- 1% rule
- 1.22% ✓
- Cap rate
- 10.61%
- Cash-on-cash
- 15.43%
- DSCR
- 1.69
- GRM
- 6.8
CMA / ARV
- ARV (median comp)
- $53,969
- List price
- $79,900
- Delta
- 48.05%
- Verdict
- OVERPRICED
- Comps
- 20 within 1.0 mi
Show comp detail 12 sales within ~0.75 mi
| Address | Dist | Beds/Ba | Sqft | Sold | Price | $/sf | Match |
|---|---|---|---|---|---|---|---|
| 1411 Reese Ave | 0.21mi | 3/1.0 | 960 (-2%) | 1mo | $73,900 | $77 | 86 |
| 423 E 3rd St | 0.18mi | 2/1.0 (-1) | 987 (+1%) | 14mo | $56,250 | $57 | 73 |
| 1424 S Union St | 0.34mi | 2/1.0 (-1) | 1,028 (+5%) | 0mo | $119,200 | $116 | 70 |
| 1151 S Central Ave | 0.32mi | 3/1.0 | 938 (-4%) | 11mo | $99,900 | $107 | 69 |
| 1093 S Sugar St | 0.63mi | 3/1.0 | 925 (-6%) | 7mo | $115,000 | $124 | 56 |
| 839 St. John's Ave | 0.59mi | 3/1.0 | 1,056 (+8%) | 5mo | $24,000 | $23 | 55 |
| 1133 Simons Ave | 0.68mi | 3/1.0 | 936 (-4%) | 20mo | $60,000 | $64 | 44 |
| 1013 Simons Ave | 0.68mi | 3/1.0 | 925 (-6%) | 20mo | $63,500 | $69 | 42 |
| 318 E E. Vine. St | 0.65mi | 2/1.0 (-1) | 895 (-9%) | 12mo | $70,000 | $78 | 41 |
| 923 Michael Ave | 0.70mi | 3/1.0 | 912 (-7%) | 21mo | $135,000 | $148 | 39 |
| 600 Dingledine Ave | 0.70mi | 2/1.0 (-1) | 1,104 (+13%) | 5mo | $75,000 | $68 | 37 |
| 306 E Vine St | 0.65mi | 2/1.0 (-1) | 1,122 (+15%) | 7mo | $90,000 | $80 | 34 |
Match score weights: distance 35% · size 25% · config 20% · recency 20%. Top-matched comps best support the ARV.
Projected returns pro-forma
-3.0% appreciation · 3.0% rent growth · sell at horizon
- IRR
- 6.1%
- Equity multiple
- 1.24×
- Total profit
- $5,344
- Equity at exit
- $11,913
- IRR
- 15.5%
- Equity multiple
- 2.26×
- Total profit
- $28,128
- Equity at exit
- $6,908
Cash invested: $22,372 (down + closing). Projections, not guarantees.
Landlord ↔ Tenant lean methodology
- Overall (STATE)
- 73 Landlord-Friendly
- State Ohio
- 73 Landlord-Friendly · R+6
- County
- — inherits STATE
- City
- — inherits STATE
ZIP-level market 45804
- Active inventory
- 79
- Price-to-rent
- 6.8×
Monthly cashflow live
- Estimated rent
- $975 medium interval (Pro) →
- Mortgage (P&I)
- −$419
- Tax from tax record
- −$30 /mo · $364/yr
- Insurance
- −$33
- HOA
- −$0
- Vacancy / Maint / Mgmt
- −$205
- Net cashflow
- $288
Break-even live
Sensitivity live
| Price | -10% $333 | -5% $310 | +0% $288 | +5% $265 | +10% $242 |
|---|---|---|---|---|---|
| Rent | -10% $211 | -5% $249 | +0% $288 | +5% $326 | +10% $365 |
| Rate | -1.0pp $328 | -0.5pp $308 | base $288 | +0.5pp $267 | +1.0pp $246 |
UW: 25.0% down · 7.5% · 30yr · 1.5% tax · 5.0% vac · 8.0% maint · 8.0% mgmt
Financing live
Cash to close
- Down payment
- $19,975
- Closing costs
- $2,397
- Reserves months
- —
- Total cash needed
- —
Loan-product check · same deal, 3 products live
Conventional
25% down · 7.5% · 30yr
- Down + closing
- —
- Monthly P&I
- —
- Monthly cashflow
- —
- DSCR
- —
- Eligible?
- —
Personal DTI + credit; lowest rate.
DSCR
20% down · 8.5% · 30yr
- Down + closing
- —
- Monthly P&I
- —
- Monthly cashflow
- —
- DSCR
- —
- Eligible?
- —
No personal income docs; deal must DSCR.
Hard money
10% down · 12.0% · 12mo
- Down + closing
- —
- Monthly P&I
- —
- Monthly cashflow
- —
- DSCR
- —
- Eligible?
- —
Short-term bridge; refi at stabilization.
Rent comps 3 comps
| Address | Beds | Baths | Sqft | Rent | $/sqft | DOM | Units | Dist |
|---|---|---|---|---|---|---|---|---|
| 616 Hope St Lima, OH | 3.0 | 2.0 | 1079 | $975 | $0.90 | 45d | 1 | 0.08mi |
| 521 Hope St Lima, OH | 3.0 | 2.0 | 1079 | $975 | $0.90 | 45d | 1 | 0.09mi |
| 623 Hope St Lima, OH | 3.0 | 2.0 | 1079 | $975 | $0.90 | 45d | 1 | 0.10mi |
Listing history 23 events
-
2026-06-19days on market $79,900 Active 60 DOM
-
2026-06-18days on market $79,900 Active 59 DOM
-
2026-06-17days on market $79,900 Active 58 DOM
-
2026-06-17price $79,900 Active 57 DOM
-
2026-06-16days on market $85,400 Active 57 DOM
-
2026-06-15days on market $85,400 Active 56 DOM
-
2026-06-14days on market $85,400 Active 54 DOM
-
2026-06-12days on market $85,400 Active 53 DOM
-
2026-06-09days on market $85,400 Active 50 DOM
-
2026-06-08days on market $85,400 Active 49 DOM
-
2026-06-07days on market $85,400 Active 48 DOM
-
2026-06-07days on market $85,400 Active 47 DOM
-
2026-06-04days on market $85,400 Active 44 DOM
-
2026-06-02days on market $85,400 Active 43 DOM
-
2026-06-01days on market $85,400 Active 42 DOM
-
2026-05-31days on market $85,400 Active 41 DOM
-
2026-05-31days on market $85,400 Active 40 DOM
-
2026-04-28price $89,900 598-char remark
Show marketing remark (598 chars)
Welcome to a newly renovated residential property offering a functional layout with comfortable living space. This home features total of 3 bedrooms, a renovated full bathroom downstairs along with two of the bedrooms, a spacious living area, and an updated kitchen with ample storage and new flooring. Floor plan provides good balance between living and sleeping areas. Home offers privet off street parking, nice size backyard for you to enjoy and unfinished basement that is the full footprint of home for storage. Contact your real estate agent for full list of updates and for a showing today!
-
2026-04-20$99,900 Active 598-char remark
Show marketing remark (598 chars)
Welcome to a newly renovated residential property offering a functional layout with comfortable living space. This home features total of 3 bedrooms, a renovated full bathroom downstairs along with two of the bedrooms, a spacious living area, and an updated kitchen with ample storage and new flooring. Floor plan provides good balance between living and sleeping areas. Home offers privet off street parking, nice size backyard for you to enjoy and unfinished basement that is the full footprint of home for storage. Contact your real estate agent for full list of updates and for a showing today!
-
2021-08-02soldstatus $66,000
-
2002-06-14soldstatus $275,000
-
2002-06-14soldstatus $225,714
-
1994-07-27soldstatus $10,000
ⓘ Source: listings_history table (triggers on properties + properties_extension) + one-shot
backfill from property_details.listing_events for pre-trigger history.
Tax reassessment forecast OH · Partial reset (capped growth)
- Current annual tax
- $364 · $30/mo
- Projected year-2 tax
- $805 · $67/mo
- Expected delta
- +$441/yr (+$37/mo · 121.2%)
ⓘ Screening estimate from a state-policy table — verify with the county assessor before closing.
Climate risk First Street
- Flood 1/10 Low FEMA zone X (unshaded) · 0% chance over 30 yrs
- Wildfire 1/10 Low
- Heat 3/10 Moderate 7 d/yr ≥100°F today · 18 d/yr by 30 yrs out
- Wind 2/10 Low
- Air quality 2/10 Low 1 unhealthy d/yr today · 2 by 30 yrs out
Nearby sold comps map
Loading sold comps map…
Walkable amenities ~0.75 mi
Loading nearby amenities…
Taxation est. · year 1
- Rental income
- $11,700
- − Mortgage interest
- −$4,476
- − Property taxes
- −$364
- − Insurance
- −$400
- − Repairs & maintenance
- −$936
- − Management
- −$936
- − Depreciation
- −$2,324
- Taxable income
- $2,265
- Est. tax owed @ 24.0%
- −$543
- After-tax cash flow
- $2,908/yr
For passive investors: Depreciation is non-cash, so a rental often shows a tax loss while cash-flowing — sheltering income. Rental losses are passive: they offset passive income freely, and up to $25,000/yr can offset ordinary (W-2) income if you actively participate and your MAGI is under $100k (phasing out to $0 by $150k); unused losses carry forward. On sale, claimed depreciation is recaptured at up to 25%, and gains may owe capital-gains tax (a 1031 exchange can defer both). Figures are a year-1 estimate at your 24.0% rate — not tax advice; consult a CPA.
Schools (NCES district)
- District
- Lima City
- NCES district ID
- 3904422
- Math proficiency
- 29% ▼ -13.00%
- Reading proficiency
- 36% ▼ -6.00%
- Median HH income
- $29,685
- Composite
- 26.31/100
- National rank
- #7243
- State rank
- #575 of 656 in OH
Livability — Lima
- Score
- 64/100
- State rank
- #787
- US rank
- #14288
Category grades
Schools grade is shown separately in the Schools card above.
Census & demographics
- Census place
- Lima, OH
- County
- Allen · 98,169 people
- City population
- 21,739
- Metro
- Lima, OH
- Population (ZIP)
- 14,197
- Household income
- $42,594
- Rent vs Own
- Severe rent burden
- 8.1
Population outlook (Allen County) Hauer SSP2
- Today (2025)
- 100,321 people
- By 2030
- 97,693 · -2.6%
- By 2040
- 91,802 · -8.5%
- By 2050
- 86,152 · -14.1%
- By 2075
- 73,659 · -26.6%
- By 2100
- 58,716 · -41.5%
Race, ethnicity, and origin ACS 2023
- Neighborhood character
- Predominantly White (71%)
- Race & ethnicity
- White 71% Black 19% Two or more races 8% Hispanic / Latino 2%
- Common ancestry
- Italian 1% Slovak 1% Lithuanian 1%
- Foreign-born
- 1% · Canada
- Languages at home
- 99% English-only · Spanish 1%
Political lean MEDSL · Allen
- 2024 margin
- Solid R (+44.1) · D 27.5% · R 71.6%
- 2008→2024 swing
- -23.4pp toward R · 2008: -20.7pp · 2024: -44.1pp
- All cycles
- 2024: R+44.1 2020: R+39.5 2016: R+38.2 2012: R+25.7 2008: R+20.7
Not yet ingested
- Civics
- —
Market trends
- HPI YoY
- ▼ -124.39%
- Current HPI
- 126.4189
- Rent YoY
- —
- Metro
- —
- State GDP YoY
- ▲ 1.98%
- F500 in state
- 48
Industry mix (Fortune 500 HQ in OH)
| Industry | F500 HQs | Revenue |
|---|---|---|
| Insurance | 3 | $145B |
|
||
| Industrial Machinery | 3 | $49B |
|
||
| Financial Services | 3 | $24B |
|
||
| Consumer Goods | 2 | $93B |
|
||
| Aerospace / Defense | 2 | $47B |
|
||
| Utilities | 2 | $33B |
|
||
Price history
+799.0% since first listed6 events — show timeline
- 2026-04-28 Price Changed $89,900 WCARE
- 2026-04-20 Listed $99,900 WCARE
- 2021-08-02 Sold (Public Records) $66,000 Public Records
- 2002-06-14 Sold (Public Records) $225,714 Public Records
- 2002-06-14 Sold (Public Records) $275,000 Public Records
- 1994-07-27 Sold (Public Records) $10,000 Public Records
Property tax history
-6.3%/yrLatest (2025): $364 · +0.5% YoY. Source: county tax records.
Cash-flow waterfall
monthlySold comps — $/sqft
last 12 mo · ≤1 miLoading sold comps…