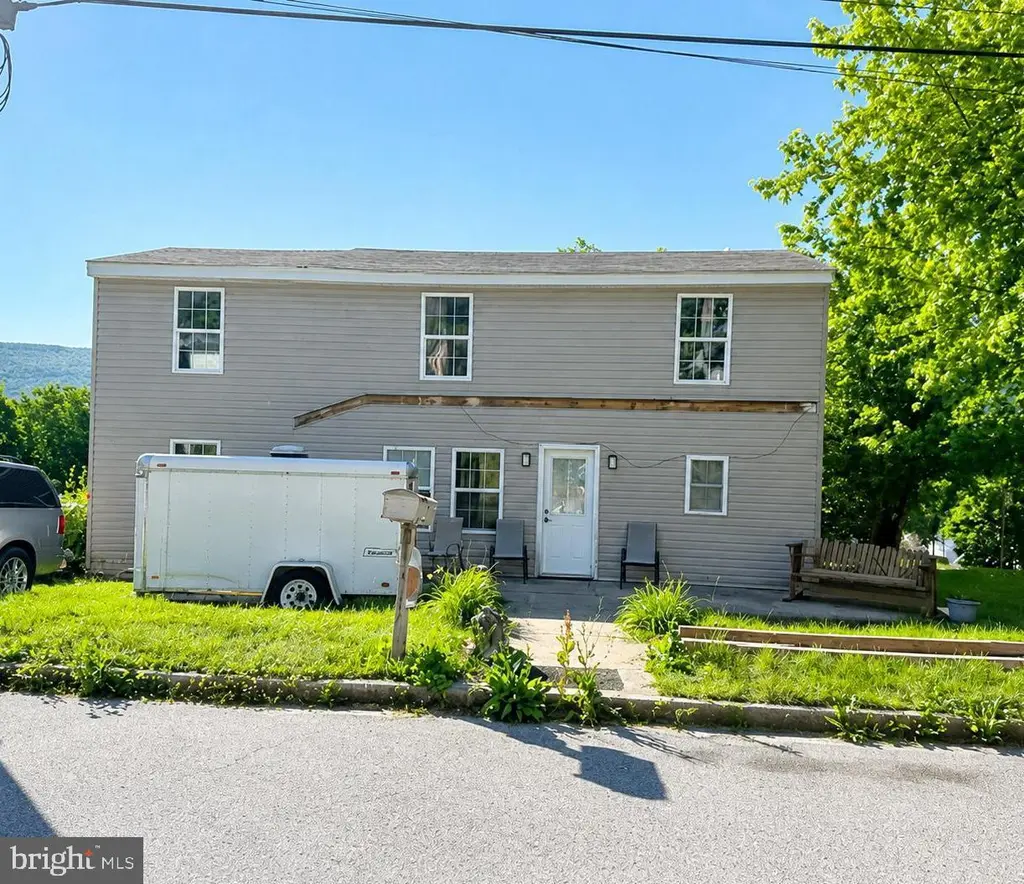
539 Highland Ave · Burnham, PA
Flood risk 1/10 · Minimal
- FEMA flood zone
- X (unshaded)
- Chance of flooding over 30 yrs
- 0.0%
- Est. flood insurance / yr
- $473 – $860
Fire risk 3/10 · Minor
- Est. fire insurance / yr
- $511 – $949
Heat risk 4/10 · Minor
- Hot days now (above 95°F)
- 7 days/yr
- Hot days in 30 yrs
- 17 days/yr
Wind risk 2/10 · Minimal
- Chance of severe wind over 30 yrs
- —
Air-quality risk 2/10 · Minimal
- Unhealthy air days now
- 0 days/yr
- Unhealthy air days in 30 yrs
- 1 days/yr
Risk factors via First Street. Map © Google.
Why this score? — see what drove the B grade
The composite is a weighted blend of 9 inputs, each scored 0–100. Each bar is that input's sub-score; the figure is the points it added to the 100-point composite (weight × sub-score).
- Cash flow +28.4/30.0
- DSCR +10.0/10.0
- Appreciation +9.2/10.0
- 1% rule +7.5/10.0
- ARV discount +7.5/15.0
- Livability +3.6/5.0
- Schools +3.2/10.0
- Rent growth +2.5/5.0
- Condition / age +2.5/5.0
$159,900
🖨 Deal sheet (PDF) 📄 Offer letter ✓ Due diligence
Listing remarks
Charming 2-story home located in the heart of Burnham Borough! This 4-bedroom, 1-bath detached home offers over 2,100 square feet of living space on a generous 0.37-acre lot with public water and sewer. Full of potential, this property is ready for your finishing touches and personal vision. The living room, main bedroom, and bathroom have already been completed, while the kitchen and second floor are ready for remodeling and customization. The home is also plumbed for a second bathroom off the primary bedroom, offering additional future value and convenience. To help bring the project to completion, the sale includes a variety of remaining building materials, including a farmhouse sink, li
Key facts
- 2 story home
- 0.37 acre lot
- Built 1950
Tags
Property features AI
Finance
- Other: Pets allowed (cats and dogs OK)
- Financial info: Fee simple ownership; Lease not considered
Exterior
- Parking: On-street parking
- Utilities: Electric cooling and hot water; Public water; Private sewer
- Home design: Detached home; Estimated year built
- Construction: Frame construction with vinyl siding; Metal roof; Other foundation
- Exterior features: Outbuilding(s); Not in a federal flood zone; Public water; Private sewer
Interior
- Bedrooms: Four bedrooms on the main level
- Bathrooms: One full bathroom (main level)
- Heating & cooling: Ductless / mini-split cooling (electric); Other heating type; Electric hot water
- Interior features: Not furnished; Unfinished basement
Neighborhood map
What this means for you Summary
Snapshot
- This is a 2-bed/1.0-bath other listed at $160k.
Deal economics
- At list price, monthly cash flow is $520 ($6k/yr) — positive.
- The deal already cash-flows at list — no discount required.
- Meets the 1% rule at list price ($2k rent vs $160k).
- Recommended offer: $158k (1.5% below list) — sets the bar for market timing.
Location & tenants
- Location reads 72/100 on livability (#634 in PA) — a middle-class / working-renter tenant base. Strengths: crime A+, cost of living A+, housing A+; Watch: schools F, amenities F, commute F.
- Mifflin County SD (town): math 28% / reading 49% proficiency, ranked #380 of 539 in PA (top 70%) — families likely to look elsewhere, expect single-tenant / working-renter base with shorter leases.
- Market conditions: 14 active listings in the ZIP; 1 comparable units currently listed for rent nearby; 58 units permitted in Mifflin County in 2024 (0 in 5+ unit buildings).
Forward outlook
- In year one you build about $14k of equity ($1k loan paydown + $13k appreciation (8.3% local appreciation)).
- Mifflin County population projected at -18% by 2050 — secular population decline; favor cash flow + early exit over multi-decade hold.
- At projected returns (8.3% appreciation + 3.0% rent growth), your $45k cash investment doubles in ~3 years — after that, you're playing with house money.
- By year 3, paydown + projected appreciation supports a ~$36k cash-out refi (75% LTV) — recoverable capital for the next deal without selling this one.
Negotiation context
- It's been on market 19 days — a 2% lower offer ($158k) is reasonable based on typical stale-listing flexibility.
- Current owner paid $20k; list at $160k implies a 700% gain — meaningful room to come down on a strong offer.
Risks & watch-outs
- Watch-outs: built in 1950 — expect roof / HVAC / electrical / plumbing capex.
Questions for the listing agent
- Built in 1950 — when were the roof, HVAC, electrical panel, plumbing, and water heater last replaced?
- Is there a deadline driving the sale (1031 exchange, divorce, estate, relocation)? That informs how much negotiation room exists.
- Schools are F-rated, which usually means shorter tenancies and higher turnover. Who's the typical renter profile here, and what's been the actual vacancy rate?
- What's the average days-on-market for RENTAL listings here right now (not sales)? A rising rental-DOM trend means longer vacancies and softer asking-rent achievability than the comps imply.
- What's the recent tenant-quality profile in this submarket — average credit score on applications, eviction rate, late-payment / NSF rate, and stable-employment percentage? A property-management company in the area should have these aggregated.
- How much new for-sale + rental construction is in the pipeline within 1–3 miles? Heavy new supply typically softens prices + rents 12–24 months out; constrained supply supports both.
Investment metrics
- 1% rule
- 1.25% ✓
- Cap rate
- 10.19%
- Cash-on-cash
- 13.93%
- DSCR
- 1.62
- GRM
- 6.7
CMA / ARV
No comps found within radius.
Projected returns pro-forma
8.31% appreciation · 3.0% rent growth · sell at horizon
- IRR
- 31.4%
- Equity multiple
- 3.28×
- Total profit
- $102,139
- Equity at exit
- $124,852
- IRR
- 27.9%
- Equity multiple
- 7.07×
- Total profit
- $271,942
- Equity at exit
- $251,115
Cash invested: $44,772 (down + closing). Projections, not guarantees.
Landlord ↔ Tenant lean methodology
- Overall (STATE)
- 62 Landlord-Friendly
- State Pennsylvania
- 62 Landlord-Friendly · EVEN
- County
- — inherits STATE
- City
- — inherits STATE
ZIP-level market 17009
- Home prices YoY
- 3.5%
- Active inventory
- 14
- Price-to-rent
- 6.7×
Monthly cashflow live
- Estimated rent
- $2,000 medium interval (Pro) →
- Mortgage (P&I)
- −$839
- Tax from tax record
- −$155 /mo · $1,862/yr
- Insurance
- −$67
- HOA
- −$0
- Vacancy / Maint / Mgmt
- −$420
- Net cashflow
- $520
Break-even live
Sensitivity live
| Price | -10% $610 | -5% $565 | +0% $520 | +5% $474 | +10% $429 |
|---|---|---|---|---|---|
| Rent | -10% $362 | -5% $441 | +0% $520 | +5% $599 | +10% $678 |
| Rate | -1.0pp $600 | -0.5pp $560 | base $520 | +0.5pp $478 | +1.0pp $436 |
UW: 25.0% down · 7.5% · 30yr · 1.5% tax · 5.0% vac · 8.0% maint · 8.0% mgmt
Financing live
Cash to close
- Down payment
- $39,975
- Closing costs
- $4,797
- Reserves months
- —
- Total cash needed
- —
Loan-product check · same deal, 3 products live
Conventional
25% down · 7.5% · 30yr
- Down + closing
- —
- Monthly P&I
- —
- Monthly cashflow
- —
- DSCR
- —
- Eligible?
- —
Personal DTI + credit; lowest rate.
DSCR
20% down · 8.5% · 30yr
- Down + closing
- —
- Monthly P&I
- —
- Monthly cashflow
- —
- DSCR
- —
- Eligible?
- —
No personal income docs; deal must DSCR.
Hard money
10% down · 12.0% · 12mo
- Down + closing
- —
- Monthly P&I
- —
- Monthly cashflow
- —
- DSCR
- —
- Eligible?
- —
Short-term bridge; refi at stabilization.
Rent comps 1 comps
| Address | Beds | Baths | Sqft | Rent | $/sqft | DOM | Units | Dist |
|---|---|---|---|---|---|---|---|---|
| 203 4th Ave Burnham, PA | 3.0 | 2.0 | 1960 | $2,000 | $1.02 | 44d | 1 | 0.59mi |
Listing history 14 events
-
2026-06-21days on market $159,900 Active 19 DOM
-
2026-06-18days on market $159,900 Active 17 DOM
-
2026-06-17days on market $159,900 Active 16 DOM
-
2026-06-16days on market $159,900 Active 15 DOM
-
2026-06-15days on market $159,900 Active 14 DOM
-
2026-06-13pricedays on market $159,900 Active 12 DOM
-
2026-06-12days on market $165,000 Active 11 DOM
-
2026-06-09days on market $165,000 Active 8 DOM
-
2026-06-08days on market $165,000 Active 7 DOM
-
2026-06-08days on market $165,000 Active 6 DOM
-
2026-06-07days on market $165,000 Active 5 DOM
-
2026-06-04days on market $165,000 Active 2 DOM
-
2026-06-01remarks 699-char remark
-
2026-06-01$165,000 Active 1 DOM
ⓘ Source: listings_history table (triggers on properties + properties_extension) + one-shot
backfill from property_details.listing_events for pre-trigger history.
Tax reassessment forecast PA · Partial reset (capped growth)
- Current annual tax
- $1,862 · $155/mo
- Projected year-2 tax
- $2,194 · $183/mo
- Expected delta
- +$332/yr (+$28/mo · 17.8%)
ⓘ Screening estimate from a state-policy table — verify with the county assessor before closing.
Climate risk First Street
- Flood 1/10 Low FEMA zone X (unshaded) · 0% chance over 30 yrs
- Wildfire 3/10 Moderate
- Heat 4/10 Moderate 7 d/yr ≥95°F today · 17 d/yr by 30 yrs out
- Wind 2/10 Low
- Air quality 2/10 Low 0 unhealthy d/yr today · 1 by 30 yrs out
Nearby sold comps map
Loading sold comps map…
Walkable amenities ~0.75 mi
Loading nearby amenities…
Taxation est. · year 1
- Rental income
- $24,000
- − Mortgage interest
- −$8,957
- − Property taxes
- −$1,862
- − Insurance
- −$800
- − Repairs & maintenance
- −$1,920
- − Management
- −$1,920
- − Depreciation
- −$4,652
- Taxable income
- $3,890
- Est. tax owed @ 24.0%
- −$934
- After-tax cash flow
- $5,302/yr
For passive investors: Depreciation is non-cash, so a rental often shows a tax loss while cash-flowing — sheltering income. Rental losses are passive: they offset passive income freely, and up to $25,000/yr can offset ordinary (W-2) income if you actively participate and your MAGI is under $100k (phasing out to $0 by $150k); unused losses carry forward. On sale, claimed depreciation is recaptured at up to 25%, and gains may owe capital-gains tax (a 1031 exchange can defer both). Figures are a year-1 estimate at your 24.0% rate — not tax advice; consult a CPA.
Schools (NCES district)
- District
- Mifflin County SD
- NCES district ID
- 4215290
- Math proficiency
- 28% ▼ -7.00%
- Reading proficiency
- 49% ▼ -9.00%
- Median HH income
- $40,718
- Composite
- 32.28/100
- National rank
- #5755
- State rank
- #380 of 539 in PA
Livability — Burnham
- Score
- 72/100
- State rank
- #634
- US rank
- #6172
Category grades
Schools grade is shown separately in the Schools card above.
Census & demographics
- Census place
- Burnham, PA
- City population
- 2,804
- Population (ZIP)
- 1,682
Population outlook (Mifflin County) Hauer SSP2
- Today (2025)
- 44,611 people
- By 2030
- 43,212 · -3.1%
- By 2040
- 40,197 · -9.9%
- By 2050
- 36,813 · -17.5%
- By 2075
- 28,833 · -35.4%
- By 2100
- 20,296 · -54.5%
Race, ethnicity, and origin ACS 2023
- Neighborhood character
- Predominantly White (91%)
- Race & ethnicity
- White 91% Two or more races 5% Black 3%
- Common ancestry
- Romanian 5% Iranian 3% Lithuanian 2%
- Foreign-born
- 0% · Canada
Political lean MEDSL · Mifflin
- 2024 margin
- Solid R (+56.4) · D 21.4% · R 77.9%
- 2008→2024 swing
- -22.8pp toward R · 2008: -33.7pp · 2024: -56.4pp
- All cycles
- 2024: R+56.4 2020: R+56.1 2016: R+57.5 2012: R+46.8 2008: R+33.7
Not yet ingested
- Civics
- —
Market trends
- HPI YoY
- ▲ 8.31%
- Current HPI
- 249.4239
- Rent YoY
- —
- Metro
- —
- State GDP YoY
- ▲ 1.68%
- F500 in state
- 34
Industry mix (Fortune 500 HQ in PA)
| Industry | F500 HQs | Revenue |
|---|---|---|
| Healthcare | 2 | $309B |
|
||
| Insurance | 2 | $27B |
|
||
| Telecommunications / Media | 1 | $124B |
|
||
| Industrial Distribution | 1 | $22B |
|
||
| Financial Services | 1 | $20B |
|
||
| Chemicals / Materials | 1 | $18B |
|
||
Price history
+725.0% since first listed2 events — show timeline
- 2026-06-01 Listed $165,000 BRIGHT MLS
- 1996-11-07 Sold (Public Records) $20,000 Public Records
Property tax history
+0.7%/yrLatest (2026): $1,862 · +0.0% YoY. Source: county tax records.
Cash-flow waterfall
monthlySold comps — $/sqft
last 12 mo · ≤1 miLoading sold comps…