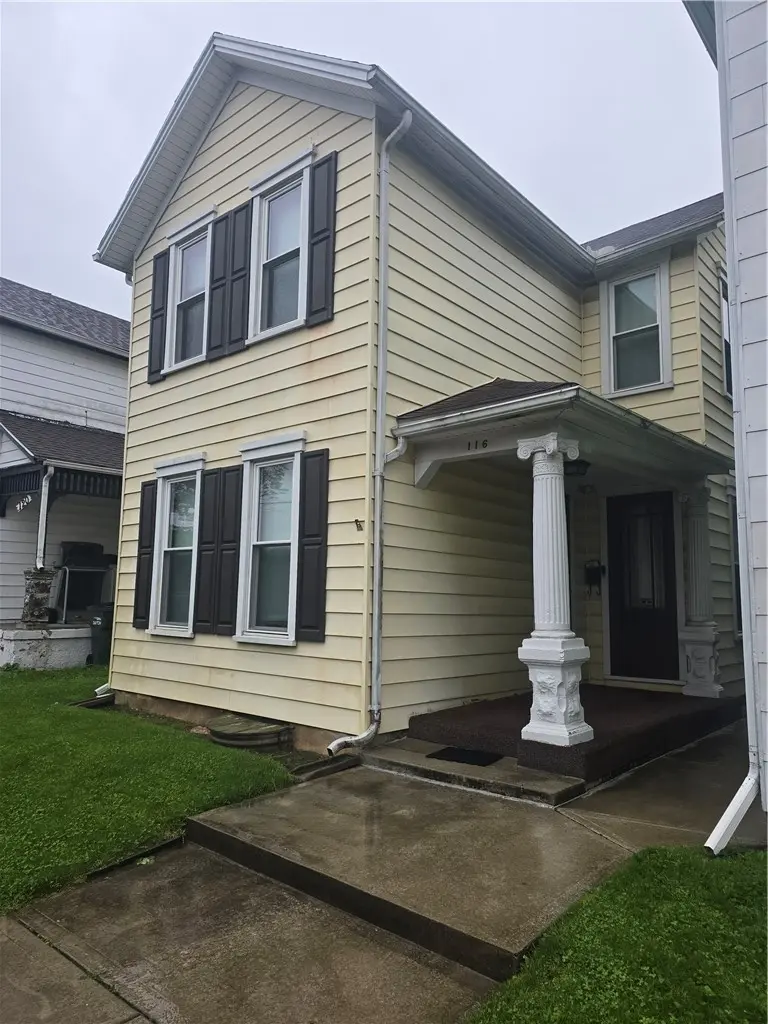
116 Burkhardt Ave · Dayton, OH
Flood risk 8/10 · Major
- FEMA flood zone
- X (unshaded)
- Chance of flooding over 30 yrs
- 0.99%
- Est. flood insurance / yr
- $473 – $860
Fire risk 1/10 · Minimal
- Est. fire insurance / yr
- $713 – $1,323
Heat risk 4/10 · Minor
- Hot days now (above 101°F)
- 7 days/yr
- Hot days in 30 yrs
- 18 days/yr
Wind risk 2/10 · Minimal
- Chance of severe wind over 30 yrs
- 1.0%
Air-quality risk 3/10 · Minor
- Unhealthy air days now
- 2 days/yr
- Unhealthy air days in 30 yrs
- 4 days/yr
Risk factors via First Street. Map © Google.
Why this score? — see what drove the B+ grade
The composite is a weighted blend of 9 inputs, each scored 0–100. Each bar is that input's sub-score; the figure is the points it added to the 100-point composite (weight × sub-score).
- Cash flow +30.0/30.0
- ARV discount +15.0/15.0
- 1% rule +10.0/10.0
- DSCR +10.0/10.0
- Rent growth +3.4/5.0
- Livability +3.2/5.0
- Condition / age +2.5/5.0
- Schools +1.3/10.0
- Appreciation +0.0/10.0
$50,000
🖨 Deal sheet 📄 Offer letter ✓ Due diligence
Listing remarks
Real Estate For Sale 116 Burkhardt Ave. , Dayton, Ohio 45403 (Montgomery County) Investment Opportunity This property presents a three-bedroom, two-bath residence offering 1,456 square feet of living space. The home includes a detached garage and a fenced backyard, as well as an eat-in kitchen, dining room, family room, living room, and upstairs bedrooms. Additional features consist of vinyl replacement and original windows, aluminum siding, natural gas forced air heating, and central air conditioning. The property is being offered as-is for estate settlement purposes.
Key facts
- 2,975 sq ft lot
- Garage
- Built 1905
Property features AI
Finance
- Financial info: Offered for sale
Exterior
- Parking: Detached garage
- Home design: Two-story home; Residential property
- Construction: Aluminum siding, wood siding, and frame construction; Cellar foundation
- Exterior features: Residential lot (approx. 124 x 24)
Interior
- Kitchen: Eat-in kitchen (approx. 16 x 9)
- Bedrooms: Three bedrooms on the second floor (approx. 11 x 11; 13 x 11; 13 x 13)
- Bathrooms: One full bathroom (main level)
- Heating & cooling: Central air conditioning; Natural gas heating
- Interior features: Eat-in kitchen
- Laundry & utility: Main level laundry room (approx. 13 x 8)
Neighborhood map
What this means for you Summary
Snapshot
- This is a 3-bed/1.0-bath single-family listed at $50k.
Deal economics
- At list price, monthly cash flow is $484 ($6k/yr) — positive.
- The deal already cash-flows at list — no discount required.
- Meets the 1% rule at list price ($1k rent vs $50k).
- Cap rate 19.2% vs local median 7.4% in Dayton — top-decile yield for the area; either an underpriced asset or a hidden risk that comps aren't pricing in. Stress-test before assuming the spread holds.
Location & tenants
- Location reads 65/100 on livability (#716 in OH) — a middle-class / working-renter tenant base. Strengths: cost of living A+, housing A+, health & safety A; Watch: schools C-, amenities C-, crime F.
- Dayton City (urban): math 12% / reading 21% proficiency, ranked #641 of 656 in OH (top 98%) — low school quality limits family demand, transient renter base, plan for 1-2y turnover; 74% free/reduced lunch — lower-income household profile, screen leases tightly.
- Market conditions: Rents rising (+3.7%/yr); 77 active listings in the ZIP; 40 comparable units currently listed for rent nearby; rentals at typical pace (median 21d on market — plan ~3-4 weeks tenant-placement turnaround); lower-income renter base — watch delinquency; 907 units permitted in Montgomery County in 2024 (416 in 5+ unit buildings).
- This rent runs 35% of the median local income ($38k/yr) — at the standard rent-burdened threshold; future hikes will face affordability resistance.
Forward outlook
- Local home prices are declining (-3.0%/yr); year-one equity from $346 of loan paydown is wiped out by about $2k of value loss. Plan a longer hold.
- Montgomery County population projected at -10% by 2050 — secular population decline; favor cash flow + early exit over multi-decade hold.
- At projected returns (-3.0% appreciation + 3.7% rent growth), your $14k cash investment doubles in ~3 years — after that, you're playing with house money.
Negotiation context
- Only 8 days on market — expect competitive offers; lowballing is unlikely to land.
Risks & watch-outs
- Watch-outs: flood insurance adds $56/mo; built in 1905 — expect roof / HVAC / electrical / plumbing capex.
- Climate carrying-cost: severe flood risk — expect insurance premiums to compound above CPI over the hold.
Questions for the listing agent
- Built in 1905 — when were the roof, HVAC, electrical panel, plumbing, and water heater last replaced?
- What's the actual annual flood-insurance premium (NFIP or private), and is the property in a SFHA with mandatory coverage?
- Is there a deadline driving the sale (1031 exchange, divorce, estate, relocation)? That informs how much negotiation room exists.
- Crime grade is F in this area — have there been break-ins, vandalism, or insurance claims at this property in the last 3 years? What carrier currently insures it and at what premium?
- What's the average days-on-market for RENTAL listings here right now (not sales)? A rising rental-DOM trend means longer vacancies and softer asking-rent achievability than the comps imply.
- What's the recent tenant-quality profile in this submarket — average credit score on applications, eviction rate, late-payment / NSF rate, and stable-employment percentage? A property-management company in the area should have these aggregated.
- How much new for-sale + rental construction is in the pipeline within 1–3 miles? Heavy new supply typically softens prices + rents 12–24 months out; constrained supply supports both.
Investment metrics
- 1% rule
- 2.24% ✓
- Cap rate
- 19.24%
- Cash-on-cash
- 46.23%
- DSCR
- 3.06
- GRM
- 3.7
CMA / ARV
- ARV (median comp)
- $95,071
- List price
- $50,000
- Delta
- -47.41%
- Verdict
- UNDERPRICED
- Comps
- 20 within 1.0 mi
Show comp detail 12 sales within ~0.75 mi
| Address | Dist | Beds/Ba | Sqft | Sold | Price | $/sf | Match |
|---|---|---|---|---|---|---|---|
| 15 Drury St | 0.44mi | 3/1.5 | 1,464 (+0%) | 0mo | $181,000 | $124 | 76 |
| 800 Linden Ave | 0.49mi | 3/1.5 | 1,472 (+1%) | 0mo | $62,500 | $42 | 73 |
| 42 S Monmouth St | 0.24mi | 3/2.0 | 1,332 (-8%) | 3mo | $109,900 | $83 | 68 |
| 107 Sherman St | 0.61mi | 3/1.5 | 1,446 (-1%) | 2mo | $73,000 | $50 | 67 |
| 65 S Sperling Ave | 0.42mi | 2/1.0 (-1) | 1,380 (-5%) | 1mo | $57,000 | $41 | 66 |
| 804 Linden Ave | 0.50mi | 3/2.0 | 1,395 (-4%) | 1mo | $86,000 | $62 | 65 |
| 1609 Xenia Ave | 0.54mi | 3/1.0 | 1,533 (+5%) | 4mo | $110,000 | $72 | 63 |
| 44 Bell St | 0.57mi | 2/1.5 (-1) | 1,404 (-4%) | 2mo | $125,000 | $89 | 58 |
| 523 Carlisle Ave | 0.60mi | 4/2.0 (+1) | 1,438 (-1%) | 4mo | $110,000 | $76 | 58 |
| 133 Linsan Ct | 0.62mi | 3/1.5 | 1,339 (-8%) | 3mo | $135,000 | $101 | 53 |
| 425 Huffman Ave | 0.47mi | 3/2.0 | 1,248 (-14%) | 1mo | $80,000 | $64 | 49 |
| 1116 Linden Ave | 0.73mi | 4/3.0 (+1) | 1,600 (+10%) | 3mo | $157,000 | $98 | 34 |
Match score weights: distance 35% · size 25% · config 20% · recency 20%. Top-matched comps best support the ARV.
Projected returns pro-forma
-3.0% appreciation · 3.71% rent growth · sell at horizon
- IRR
- 39.0%
- Equity multiple
- 2.68×
- Total profit
- $23,567
- Equity at exit
- $7,455
- IRR
- 45.8%
- Equity multiple
- 5.55×
- Total profit
- $63,754
- Equity at exit
- $4,323
Cash invested: $14,000 (down + closing). Projections, not guarantees.
Landlord ↔ Tenant lean methodology
- Overall (STATE)
- 73 Landlord-Friendly
- State Ohio
- 73 Landlord-Friendly · R+6
- County
- — inherits STATE
- City
- — inherits STATE
ZIP-level market 45403
- Home prices YoY
- -3.7%
- Rents YoY
- 3.7%
- Active inventory
- 77
- Price-to-rent
- 3.7×
Monthly cashflow live
- Estimated rent
- $1,118 high interval (Pro) →
- Mortgage (P&I)
- −$262
- Tax from tax record
- −$61 /mo · $734/yr
- Insurance
- −$21
- Flood insurance flood zone
- −$56 /mo · $666/yr
- HOA
- −$0
- Vacancy / Maint / Mgmt
- −$235
- Net cashflow
- $484
Break-even live
UW: 25.0% down · 7.5% · 30yr · 1.5% tax · 5.0% vac · 8.0% maint · 8.0% mgmt
Financing live
Cash to close
- Down payment
- $12,500
- Closing costs
- $1,500
- Reserves months
- —
- Total cash needed
- —
Loan-product check · same deal, 3 products live
Conventional
25% down · 7.5% · 30yr
- Down + closing
- —
- Monthly P&I
- —
- Monthly cashflow
- —
- DSCR
- —
- Eligible?
- —
Personal DTI + credit; lowest rate.
DSCR
20% down · 8.5% · 30yr
- Down + closing
- —
- Monthly P&I
- —
- Monthly cashflow
- —
- DSCR
- —
- Eligible?
- —
No personal income docs; deal must DSCR.
Hard money
10% down · 12.0% · 12mo
- Down + closing
- —
- Monthly P&I
- —
- Monthly cashflow
- —
- DSCR
- —
- Eligible?
- —
Short-term bridge; refi at stabilization.
Rent comps 40 comps
| Address | Beds | Baths | Sqft | Rent | $/sqft | DOM | Units | Dist |
|---|---|---|---|---|---|---|---|---|
| 314 Sheridan Ave Dayton, OH | 3.0 | 1.0 | 1258 | $1,150 | $0.91 | 3d | 1 | 0.14mi |
| 120 S Monmouth St Dayton, OH | 2.0 | 1.0 | 1000 | $950 | $0.95 | 43d | 1 | 0.15mi |
| 224 S Irwin St Unit 226 Dayton, OH | 2.0 | 1.0 | 992 | $900 | $0.91 | 3d | 1 | 0.17mi |
| 201 Pleasant Ave Unit 203 Dayton, OH | 2.0 | 1.0 | 1250 | $975 | $0.78 | 23d | 1 | 0.24mi |
| 210 S Hedges St Dayton, OH | 2.0 | 1.5 | 1048 | $1,045 | $1.00 | 21d | 1 | 0.31mi |
| 115 Livingston Ave Dayton, OH | 3.0 | 1.0 | 1624 | $1,450 | $0.89 | 44d | 1 | 0.38mi |
| 424 Bantz Ct Dayton, OH | 3.0 | 1.0 | 1192 | $1,050 | $0.88 | 3d | 1 | 0.44mi |
| 101 N Irwin St Dayton, OH | 2.0 | 1.0 | 900 | $1,100 | $1.22 | 3d | 1 | 0.47mi |
| 1300 Chardon Ct Dayton, OH | 2.0 | 1.0 | 970 | $1,200 | $1.24 | 2d | 1 | 0.50mi |
| 15 John St Unit 15 Dayton, OH | 2.0 | 1.0 | 1200 | $800 | $0.67 | 23d | 1 | 0.51mi |
| 29 N Garfield St Dayton, OH | 3.0 | 1.0 | 1092 | $1,000 | $0.92 | 23d | 1 | 0.53mi |
| 2200 E 5th St Dayton, OH | 2.0 | 1.0 | 1000 | $825 | $0.82 | 23d | 1 | 0.60mi |
| 3817 E 5th St Dayton, OH | 2.0 | 1.0 | 1178 | $1,295 | $1.10 | 2d | 1 | 0.61mi |
| 3707 E 3rd St Unit 3705 Dayton, OH | 3.0 | 1.0 | 1410 | $1,045 | $0.74 | 23d | 1 | 0.63mi |
| 3719 E 3rd St Unit 3717 Dayton, OH | 3.0 | 1.0 | 1092 | $1,100 | $1.01 | 2d | 1 | 0.64mi |
| 637 Creighton Ave Dayton, OH | 3.0 | 1.0 | 1144 | $1,350 | $1.18 | 14d | 1 | 0.69mi |
| 511 Parrot St Dayton, OH | 3.0 | 1.5 | 1618 | $1,100 | $0.68 | 14d | 1 | 0.76mi |
| 4013 E 3rd St Dayton, OH | 2.0 | 1.5 | 1144 | $1,095 | $0.96 | 14d | 1 | 0.77mi |
| 1354 Ohmer St Unit 1354A Dayton, OH | 2.0 | 1.0 | 900 | $675 | $0.75 | 23d | 1 | 0.83mi |
| 1354 Ohmer St Unit 1356C Dayton, OH | 2.0 | 2.0 | 1200 | $900 | $0.75 | 43d | 1 | 0.83mi |
| 1354 Ohmer St Unit 1354C Dayton, OH | 2.0 | 1.0 | 900 | $700 | $0.78 | 43d | 1 | 0.83mi |
| 2012 Saint Charles Ave Dayton, OH | 2.0 | 1.0 | 945 | $1,250 | $1.32 | 43d | 1 | 0.85mi |
| 706 Kolping Ave Unit 706 Dayton, OH | 3.0 | 1.5 | 1172 | $1,300 | $1.11 | 2d | 1 | 0.86mi |
| 4403 Burkhardt Ave Dayton, OH | 3.0 | 1.0–2.0 | 800 | $1,100 | $1.38 | 2d | 1 | 0.87mi |
| 1620 Gummer Ave Dayton, OH | 2.0 | 1.0 | 875 | $950 | $1.09 | 3d | 1 | 0.89mi |
| 144 N Quentin Ave Dayton, OH | 3.0 | 1.0 | 1038 | $1,600 | $1.54 | 43d | 1 | 0.89mi |
| 515 Mertland Ave Dayton, OH | 2.0 | 1.0 | 876 | $950 | $1.08 | 23d | 1 | 0.92mi |
| 517 Mertland Ave Dayton, OH | 2.0 | 1.0 | 876 | $875 | $1.00 | 14d | 1 | 0.92mi |
| 1704 Huffman Ave Unit 1706 Huffman Dayton, OH | 2.0 | 1.0 | 896 | $900 | $1.00 | 3d | 1 | 0.95mi |
| 211 N Cherrywood Ave Unit 2 Dayton, OH | 2.0 | 1.0 | 950 | $795 | $0.84 | 3d | 1 | 0.96mi |
| 854 Santa Cruz Ave Dayton, OH | 3.0 | 1.0 | 1060 | $1,300 | $1.23 | 43d | 1 | 1.00mi |
| 1515 Wyoming St Dayton, OH | 3.0 | 1.0 | 1400 | $1,000 | $0.71 | 43d | 1 | 1.02mi |
| 1411 Wyoming St Dayton, OH | 3.0 | 1.0 | 1256 | $1,095 | $0.87 | 2d | 1 | 1.04mi |
| 1770 Suman Ave Dayton, OH | 2.0 | 1.0 | 904 | $1,145 | $1.27 | 43d | 1 | 1.06mi |
| 1101 Phillips Ave Unit 1101 Dayton, OH | 3.0 | 1.5 | 1300 | $1,450 | $1.12 | 43d | 1 | 1.09mi |
| 1430 Coventry Rd Dayton, OH | 2.0 | 1.0 | 1106 | $1,125 | $1.02 | 14d | 1 | 1.09mi |
| 31 Bidleman St Dayton, OH | 2.0 | 1.5 | 1568 | $1,100 | $0.70 | 43d | 1 | 1.12mi |
| 1029 Blakley Dr Dayton, OH | 3.0 | 1.0 | 947 | $1,300 | $1.37 | 2d | 1 | 1.16mi |
| 334 Blackwood Ave Unit 2 Dayton, OH | 2.0 | 1.0 | 1000 | $850 | $0.85 | 23d | 1 | 1.18mi |
| 334 Blackwood Ave Unit 3 Dayton, OH | 2.0 | 1.0 | 1000 | $850 | $0.85 | 3d | 1 | 1.18mi |
Listing history 2 events
-
2026-05-07status Pending 575-char remark
-
2026-04-29$50,000 Active 575-char remark
ⓘ Source: listings_history table (triggers on properties + properties_extension) + one-shot
backfill from property_details.listing_events for pre-trigger history.
Tax reassessment forecast OH · Partial reset (capped growth)
- Current annual tax
- $734 · $61/mo
- Projected year-2 tax
- $757 · $63/mo
- Expected delta
- +$23/yr (+$2/mo · 3.1%)
ⓘ Screening estimate from a state-policy table — verify with the county assessor before closing.
Climate risk First Street
- Flood 8/10 Severe FEMA zone X (unshaded) · 99% chance over 30 yrs
- Wildfire 1/10 Low
- Heat 4/10 Moderate 7 d/yr ≥101°F today · 18 d/yr by 30 yrs out
- Wind 2/10 Low 100% chance of damaging wind over 30 yrs
- Air quality 3/10 Moderate 2 unhealthy d/yr today · 4 by 30 yrs out
Nearby sold comps map
Loading sold comps map…
Walkable amenities ~0.75 mi
Loading nearby amenities…
Taxation est. · year 1
- Rental income
- $13,421
- − Mortgage interest
- −$2,801
- − Property taxes
- −$734
- − Insurance
- −$916
- − Repairs & maintenance
- −$1,074
- − Management
- −$1,074
- − Depreciation
- −$1,455
- Taxable income
- $5,368
- Est. tax owed @ 24.0%
- −$1,288
- After-tax cash flow
- $4,517/yr
For passive investors: Depreciation is non-cash, so a rental often shows a tax loss while cash-flowing — sheltering income. Rental losses are passive: they offset passive income freely, and up to $25,000/yr can offset ordinary (W-2) income if you actively participate and your MAGI is under $100k (phasing out to $0 by $150k); unused losses carry forward. On sale, claimed depreciation is recaptured at up to 25%, and gains may owe capital-gains tax (a 1031 exchange can defer both). Figures are a year-1 estimate at your 24.0% rate — not tax advice; consult a CPA.
Schools (NCES district)
- District
- Dayton City
- NCES district ID
- 3904384
- Math proficiency
- 12% ▼ -12.00%
- Reading proficiency
- 21% ▼ -11.00%
- Median HH income
- $28,688
- Composite
- 12.94/100
- National rank
- #9579
- State rank
- #641 of 656 in OH
Livability — Dayton
- Score
- 65/100
- State rank
- #716
- US rank
- #12895
Category grades
Schools grade is shown separately in the Schools card above.
Census & demographics
- Census place
- Dayton, OH
- County
- Montgomery County · 459,541 people
- City population
- 164,387
- Metro
- Dayton-Kettering, OH
- Population (ZIP)
- 13,608
- Household income
- $38,323
- Rent vs Own
- Severe rent burden
- 1071.0
Population outlook (Montgomery County) Hauer SSP2
- Today (2025)
- 523,241 people
- By 2030
- 514,948 · -1.6%
- By 2040
- 493,378 · -5.7%
- By 2050
- 469,639 · -10.2%
- By 2075
- 418,360 · -20.0%
- By 2100
- 353,315 · -32.5%
Race, ethnicity, and origin ACS 2023
- Neighborhood character
- Predominantly White (66%)
- Race & ethnicity
- White 66% Hispanic / Latino 15% Black 14% Two or more races 8% Native American 1%
- Hispanic origin (detail)
- Mexican 7%
- Common ancestry
- Lithuanian 2% Slovak 1% Italian 1%
- Foreign-born
- 9% · Canada
- Languages at home
- 84% English-only · Spanish 13% Other Asian/Pacific 1%
Political lean MEDSL · Montgomery
- 2024 margin
- Toss-up / Even · D 49.8% · R 49.3%
- 2008→2024 swing
- -5.8pp toward R · 2008: 6.2pp · 2024: 0.5pp
- All cycles
- 2024: D+0.5 2020: D+2.2 2016: R+1.2 2012: D+3.1 2008: D+6.2
Not yet ingested
- Civics
- —
Market trends
- HPI YoY
- ▼ -17.40%
- Current HPI
- 447.4034
- Rent YoY
- ▲ 3.71%
- Metro
- Dayton-Kettering, OH
- State GDP YoY
- ▲ 1.98%
- F500 in state
- 48
Industry mix (Fortune 500 HQ in OH)
| Industry | F500 HQs | Revenue |
|---|---|---|
| Insurance | 3 | $145B |
|
||
| Industrial Machinery | 3 | $49B |
|
||
| Financial Services | 3 | $24B |
|
||
| Consumer Goods | 2 | $93B |
|
||
| Aerospace / Defense | 2 | $47B |
|
||
| Utilities | 2 | $33B |
|
||
Price history
2 events — show timeline
- 2026-05-07 Pending — Dayton MLS
- 2026-04-29 Listed $50,000 Dayton MLS
Property tax history
+15.8%/yrLatest (2025): $734 · +316.0% YoY. Source: county tax records.
Cash-flow waterfall
monthlySold comps — $/sqft
last 12 mo · ≤1 miLoading sold comps…