8735 CR 631a · Nobleton, FL
Flood risk 1/10 · Minimal
- FEMA flood zone
- X (unshaded)
- Chance of flooding over 30 yrs
- 0.0%
- Est. flood insurance / yr
- $507 – $1,088
Fire risk 5/10 · Moderate
- Est. fire insurance / yr
- $947 – $1,759
Heat risk 8/10 · Major
- Hot days now (above 108°F)
- 7 days/yr
- Hot days in 30 yrs
- 21 days/yr
Wind risk 9/10 · Severe
- Chance of severe wind over 30 yrs
- 99.0%
Air-quality risk 1/10 · Minimal
- Unhealthy air days now
- 0 days/yr
- Unhealthy air days in 30 yrs
- 0 days/yr
Risk factors via First Street. Map © Google.
Why this score? — see what drove the D+ grade
The composite is a weighted blend of 9 inputs, each scored 0–100. Each bar is that input's sub-score; the figure is the points it added to the 100-point composite (weight × sub-score).
- Cash flow +12.8/30.0
- Appreciation +10.0/10.0
- ARV discount +7.5/15.0
- Schools +5.2/10.0
- DSCR +3.8/10.0
- Livability +2.8/5.0
- Rent growth +2.5/5.0
- Condition / age +2.5/5.0
- 1% rule +2.3/10.0
$235,000
🖨 Deal sheet 📄 Offer letter ✓ Due diligence
Listing remarks
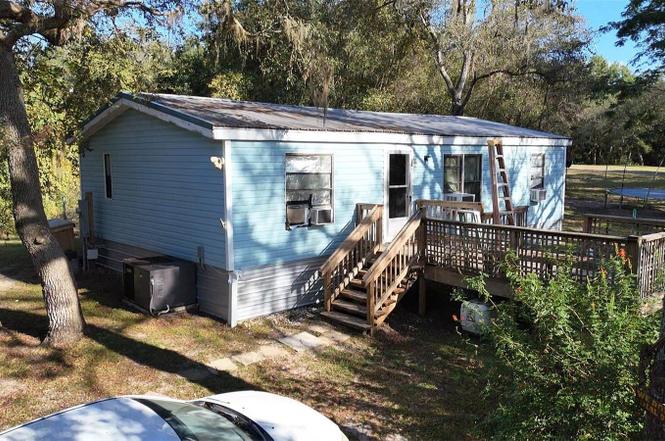
OWNER MOTIVATED! Peaceful 5-Acre Retreat in Bushnell, Florida. Tucked away at the end of a long, secluded driveway, this 3-bedroom, 2-bath mobile home sits high and dry on 5 serene acres within the beautiful Gum Slough Preserve area. The home itself needs A lot of TLC, but the setting is truly something special — the kind of place where peace, privacy, and nature take center stage. As the sun rises, warm orange light filters through the trees, painting the landscape in color and calm. Evenings bring that same glow as the sun sets, and the world seems to melt away. Step outside and you’ll be greeted by songbirds in the morning and owls at night, with frequent visits from deer, b
Key facts
- Native wildflowers
- Majestic oak trees
- Small pond
Tags
Property features AI
Finance
- Other: Approximately 5 acres of wooded land with oak trees; Road surface to property: dirt and limerock; One well and one septic on property; Zoned RR5
Exterior
- Parking: Unpaved driveway (dirt/limerock) access
- Utilities: Well water; Septic tank; Electricity connected; Cable connected; Broadband/high-speed internet available
- Home design: Manufactured double wide home; One story; Faces southwest; Homestead eligible
- Construction: Vinyl siding; Metal roof; Pillar/post/pier foundation; Built as double wide manufactured home
- Exterior features: Other exterior features; Pond access
Interior
- Kitchen: Range; Refrigerator
- Bedrooms: 3 bedrooms
- Flooring: Laminate
- Bathrooms: 2 full bathrooms
- Heating & cooling: Space heater; Wall/window air conditioning units
- Interior features: Ceiling fans; Walk-in closets; 5 total rooms
- Laundry & utility: Indoor laundry
Neighborhood map
What this means for you Summary
Snapshot
- This is a 3-bed/2.0-bath manufactured listed at $235k.
Deal economics
- At list price, monthly cash flow is $-22 ($-264/yr) — negative.
- To cash-flow at today's rent, offer at most $231k (1.7% below list).
- To meet the 1% rule (rent ≥ 1% of price), the offer needs to be $173k (26.6% below list).
- Recommended offer: $173k (26.6% below list) — sets the bar for 1% rule.
Location & tenants
- Location reads 55/100 on livability (#880 in FL) — a working-class tenant base; expect higher turnover. Strengths: cost of living A+, crime A, housing B; Watch: health & safety C-, schools F, amenities F.
- Sumter (rural): math 61% / reading 61% proficiency, ranked #11 of 73 in FL (top 15%) — acceptable for families but not a draw, mixed tenant base, ~2y average lease.
- Market conditions: 97 active listings in the ZIP; 3,961 units permitted in Sumter County in 2024 (248 in 5+ unit buildings).
Forward outlook
- In year one you build about $25k of equity ($2k loan paydown + $24k appreciation (10.0% local appreciation)).
- Sumter County population projected at +45% by 2050 — long-run rental-demand tailwind backs the buy-and-hold thesis.
- At projected returns (10.0% appreciation + 3.0% rent growth), your $66k cash investment doubles in ~3 years — after that, you're playing with house money.
- By year 2, paydown + projected appreciation supports a ~$40k cash-out refi (75% LTV) — recoverable capital for the next deal without selling this one.
Negotiation context
- It's been on market 232 days — a 12% lower offer ($207k) is reasonable based on typical stale-listing flexibility.
- Current owner paid $115k; list at $235k implies a 104% gain — meaningful room to come down on a strong offer.
Risks & watch-outs
- Climate carrying-cost: severe wind risk, 99% chance of damaging wind over 30y; moderate wildfire risk; extreme-heat days projected 7→21/yr by 2055 (HVAC capex compounding) — expect insurance premiums to compound above CPI over the hold.
Questions for the listing agent
- What do current leases actually rent for vs. the listed asking? Can we see a recent rent roll and the last 12 months of T-12 income?
- It's been on market 232 days. Have you received any prior offers? Is the seller open to a 27% concession, seller financing, or rate buy-down credit?
- Why hasn't it sold? Are there any deal-killer items the seller is aware of (foundation, flood, title, zoning, code violations)?
- Is there a deadline driving the sale (1031 exchange, divorce, estate, relocation)? That informs how much negotiation room exists.
- Schools are F-rated, which usually means shorter tenancies and higher turnover. Who's the typical renter profile here, and what's been the actual vacancy rate?
- The area grade is low — what's the realistic commute time and amenity access for the typical tenant pool here? Any planned neighborhood developments (good or bad) we should know about?
- What's the average days-on-market for RENTAL listings here right now (not sales)? A rising rental-DOM trend means longer vacancies and softer asking-rent achievability than the comps imply.
- What's the recent tenant-quality profile in this submarket — average credit score on applications, eviction rate, late-payment / NSF rate, and stable-employment percentage? A property-management company in the area should have these aggregated.
- How much new for-sale + rental construction is in the pipeline within 1–3 miles? Heavy new supply typically softens prices + rents 12–24 months out; constrained supply supports both.
Investment metrics
- 1% rule
- 0.73% ✗
- Cap rate
- 6.18%
- Cash-on-cash
- -0.40%
- DSCR
- 0.98
- GRM
- 11.3
CMA / ARV
No comps found within radius.
Projected returns pro-forma
10.0% appreciation · 3.0% rent growth · sell at horizon
- IRR
- 24.0%
- Equity multiple
- 2.92×
- Total profit
- $126,466
- Equity at exit
- $211,707
- IRR
- 21.3%
- Equity multiple
- 6.67×
- Total profit
- $373,283
- Equity at exit
- $456,553
Cash invested: $65,800 (down + closing). Projections, not guarantees.
Landlord ↔ Tenant lean methodology
- Overall (STATE)
- 87 Strongly Landlord-Friendly
- State Florida
- 87 Strongly Landlord-Friendly · R+3
- County
- — inherits STATE
- City
- — inherits STATE
ZIP-level market 33513
- Home prices YoY
- 12.8%
- Active inventory
- 97
- Price-to-rent
- 11.3×
Monthly cashflow live
- Estimated rent
- $1,726 medium interval (Pro) →
- Mortgage (P&I)
- −$1,232
- Tax from tax record
- −$55 /mo · $660/yr
- Insurance
- −$98
- HOA
- −$0
- Vacancy / Maint / Mgmt
- −$362
- Net cashflow
- $-22
Break-even live
UW: 25.0% down · 7.5% · 30yr · 1.5% tax · 5.0% vac · 8.0% maint · 8.0% mgmt
Financing live
Cash to close
- Down payment
- $58,750
- Closing costs
- $7,050
- Reserves months
- —
- Total cash needed
- —
Loan-product check · same deal, 3 products live
Conventional
25% down · 7.5% · 30yr
- Down + closing
- —
- Monthly P&I
- —
- Monthly cashflow
- —
- DSCR
- —
- Eligible?
- —
Personal DTI + credit; lowest rate.
DSCR
20% down · 8.5% · 30yr
- Down + closing
- —
- Monthly P&I
- —
- Monthly cashflow
- —
- DSCR
- —
- Eligible?
- —
No personal income docs; deal must DSCR.
Hard money
10% down · 12.0% · 12mo
- Down + closing
- —
- Monthly P&I
- —
- Monthly cashflow
- —
- DSCR
- —
- Eligible?
- —
Short-term bridge; refi at stabilization.
Listing history 18 events
-
2026-06-19days on market $235,000 Active 232 DOM
-
2026-06-18days on market $235,000 Active 231 DOM
-
2026-06-17days on market $235,000 Active 230 DOM
-
2026-06-16days on market $235,000 Active 229 DOM
-
2026-06-15days on market $235,000 Active 228 DOM
-
2026-06-14days on market $235,000 Active 226 DOM
-
2026-06-13days on market $235,000 Active 225 DOM
-
2026-06-10days on market $235,000 Active 223 DOM
-
2026-06-09days on market $235,000 Active 222 DOM
-
2026-06-08days on market $235,000 Active 221 DOM
-
2026-06-07days on market $235,000 Active 220 DOM
-
2026-06-02days on market $235,000 Active 215 DOM
-
2026-06-01days on market $235,000 Active 214 DOM
-
2026-05-31days on market $235,000 Active 213 DOM
-
2026-05-30days on market $235,000 Active 212 DOM
-
2025-11-08price $235,000
-
2025-10-30$250,000 Active
-
2019-02-27soldstatus $115,000
ⓘ Source: listings_history table (triggers on properties + properties_extension) + one-shot
backfill from property_details.listing_events for pre-trigger history.
Tax reassessment forecast FL · Resets to sale price
- Current annual tax
- $660 · $55/mo
- Projected year-2 tax
- $1,950 · $163/mo
- Expected delta
- +$1,291/yr (+$108/mo · 195.8%)
ⓘ Screening estimate from a state-policy table — verify with the county assessor before closing.
Climate risk First Street
- Flood 1/10 Low FEMA zone X (unshaded) · 0% chance over 30 yrs
- Wildfire 5/10 Major
- Heat 8/10 Severe 7 d/yr ≥108°F today · 21 d/yr by 30 yrs out
- Wind 9/10 Extreme 99% chance of damaging wind over 30 yrs
- Air quality 1/10 Low 0 unhealthy d/yr today · 0 by 30 yrs out
Nearby sold comps map
Loading sold comps map…
Walkable amenities ~0.75 mi
Loading nearby amenities…
Taxation est. · year 1
- Rental income
- $20,708
- − Mortgage interest
- −$13,164
- − Property taxes
- −$660
- − Insurance
- −$1,175
- − Repairs & maintenance
- −$1,657
- − Management
- −$1,657
- − Depreciation
- −$6,836
- Taxable loss
- −$4,440
- Est. tax savings @ 24.0%
- +$1,066
- After-tax cash flow
- $802/yr
For passive investors: Depreciation is non-cash, so a rental often shows a tax loss while cash-flowing — sheltering income. Rental losses are passive: they offset passive income freely, and up to $25,000/yr can offset ordinary (W-2) income if you actively participate and your MAGI is under $100k (phasing out to $0 by $150k); unused losses carry forward. On sale, claimed depreciation is recaptured at up to 25%, and gains may owe capital-gains tax (a 1031 exchange can defer both). Figures are a year-1 estimate at your 24.0% rate — not tax advice; consult a CPA.
Schools (NCES district)
- District
- Sumter
- NCES district ID
- 1201800
- Math proficiency
- 61% ▼ -4.00%
- Reading proficiency
- 61% ▼ -2.00%
- Median HH income
- $48,240
- Composite
- 51.74/100
- National rank
- #1682
- State rank
- #11 of 73 in FL
Livability — Nobleton
- Score
- 55/100
- State rank
- #880
- US rank
- #23567
Category grades
Schools grade is shown separately in the Schools card above.
Census & demographics
- Population (ZIP)
- 13,647
Population outlook (Sumter County) Hauer SSP2
- Today (2025)
- 161,172 people
- By 2030
- 180,083 · +11.7%
- By 2040
- 209,892 · +30.2%
- By 2050
- 234,186 · +45.3%
- By 2075
- 284,602 · +76.6%
- By 2100
- 317,039 · +96.7%
Race, ethnicity, and origin ACS 2023
- Neighborhood character
- Predominantly White (74%)
- Race & ethnicity
- White 74% Black 11% Hispanic / Latino 10% Two or more races 4% Asian 1%
- Hispanic origin (detail)
- Mexican 4% Puerto Rican 3%
- Common ancestry
- Lithuanian 3% Serbian 3% Iranian 1%
- Foreign-born
- 2% · Canada, China
- Languages at home
- 92% English-only · Spanish 6% Chinese 1%
Political lean MEDSL · Sumter
- 2024 margin
- Solid R (+37.6) · D 30.9% · R 68.6%
- 2008→2024 swing
- -10.6pp toward R · 2008: -27.0pp · 2024: -37.6pp
- All cycles
- 2024: R+37.6 2020: R+36.1 2016: R+39.2 2012: R+34.9 2008: R+27.0
Not yet ingested
- Civics
- —
Market trends
- HPI YoY
- ▲ 40.29%
- Current HPI
- 354.5531
- Rent YoY
- —
- Metro
- —
- State GDP YoY
- ▲ 3.28%
- F500 in state
- 36
Industry mix (Fortune 500 HQ in FL)
| Industry | F500 HQs | Revenue |
|---|---|---|
| Industrial Technology | 2 | $29B |
|
||
| Insurance | 2 | $17B |
|
||
| Retail | 1 | $60B |
|
||
| Technology Distribution | 1 | $58B |
|
||
| Homebuilding | 1 | $35B |
|
||
| Technology Manufacturing | 1 | $35B |
|
||
Price history
+104.3% since first listed3 events — show timeline
- 2025-11-08 Price Changed $235,000 Stellar MLS as Distributed by MLS Grid
- 2025-10-30 Listed $250,000 Stellar MLS as Distributed by MLS Grid
- 2019-02-27 Sold (Public Records) $115,000 Public Records
Property tax history
+3.4%/yrLatest (2025): $660 · +1.5% YoY. Source: county tax records.
Cash-flow waterfall
monthlySold comps — $/sqft
last 12 mo · ≤1 miLoading sold comps…