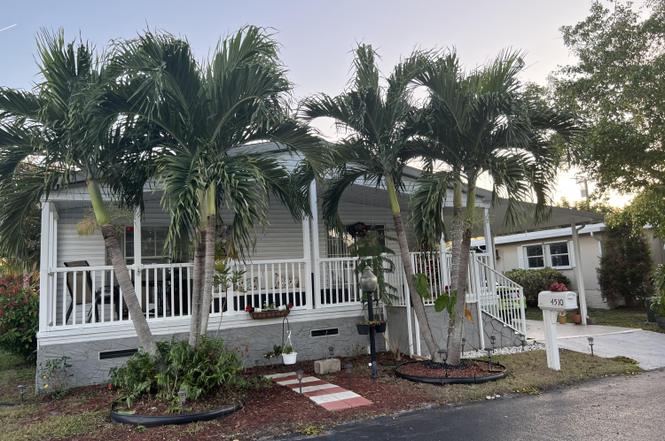
4510 NW 67th Ct NW · Coconut Creek, FL
Flood risk 1/10 · Minimal
- FEMA flood zone
- X (unshaded)
- Chance of flooding over 30 yrs
- 0.0%
- Est. flood insurance / yr
- $507 – $1,088
Fire risk 1/10 · Minimal
- Est. fire insurance / yr
- $947 – $1,759
Heat risk 10/10 · Severe
- Hot days now (above 107°F)
- 7 days/yr
- Hot days in 30 yrs
- 28 days/yr
Wind risk 10/10 · Severe
- Chance of severe wind over 30 yrs
- 99.0%
Air-quality risk 3/10 · Minor
- Unhealthy air days now
- 2 days/yr
- Unhealthy air days in 30 yrs
- 3 days/yr
Risk factors via First Street. Map © Google.
Why this score? — see what drove the B+ grade
The composite is a weighted blend of 9 inputs, each scored 0–100. Each bar is that input's sub-score; the figure is the points it added to the 100-point composite (weight × sub-score).
- Cash flow +30.0/30.0
- 1% rule +10.0/10.0
- DSCR +10.0/10.0
- ARV discount +7.5/15.0
- Appreciation +4.6/10.0
- Livability +4.2/5.0
- Schools +4.1/10.0
- Rent growth +2.9/5.0
- Condition / age +2.5/5.0
$179,999
🖨 Deal sheet (PDF) 📄 Offer letter ✓ Due diligence
Listing remarks
THIS IS A BEAUTIFUL 3/2 MOBILE HOME WITH A LAND LEASING. COMPLETED RENOVATED, DEERFIELD LAKE IS A 55+ GATED COMMUNITY THAT OFFERS GREAT COMFORT AND SERENITY. THE LOT RENTAL IS $1,106.00 PER MONTH WHICH INCLUDES: TRASH REMOVAL, LAWN CARE, PEST CONTROL AND WATER. OWNER IS OFFERING TO PAY TWO(2) MONTH LOT RENTAL.
Key facts
- 3 garage spots
- Built 2004
- Listed 315 days
Property features AI
Finance
- HOA & community: Senior community; Pets allowed with breed, number, and size restrictions
Exterior
- Parking: Attached garage and carport; 3 garage spaces; 3 carport spaces; Covered parking for 6 vehicles
- Security: Key card entry; Window bars; Gated community (no guard)
- Utilities: Three-phase electric
- Home design: Manufactured home (Model: SKYO); Single-story; Resale condition; Faces north; Accessible doors with ramp
- Construction: Aluminum siding, frame construction, and vinyl siding; Metal roof; Aluminum skirting; Mobile home length 59 ft and width 33 ft; Mobile home remains on site
- Exterior features: Shed(s); Zero lot line; Not waterfront
Interior
- Kitchen: Electric range; Refrigerator; Electric water heater
- Bedrooms: 3 bedrooms on the main level
- Flooring: Laminate flooring
- Bathrooms: 2 full bathrooms
- Heating & cooling: Central electric heating; Central air conditioning (electric)
- Interior features: Walk-in closets; Closet cabinetry; Blinds on windows; Unfurnished
- Laundry & utility: Inside laundry with laundry closet and washer hookup
Neighborhood map
What this means for you Summary
Snapshot
- This is a 3-bed/2.0-bath manufactured listed at $180k.
Deal economics
- At list price, monthly cash flow is $1k ($17k/yr) — positive.
- The deal already cash-flows at list — no discount required.
- Meets the 1% rule at list price ($3k rent vs $180k).
- Recommended offer: $158k (12.0% below list) — sets the bar for market timing.
- Cap rate 15.6% vs local median 3.7% in Coconut Creek — top-decile yield for the area; either an underpriced asset or a hidden risk that comps aren't pricing in. Stress-test before assuming the spread holds.
Location & tenants
- Location reads 85/100 on livability (#30 in FL, #617 nationally) — a professional / high-income tenant draw. Strengths: commute A+, housing A+, health & safety A+; Watch: amenities F.
- Broward (suburban): math 42% / reading 53% proficiency, ranked #46 of 73 in FL (top 63%) — families likely to look elsewhere, expect single-tenant / working-renter base with shorter leases.
- Market conditions: Rents rising (+1.6%/yr); 155 active listings in the ZIP; 40 comparable units currently listed for rent nearby; rentals at typical pace (median 16d on market — plan ~3-4 weeks tenant-placement turnaround); solid renter incomes; 2,111 units permitted in Broward County in 2024 (1,265 in 5+ unit buildings).
- This rent runs 41% of the median local income ($97k/yr) — at the standard rent-burdened threshold; future hikes will face affordability resistance.
Forward outlook
- Local home prices are declining (-0.8%/yr); year-one equity from $1k of loan paydown is wiped out by about $1k of value loss. Plan a longer hold.
- Broward County population projected at +34% by 2050 — long-run rental-demand tailwind backs the buy-and-hold thesis.
- At projected returns (-0.8% appreciation + 1.6% rent growth), your $50k cash investment doubles in ~3 years — after that, you're playing with house money.
Negotiation context
- It's been on market 316 days — a 12% lower offer ($158k) is reasonable based on typical stale-listing flexibility.
- 3 sale attempts; this cycle's ask has dropped $30k (14%) from the opening price — seller is motivated, your offer sets the floor, not the list.
Risks & watch-outs
- Climate carrying-cost: severe wind risk, 99% chance of damaging wind over 30y; extreme-heat days projected 7→28/yr by 2055 (HVAC capex compounding) — expect insurance premiums to compound above CPI over the hold.
Questions for the listing agent
- It's been on market 316 days. Have you received any prior offers? Is the seller open to a 12% concession, seller financing, or rate buy-down credit?
- Why hasn't it sold? Are there any deal-killer items the seller is aware of (foundation, flood, title, zoning, code violations)?
- Is there a deadline driving the sale (1031 exchange, divorce, estate, relocation)? That informs how much negotiation room exists.
- Schools are B-rated — typically a magnet for longer-tenancy family renters. What's the average tenant stay here, and is there a school-zone premium baked into asking?
- What's the average days-on-market for RENTAL listings here right now (not sales)? A rising rental-DOM trend means longer vacancies and softer asking-rent achievability than the comps imply.
- What's the recent tenant-quality profile in this submarket — average credit score on applications, eviction rate, late-payment / NSF rate, and stable-employment percentage? A property-management company in the area should have these aggregated.
- How much new for-sale + rental construction is in the pipeline within 1–3 miles? Heavy new supply typically softens prices + rents 12–24 months out; constrained supply supports both.
Investment metrics
- 1% rule
- 1.86% ✓
- Cap rate
- 15.63%
- Cash-on-cash
- 33.35%
- DSCR
- 2.48
- GRM
- 4.5
CMA / ARV
No comps found within radius.
Projected returns pro-forma
-0.77% appreciation · 1.64% rent growth · sell at horizon
- IRR
- 31.3%
- Equity multiple
- 2.45×
- Total profit
- $73,061
- Equity at exit
- $45,435
- IRR
- 35.0%
- Equity multiple
- 4.52×
- Total profit
- $177,268
- Equity at exit
- $49,424
Cash invested: $50,400 (down + closing). Projections, not guarantees.
Landlord ↔ Tenant lean methodology
- Overall (STATE)
- 87 Strongly Landlord-Friendly
- State Florida
- 87 Strongly Landlord-Friendly · R+3
- County
- — inherits STATE
- City
- — inherits STATE
ZIP-level market 33073
- Home prices YoY
- -0.2%
- Rents YoY
- 1.6%
- Active inventory
- 155
- Price-to-rent
- 4.5×
Monthly cashflow live
- Estimated rent
- $3,348 high interval (Pro) →
- Mortgage (P&I)
- −$944
- Tax est. 1.5%
- −$225 /mo · $2,700/yr
- Insurance
- −$75
- HOA
- −$0
- Vacancy / Maint / Mgmt
- −$703
- Net cashflow
- $1,401
Break-even live
Sensitivity live
| Price | -10% $1,525 | -5% $1,463 | +0% $1,401 | +5% $1,339 | +10% $1,276 |
|---|---|---|---|---|---|
| Rent | -10% $1,136 | -5% $1,269 | +0% $1,401 | +5% $1,533 | +10% $1,665 |
| Rate | -1.0pp $1,491 | -0.5pp $1,447 | base $1,401 | +0.5pp $1,354 | +1.0pp $1,307 |
UW: 25.0% down · 7.5% · 30yr · 1.5% tax · 5.0% vac · 8.0% maint · 8.0% mgmt
Financing live
Cash to close
- Down payment
- $45,000
- Closing costs
- $5,400
- Reserves months
- —
- Total cash needed
- —
Loan-product check · same deal, 3 products live
Conventional
25% down · 7.5% · 30yr
- Down + closing
- —
- Monthly P&I
- —
- Monthly cashflow
- —
- DSCR
- —
- Eligible?
- —
Personal DTI + credit; lowest rate.
DSCR
20% down · 8.5% · 30yr
- Down + closing
- —
- Monthly P&I
- —
- Monthly cashflow
- —
- DSCR
- —
- Eligible?
- —
No personal income docs; deal must DSCR.
Hard money
10% down · 12.0% · 12mo
- Down + closing
- —
- Monthly P&I
- —
- Monthly cashflow
- —
- DSCR
- —
- Eligible?
- —
Short-term bridge; refi at stabilization.
Rent comps 40 comps
| Address | Beds | Baths | Sqft | Rent | $/sqft | DOM | Units | Dist |
|---|---|---|---|---|---|---|---|---|
| 4907 Pelican Mnr Coconut Creek, FL | 3.0 | 2.5 | 1816 | $4,000 | $2.20 | 25d | 1 | 0.36mi |
| 4907 Pelican Mnr Coconut Creek, FL | 3.0 | 2.5 | 1816 | $4,000 | $2.20 | 5d | 1 | 0.36mi |
| 4967 Pelican Mnr Coconut Creek, FL | 3.0 | 2.0 | 1515 | $3,557 | $2.35 | 0d | 1 | 0.42mi |
| 6642 NW 42nd Ave Coconut Creek, FL | 4.0 | 2.0 | 1925 | $3,595 | $1.87 | 23d | 1 | 0.43mi |
| 6132 Grand Cypress Cir E Coconut Creek, FL | 3.0 | 2.5 | 1935 | $3,300 | $1.71 | 25d | 1 | 0.49mi |
| 4755 Cypress St Unit 4755 Coconut Creek, FL | 3.0 | 2.5 | 1935 | $3,375 | $1.74 | 15d | 1 | 0.57mi |
| 5952 NW 47th Ter Unit 5952 Coconut Creek, FL | 3.0 | 2.5 | 1573 | $3,150 | $2.00 | 25d | 1 | 0.60mi |
| 6077 Grand Cypress Cir W Coconut Creek, FL | 3.0 | 2.5 | 1935 | $3,300 | $1.71 | 3d | 1 | 0.60mi |
| 6979 Pines Cir Unit 35 Coconut Creek, FL | 3.0 | 2.5 | 1734 | $3,550 | $2.05 | 12d | 1 | 0.63mi |
| 6956 Julia Gardens Dr Coconut Creek, FL | 3.0 | 2.5 | 1888 | $3,500 | $1.85 | 25d | 1 | 0.67mi |
| 4752 NW 59th Mnr Coconut Creek, FL | 3.0 | 2.5 | 1573 | $3,000 | $1.91 | 25d | 1 | 0.69mi |
| 6950 Long Pine Cir Unit 6950 Coconut Creek, FL | 3.0 | 2.5 | 1449 | $3,200 | $2.21 | 16d | 1 | 0.73mi |
| 3600 W Hillsboro Blvd Coconut Creek, FL | 1.0–3.0 | 1.0–2.0 | 1128 | $2,887 | $2.56 | 0d | 13 | 0.76mi |
| 4814 NW 58th Mnr Coconut Creek, FL | 2.0 | 2.5 | 1407 | $2,600 | $1.85 | 18d | 1 | 0.76mi |
| 4814 NW 58th Mnr Coconut Creek, FL | 2.0 | 2.5 | 1407 | $2,500 | $1.78 | 6d | 1 | 0.76mi |
| 5201 W Hillsboro Blvd Coconut Creek, FL | 1.0–3.0 | 1.0–2.0 | 1072 | $3,628 | $3.38 | 0d | 28 | 0.78mi |
| 3621 W Hillsboro Blvd Coconut Creek, FL | 1.0–2.0 | 1.0–2.5 | 961 | $2,516 | $2.62 | 0d | 7 | 0.82mi |
| 6343 NW 36th Ave Coconut Creek, FL | 3.0 | 2.5 | 2151 | $4,000 | $1.86 | 25d | 1 | 0.88mi |
| 6352 NW 36th Ave Coconut Creek, FL | 3.0 | 2.0 | 1392 | $3,500 | $2.51 | 25d | 1 | 0.91mi |
| 5528 Lake Tern Ct Coconut Creek, FL | 4.0 | 2.5 | 2054 | $3,450 | $1.68 | 9d | 1 | 0.92mi |
| 5528 Lake Tern Ct Coconut Creek, FL | 4.0 | 2.5 | 2054 | $3,450 | $1.68 | 12d | 1 | 0.92mi |
| 5400 Lyons Rd Coconut Creek, FL | 1.0–3.0 | 1.0–2.0 | 1072 | $3,069 | $2.86 | 0d | 44 | 0.98mi |
| 5514 NW 41st Ter Coconut Creek, FL | 3.0 | 2.0 | 1378 | $3,900 | $2.83 | 21d | 1 | 0.99mi |
| 5520 NW 61st St #205 Coconut Creek, FL | 2.0 | 2.0 | 1130 | $2,250 | $1.99 | 9d | 1 | 1.01mi |
| 5813 Eagle Cay Ln Coconut Creek, FL | 4.0 | 3.5 | 2110 | $3,500 | $1.66 | 16d | 1 | 1.01mi |
| 6112 N State Road 7 Coconut Creek, FL | 1.0–3.0 | 1.0–2.0 | 1164 | $3,640 | $3.13 | 4d | 34 | 1.02mi |
| 5530 NW 61st St #321 Coconut Creek, FL | 2.0 | 2.0 | 1130 | $1,975 | $1.75 | 25d | 1 | 1.03mi |
| 23466 Lyons Rd #504 Boca Raton, FL | 2.0 | 2.0 | 1127 | $2,300 | $2.04 | 25d | 1 | 1.14mi |
| 11 NW 45th Ave Deerfield Beach, FL | 1.0–3.0 | 1.0–2.5 | 1097 | $3,290 | $3.00 | 0d | 17 | 1.17mi |
| 23442 Lyons Rd #406 Boca Raton, FL | 2.0 | 2.0 | 1218 | $2,300 | $1.89 | 25d | 1 | 1.18mi |
| 5460 NW 38th Ter Coconut Creek, FL | 3.0 | 2.0 | 1667 | $4,100 | $2.46 | 25d | 1 | 1.19mi |
| 5142 NW 43rd Ave Coconut Creek, FL | 4.0 | 2.0 | 1903 | $4,250 | $2.23 | 18d | 1 | 1.22mi |
| 6310 NW 58th Way Unit 1 Parkland, FL | 3.0 | 2.0 | 1842 | $4,199 | $2.28 | 0d | 1 | 1.24mi |
| 6310 NW 58th Way Unit 1 Parkland, FL | 3.0 | 2.0 | 1842 | $4,299 | $2.33 | 12d | 1 | 1.24mi |
| 5800 NW 74th Pl Coconut Creek, FL | 1.0–2.0 | 1.0–2.0 | 1115 | $2,564 | $2.30 | 0d | 17 | 1.27mi |
| 5851 Holmberg Rd Parkland, FL | 1.0–3.0 | 1.0–2.5 | 1255 | $3,534 | $2.82 | 0d | 30 | 1.30mi |
| 23312 SW 53rd Ave Unit C Boca Raton, FL | 3.0 | 2.5 | 1412 | $3,100 | $2.20 | 25d | 1 | 1.30mi |
| 243 NW 45th Ave #243 Deerfield Beach, FL | 2.0 | 2.5 | 1748 | $2,600 | $1.49 | 9d | 1 | 1.31mi |
| 8951 SW 19th St Unit A Boca Raton, FL | 2.0 | 2.0 | 1196 | $2,800 | $2.34 | 18d | 1 | 1.32mi |
| 1245 SW 46th Way Deerfield Beach, FL | 3.0 | 2.0 | 1558 | $3,600 | $2.31 | 25d | 1 | 1.34mi |
Listing history 23 events
-
2026-06-21pricedays on market $179,999 Active 316 DOM
-
2026-06-18days on market $184,999 Active 313 DOM
-
2026-06-17days on market $184,999 Active 312 DOM
-
2026-06-16days on market $184,999 Active 311 DOM
-
2026-06-15remarks 311-char remark
-
2026-06-15days on market $184,999 Active 310 DOM
-
2026-06-13days on market $184,999 Active 308 DOM
-
2026-06-09days on market $184,999 Active 304 DOM
-
2026-06-07days on market $184,999 Active 302 DOM
-
2026-06-04days on market $184,999 Active 299 DOM
-
2026-06-03days on market $184,999 Active 298 DOM
-
2026-06-02days on market $184,999 Active 297 DOM
-
2026-06-01days on market $184,999 Active 296 DOM
-
2026-05-31days on market $184,999 Active 295 DOM
-
2026-05-07status Active
-
2026-05-04historical
-
2026-02-06price $184,999
-
2026-02-06status Active
-
2026-02-06historical
-
2026-01-08price $189,999
-
2025-10-14price $199,999
-
2025-10-07price $204,999
-
2025-08-06$209,999 Active
ⓘ Source: listings_history table (triggers on properties + properties_extension) + one-shot
backfill from property_details.listing_events for pre-trigger history.
Climate risk First Street
- Flood 1/10 Low FEMA zone X (unshaded) · 0% chance over 30 yrs
- Wildfire 1/10 Low
- Heat 10/10 Extreme 7 d/yr ≥107°F today · 28 d/yr by 30 yrs out
- Wind 10/10 Extreme 99% chance of damaging wind over 30 yrs
- Air quality 3/10 Moderate 2 unhealthy d/yr today · 3 by 30 yrs out
Nearby sold comps map
Loading sold comps map…
Walkable amenities ~0.75 mi
Loading nearby amenities…
Taxation est. · year 1
- Rental income
- $40,173
- − Mortgage interest
- −$10,083
- − Property taxes
- −$2,700
- − Insurance
- −$900
- − Repairs & maintenance
- −$3,214
- − Management
- −$3,214
- − Depreciation
- −$5,236
- Taxable income
- $14,826
- Est. tax owed @ 24.0%
- −$3,558
- After-tax cash flow
- $13,251/yr
For passive investors: Depreciation is non-cash, so a rental often shows a tax loss while cash-flowing — sheltering income. Rental losses are passive: they offset passive income freely, and up to $25,000/yr can offset ordinary (W-2) income if you actively participate and your MAGI is under $100k (phasing out to $0 by $150k); unused losses carry forward. On sale, claimed depreciation is recaptured at up to 25%, and gains may owe capital-gains tax (a 1031 exchange can defer both). Figures are a year-1 estimate at your 24.0% rate — not tax advice; consult a CPA.
Schools (NCES district)
- District
- Broward
- NCES district ID
- 1200180
- Math proficiency
- 42% ▼ -18.00%
- Reading proficiency
- 53% ▼ -5.00%
- Median HH income
- $52,139
- Composite
- 40.88/100
- National rank
- #3621
- State rank
- #46 of 73 in FL
Livability — Coconut Creek
- Score
- 85/100
- State rank
- #30
- US rank
- #617
Category grades
Schools grade is shown separately in the Schools card above.
Census & demographics
- Census place
- Coconut Creek, FL
- County
- Broward County · 1,963,430 people
- City population
- 50,557
- Metro
- Miami-Fort Lauderdale-Pompano Beach, FL
- Population (ZIP)
- 33,838
- Household income
- $97,412
- Rent vs Own
- Severe rent burden
- 1109.0
Population outlook (Broward County) Hauer SSP2
- Today (2025)
- 2,207,033 people
- By 2030
- 2,360,704 · +7.0%
- By 2040
- 2,661,208 · +20.6%
- By 2050
- 2,946,698 · +33.5%
- By 2075
- 3,602,273 · +63.2%
- By 2100
- 3,970,984 · +79.9%
Race, ethnicity, and origin ACS 2023
- Neighborhood character
- Highly diverse neighborhood (Simpson 0.70)
- Race & ethnicity
- White 43% Hispanic / Latino 28% Two or more races 18% Black 17% Asian 3%
- Hispanic origin (detail)
- Mexican 2% Puerto Rican 4% Cuban 4% Dominican 2%
- Common ancestry
- Estonian 6% Hispanic 3% Romanian 2%
- Foreign-born
- 35% · Canada, Jamaica, China
- Languages at home
- 58% English-only · Spanish 23% Other Indo-European 11% French/Haitian/Cajun 4%
Political lean MEDSL · Broward
- 2024 margin
- D (+17.0) · D 58.0% · R 41.0%
- 2008→2024 swing
- -17.8pp toward R · 2008: 34.7pp · 2024: 17.0pp
- All cycles
- 2024: D+17.0 2020: D+29.8 2016: D+35.0 2012: D+34.9 2008: D+34.7
Not yet ingested
- Civics
- —
Market trends
- HPI YoY
- ▼ -0.77%
- Current HPI
- 337.0725
- Rent YoY
- ▲ 1.64%
- Metro
- Miami-Fort Lauderdale-Pompano Beach, FL
- State GDP YoY
- ▲ 3.28%
- F500 in state
- 36
Industry mix (Fortune 500 HQ in FL)
| Industry | F500 HQs | Revenue |
|---|---|---|
| Industrial Technology | 2 | $29B |
|
||
| Insurance | 2 | $17B |
|
||
| Retail | 1 | $60B |
|
||
| Technology Distribution | 1 | $58B |
|
||
| Homebuilding | 1 | $35B |
|
||
| Technology Manufacturing | 1 | $35B |
|
||
Price history
-11.9% since first listed9 events — show timeline
- 2026-05-07 Relisted — Beaches MLS
- 2026-05-04 Listing Removed — Beaches MLS
- 2026-02-06 Price Changed $184,999 Beaches MLS
- 2026-02-06 Relisted — Beaches MLS
- 2026-02-06 Listing Removed — Beaches MLS
- 2026-01-08 Price Changed $189,999 Beaches MLS
- 2025-10-14 Price Changed $199,999 Beaches MLS
- 2025-10-07 Price Changed $204,999 Beaches MLS
- 2025-08-06 Listed $209,999 Beaches MLS
Cash-flow waterfall
monthlySold comps — $/sqft
last 12 mo · ≤1 miLoading sold comps…