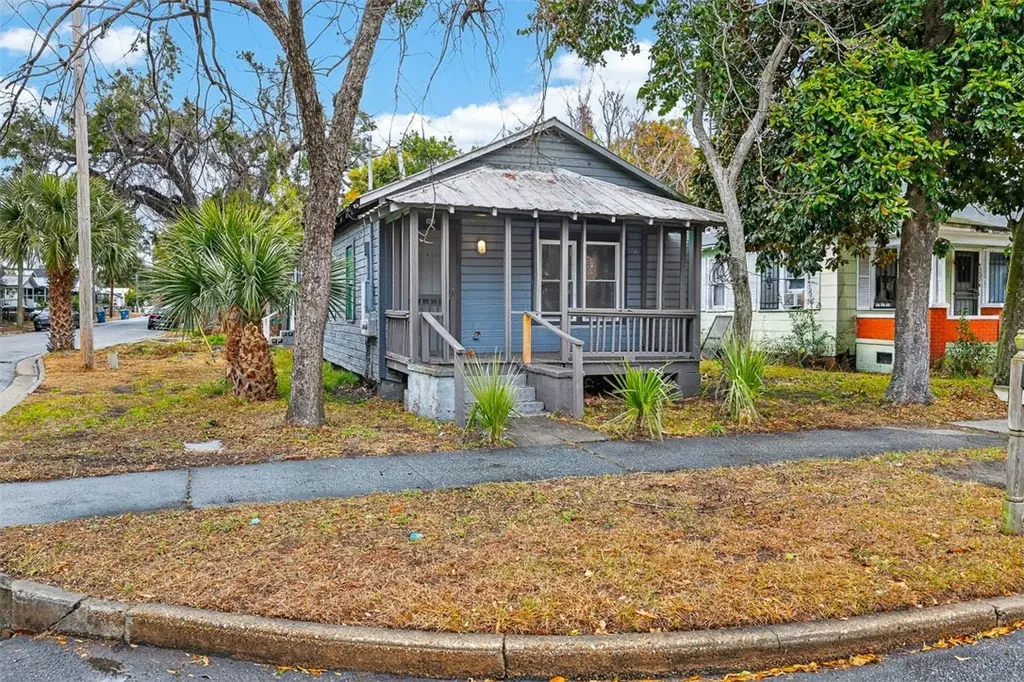
1201 I St · Brunswick, GA
Flood risk 8/10 · Major
- FEMA flood zone
- X (shaded)
- Chance of flooding over 30 yrs
- 0.97%
- Est. flood insurance / yr
- $507 – $1,088
Fire risk 6/10 · Moderate
- Est. fire insurance / yr
- $963 – $1,789
Heat risk 10/10 · Severe
- Hot days now (above 108°F)
- 7 days/yr
- Hot days in 30 yrs
- 20 days/yr
Wind risk 9/10 · Severe
- Chance of severe wind over 30 yrs
- 99.0%
Air-quality risk 4/10 · Minor
- Unhealthy air days now
- 5 days/yr
- Unhealthy air days in 30 yrs
- 5 days/yr
Risk factors via First Street. Map © Google.
Why this score? — see what drove the B- grade
The composite is a weighted blend of 9 inputs, each scored 0–100. Each bar is that input's sub-score; the figure is the points it added to the 100-point composite (weight × sub-score).
- Cash flow +30.0/30.0
- 1% rule +10.0/10.0
- DSCR +10.0/10.0
- ARV discount +5.9/15.0
- Rent growth +3.8/5.0
- Schools +3.4/10.0
- Livability +3.0/5.0
- Condition / age +2.5/5.0
- Appreciation +0.0/10.0
$80,000
🖨 Deal sheet 📄 Offer letter ✓ Due diligence
Listing remarks MLS
GREAT INVESTOR OPPORTUNITY! This 3 bedroom, 1 bath home sits on a corner lot and features a carport. The HVAC was replaced approximately 2 years ago. Conveniently located just minutes from historic downtown Brunswick and about 15 minutes from the beaches. Ideal for renovation or rental opportunity!
Key facts
- Hvac replaced
- Minutes from beaches
- Carport
Tags
Neighborhood map
What this means for you Summary
Snapshot
- This is a 3-bed/1.0-bath single-family listed at $80k.
Deal economics
- At list price, monthly cash flow is $654 ($8k/yr) — positive.
- The deal already cash-flows at list — no discount required.
- Meets the 1% rule at list price ($2k rent vs $80k).
- Recommended offer: $73k (9.0% below list) — sets the bar for market timing.
- Cap rate 17.1% vs local median 4.1% in Brunswick — top-decile yield for the area; either an underpriced asset or a hidden risk that comps aren't pricing in. Stress-test before assuming the spread holds.
Location & tenants
- Location reads 59/100 on livability (#401 in GA) — a working-class tenant base; expect higher turnover. Strengths: cost of living A+, housing B+; Watch: crime D, schools D-, amenities F.
- Glynn County (other): math 37% / reading 42% proficiency, ranked #47 of 174 in GA (top 27%) — families likely to look elsewhere, expect single-tenant / working-renter base with shorter leases.
- Market conditions: Rents rising fast (+5.1%/yr); 183 active listings in the ZIP; 7 comparable units currently listed for rent nearby; rentals lingering (median 44d on market — plan ~5-8 weeks vacancy on turnover, expect pricing pressure); 57% of comp listings sitting > 30 days — soft ceiling on asking rent; lower-income renter base — watch delinquency; 734 units permitted in Glynn County in 2024 (136 in 5+ unit buildings).
- At $1,550/mo this rent would consume 46% of the median local household income ($40k/yr) (locally 1406% of renters already pay >50% of income on rent) — very limited rent-growth headroom before tenants either downsize or default.
Forward outlook
- Local home prices are declining (-3.0%/yr); year-one equity from $553 of loan paydown is wiped out by about $2k of value loss. Plan a longer hold.
- Glynn County population projected at +13% by 2050 — modest demand growth; plan on rents tracking national, not racing it.
- At projected returns (-3.0% appreciation + 5.1% rent growth), your $22k cash investment doubles in ~4 years — after that, you're playing with house money.
Negotiation context
- It's been on market 104 days — a 9% lower offer ($73k) is reasonable based on typical stale-listing flexibility.
- 8 sale attempts since 19y ago with the ask held roughly flat each time — persistent listings suggest the price (not the market) is what's stuck; bring a comps-based counter.
- Current owner paid $60k; 32% above their basis — modest negotiation headroom, anchor on the comps not their cost.
Risks & watch-outs
- Watch-outs: flood insurance adds $66/mo; built in 1948 — expect roof / HVAC / electrical / plumbing capex.
- Climate carrying-cost: severe flood risk; severe wind risk, 99% chance of damaging wind over 30y; major wildfire risk; extreme-heat days projected 7→20/yr by 2055 (HVAC capex compounding) — expect insurance premiums to compound above CPI over the hold.
Questions for the listing agent
- It's been on market 104 days. Have you received any prior offers? Is the seller open to a 9% concession, seller financing, or rate buy-down credit?
- Built in 1948 — when were the roof, HVAC, electrical panel, plumbing, and water heater last replaced?
- What's the actual annual flood-insurance premium (NFIP or private), and is the property in a SFHA with mandatory coverage?
- Why hasn't it sold? Are there any deal-killer items the seller is aware of (foundation, flood, title, zoning, code violations)?
- Is there a deadline driving the sale (1031 exchange, divorce, estate, relocation)? That informs how much negotiation room exists.
- Schools are D-rated, which usually means shorter tenancies and higher turnover. Who's the typical renter profile here, and what's been the actual vacancy rate?
- Crime grade is D in this area — have there been break-ins, vandalism, or insurance claims at this property in the last 3 years? What carrier currently insures it and at what premium?
- What's the average days-on-market for RENTAL listings here right now (not sales)? A rising rental-DOM trend means longer vacancies and softer asking-rent achievability than the comps imply.
- What's the recent tenant-quality profile in this submarket — average credit score on applications, eviction rate, late-payment / NSF rate, and stable-employment percentage? A property-management company in the area should have these aggregated.
- How much new for-sale + rental construction is in the pipeline within 1–3 miles? Heavy new supply typically softens prices + rents 12–24 months out; constrained supply supports both.
Investment metrics
- 1% rule
- 1.94% ✓
- Cap rate
- 17.11%
- Cash-on-cash
- 38.62%
- DSCR
- 2.72
- GRM
- 4.3
CMA / ARV
- ARV (median comp)
- $77,285
- List price
- $80,000
- Delta
- 3.51%
- Verdict
- FAIR
- Comps
- 20 within 1.0 mi
Show comp detail 12 sales within ~0.75 mi
| Address | Dist | Beds/Ba | Sqft | Sold | Price | $/sf | Match |
|---|---|---|---|---|---|---|---|
| 1709 Amherst St | 0.19mi | 3/1.0 | 960 (-9%) | 4mo | $80,000 | $83 | 74 |
| 2229 Reynolds St | 0.44mi | 2/1.0 (-1) | 1,053 (+0%) | 5mo | $135,000 | $128 | 70 |
| 1203 M St | 0.38mi | 3/2.0 | 1,144 (+9%) | 0mo | $55,000 | $48 | 63 |
| 1701 Niles Ave | 0.53mi | 3/1.0 | 1,000 (-5%) | 6mo | $139,000 | $139 | 62 |
| 2219 Reynolds St | 0.43mi | 4/1.0 (+1) | 1,104 (+5%) | 8mo | $72,500 | $66 | 60 |
| 1403 Lee St | 0.53mi | 3/1.0 | 1,127 (+7%) | 7mo | $80,000 | $71 | 57 |
| 2308 Albany St | 0.40mi | 2/1.0 (-1) | 1,140 (+9%) | 7mo | $95,000 | $83 | 56 |
| 2407 Bartow St | 0.63mi | 3/1.0 | 1,000 (-5%) | 9mo | $130,000 | $130 | 55 |
| 2210 J | 0.56mi | 2/1.0 (-1) | 972 (-7%) | 6mo | $33,000 | $34 | 51 |
| 1926 Wilson Ave | 0.72mi | 3/1.0 | 960 (-9%) | 3mo | $120,000 | $125 | 50 |
| 2119 Reynolds St | 0.35mi | 2/1.0 (-1) | 918 (-13%) | 12mo | $105,000 | $114 | 48 |
| 2611 Albany St | 0.70mi | 3/2.0 | 1,142 (+9%) | 7mo | $110,000 | $96 | 43 |
Match score weights: distance 35% · size 25% · config 20% · recency 20%. Top-matched comps best support the ARV.
Projected returns pro-forma
-3.0% appreciation · 5.08% rent growth · sell at horizon
- IRR
- 33.0%
- Equity multiple
- 2.43×
- Total profit
- $32,060
- Equity at exit
- $11,928
- IRR
- 41.1%
- Equity multiple
- 5.28×
- Total profit
- $95,903
- Equity at exit
- $6,917
Cash invested: $22,400 (down + closing). Projections, not guarantees.
Landlord ↔ Tenant lean methodology
- Overall (STATE)
- 90 Strongly Landlord-Friendly
- State Georgia
- 90 Strongly Landlord-Friendly · R+3
- County
- — inherits STATE
- City
- — inherits STATE
ZIP-level market 31520
- Rents YoY
- 5.1%
- Active inventory
- 183
- Price-to-rent
- 4.3×
Monthly cashflow live
- Estimated rent
- $1,550 high interval (Pro) →
- Mortgage (P&I)
- −$420
- Tax from tax record
- −$51 /mo · $613/yr
- Insurance
- −$33
- Flood insurance flood zone
- −$66 /mo · $798/yr
- HOA
- −$0
- Vacancy / Maint / Mgmt
- −$326
- Net cashflow
- $654
Break-even live
UW: 25.0% down · 7.5% · 30yr · 1.5% tax · 5.0% vac · 8.0% maint · 8.0% mgmt
Financing live
Cash to close
- Down payment
- $20,000
- Closing costs
- $2,400
- Reserves months
- —
- Total cash needed
- —
Loan-product check · same deal, 3 products live
Conventional
25% down · 7.5% · 30yr
- Down + closing
- —
- Monthly P&I
- —
- Monthly cashflow
- —
- DSCR
- —
- Eligible?
- —
Personal DTI + credit; lowest rate.
DSCR
20% down · 8.5% · 30yr
- Down + closing
- —
- Monthly P&I
- —
- Monthly cashflow
- —
- DSCR
- —
- Eligible?
- —
No personal income docs; deal must DSCR.
Hard money
10% down · 12.0% · 12mo
- Down + closing
- —
- Monthly P&I
- —
- Monthly cashflow
- —
- DSCR
- —
- Eligible?
- —
Short-term bridge; refi at stabilization.
Rent comps 7 comps
| Address | Beds | Baths | Sqft | Rent | $/sqft | DOM | Units | Dist |
|---|---|---|---|---|---|---|---|---|
| 1501 G St Brunswick, GA | 3.0 | 2.0 | 1064 | $1,200 | $1.13 | 43d | 1 | 0.24mi |
| 2408 Gordon St Brunswick, GA | 3.0 | 2.0 | 1100 | $1,550 | $1.41 | 43d | 1 | 0.58mi |
| 1105 Grant St Brunswick, GA | 2.0 | 1.0 | 925 | $2,600 | $2.81 | 23d | 1 | 0.84mi |
| 502 Prince St Unit A Brunswick, GA | 2.0 | 1.0 | 928 | $1,100 | $1.19 | 3d | 1 | 1.03mi |
| 502 Prince St Apt B Brunswick, GA | 2.0 | 1.5 | 928 | $1,100 | $1.19 | 16d | 1 | 1.03mi |
| 2928 Reynolds St Brunswick, GA | 4.0 | 1.0 | 1398 | $1,800 | $1.29 | 43d | 1 | 1.06mi |
| 3220 Altama Ave Brunswick, GA | 3.0 | 2.0 | 1300 | $1,650 | $1.27 | 43d | 1 | 1.46mi |
Listing history 34 events
-
2026-06-19days on market $80,000 Active 104 DOM
-
2026-06-18days on market $80,000 Active 103 DOM
-
2026-06-17days on market $80,000 Active 102 DOM
-
2026-06-16days on market $80,000 Active 101 DOM
-
2026-06-15days on market $80,000 Active 100 DOM
-
2026-06-14days on market $80,000 Active 98 DOM
-
2026-06-13days on market $80,000 Active 97 DOM
-
2026-06-10days on market $80,000 Active 95 DOM
-
2026-06-09days on market $80,000 Active 94 DOM
-
2026-06-08days on market $80,000 Active 93 DOM
-
2026-06-07days on market $80,000 Active 92 DOM
-
2026-06-05days on market $80,000 Active 89 DOM
-
2026-06-03days on market $80,000 Active 88 DOM
-
2026-06-02days on market $80,000 Active 87 DOM
-
2026-06-01days on market $80,000 Active 86 DOM
-
2026-05-31days on market $80,000 Active 85 DOM
-
2026-05-30days on market $80,000 Active 84 DOM
-
2026-05-14status Active 300-char remark
Show marketing remark (300 chars)
GREAT INVESTOR OPPORTUNITY! This 3 bedroom, 1 bath home sits on a corner lot and features a carport. The HVAC was replaced approximately 2 years ago. Conveniently located just minutes from historic downtown Brunswick and about 15 minutes from the beaches. Ideal for renovation or rental opportunity!
-
2026-04-15status Pending 300-char remark
Show marketing remark (300 chars)
GREAT INVESTOR OPPORTUNITY! This 3 bedroom, 1 bath home sits on a corner lot and features a carport. The HVAC was replaced approximately 2 years ago. Conveniently located just minutes from historic downtown Brunswick and about 15 minutes from the beaches. Ideal for renovation or rental opportunity!
-
2026-02-06$80,000 Active 300-char remark
Show marketing remark (300 chars)
GREAT INVESTOR OPPORTUNITY! This 3 bedroom, 1 bath home sits on a corner lot and features a carport. The HVAC was replaced approximately 2 years ago. Conveniently located just minutes from historic downtown Brunswick and about 15 minutes from the beaches. Ideal for renovation or rental opportunity!
-
2022-10-24historical
-
2022-10-20status Active
-
2022-10-18status Pending
-
2022-09-09$65,000 Active
-
2022-04-27soldstatus $60,500
-
2022-04-27soldstatus $60,500
-
2022-02-11$68,000
-
2018-07-23soldstatus $19,500
-
2018-06-18$24,900
-
2012-12-11historical
-
2007-11-22historical
-
2007-09-11$26,950
-
2007-04-23$44,900
-
2007-03-17soldstatus $21,000
ⓘ Source: listings_history table (triggers on properties + properties_extension) + one-shot
backfill from property_details.listing_events for pre-trigger history.
Tax reassessment forecast GA · Resets to sale price
- Current annual tax
- $613 · $51/mo
- Projected year-2 tax
- $736 · $61/mo
- Expected delta
- +$123/yr (+$10/mo · 20.0%)
ⓘ Screening estimate from a state-policy table — verify with the county assessor before closing.
Climate risk First Street
- Flood 8/10 Severe FEMA zone X (shaded) · 97% chance over 30 yrs
- Wildfire 6/10 Major
- Heat 10/10 Extreme 7 d/yr ≥108°F today · 20 d/yr by 30 yrs out
- Wind 9/10 Extreme 99% chance of damaging wind over 30 yrs
- Air quality 4/10 Moderate 5 unhealthy d/yr today · 5 by 30 yrs out
Nearby sold comps map
Loading sold comps map…
Walkable amenities ~0.75 mi
Loading nearby amenities…
Taxation est. · year 1
- Rental income
- $18,605
- − Mortgage interest
- −$4,481
- − Property taxes
- −$613
- − Insurance
- −$1,198
- − Repairs & maintenance
- −$1,488
- − Management
- −$1,488
- − Depreciation
- −$2,327
- Taxable income
- $7,008
- Est. tax owed @ 24.0%
- −$1,682
- After-tax cash flow
- $6,170/yr
For passive investors: Depreciation is non-cash, so a rental often shows a tax loss while cash-flowing — sheltering income. Rental losses are passive: they offset passive income freely, and up to $25,000/yr can offset ordinary (W-2) income if you actively participate and your MAGI is under $100k (phasing out to $0 by $150k); unused losses carry forward. On sale, claimed depreciation is recaptured at up to 25%, and gains may owe capital-gains tax (a 1031 exchange can defer both). Figures are a year-1 estimate at your 24.0% rate — not tax advice; consult a CPA.
Schools (NCES district)
- District
- Glynn County
- NCES district ID
- 1302400
- Math proficiency
- 37% ▼ -9.00%
- Reading proficiency
- 42% ▼ -7.00%
- Median HH income
- $47,554
- Composite
- 33.83/100
- National rank
- #5359
- State rank
- #47 of 174 in GA
Livability — Brunswick
- Score
- 59/100
- State rank
- #401
- US rank
- #19832
Category grades
Schools grade is shown separately in the Schools card above.
Census & demographics
- Census place
- Brunswick, GA
- County
- Glynn County · 69,019 people
- City population
- 51,239
- Metro
- Brunswick, GA
- Population (ZIP)
- 22,313
- Household income
- $40,071
- Rent vs Own
- Severe rent burden
- 1406.0
Population outlook (Glynn County) Hauer SSP2
- Today (2025)
- 91,404 people
- By 2030
- 94,806 · +3.7%
- By 2040
- 100,060 · +9.5%
- By 2050
- 103,258 · +13.0%
- By 2075
- 107,970 · +18.1%
- By 2100
- 103,363 · +13.1%
Race, ethnicity, and origin ACS 2023
- Neighborhood character
- Diverse neighborhood (Simpson 0.63)
- Race & ethnicity
- Black 50% White 33% Hispanic / Latino 11% Two or more races 9% Asian 1%
- Hispanic origin (detail)
- Mexican 7%
- Common ancestry
- Italian 2% Slovak 1% Serbian 1%
- Foreign-born
- 8% · Canada, South Korea
- Languages at home
- 87% English-only · Spanish 10% French/Haitian/Cajun 1% Korean 1%
Political lean MEDSL · Glynn
- 2024 margin
- Strong R (+26.0) · D 36.8% · R 62.8%
- 2008→2024 swing
- -2.6pp toward R · 2008: -23.4pp · 2024: -26.0pp
- All cycles
- 2024: R+26.0 2020: R+23.2 2016: R+28.6 2012: R+27.0 2008: R+23.4
Not yet ingested
- Civics
- —
Market trends
- HPI YoY
- ▼ -274.83%
- Current HPI
- 180.4581
- Rent YoY
- ▲ 5.08%
- Metro
- Brunswick, GA
- State GDP YoY
- ▲ 2.66%
- F500 in state
- 28
Industry mix (Fortune 500 HQ in GA)
| Industry | F500 HQs | Revenue |
|---|---|---|
| Paper / Packaging | 2 | $29B |
|
||
| Retail | 1 | $160B |
|
||
| Transportation / Logistics | 1 | $91B |
|
||
| Airlines | 1 | $62B |
|
||
| Consumer Goods | 1 | $47B |
|
||
| Utilities | 1 | $25B |
|
||
Price history
+281.0% since first listed17 events — show timeline
- 2026-05-14 Relisted — GIAR
- 2026-04-15 Pending — GIAR
- 2026-02-06 Listed $80,000 GIAR
- 2022-10-24 Listing Removed — GIAR
- 2022-10-20 Relisted — GIAR
- 2022-10-18 Pending — GIAR
- 2022-09-09 Listed $65,000 GIAR
- 2022-04-27 Sold (Public Records) $60,500 Public Records
- 2022-04-27 Sold (MLS) $60,500 GIAR
- 2022-02-11 Listed $68,000 GIAR
- 2018-07-23 Sold (MLS) $19,500 GIAR
- 2018-06-18 Listed $24,900 GIAR
- 2012-12-11 Listing Removed — GIAR
- 2007-11-22 Listing Removed — GIAR
- 2007-09-11 Listed $26,950 GIAR
- 2007-04-23 Listed $44,900 GIAR
- 2007-03-17 Sold (Public Records) $21,000 Public Records
Property tax history
+2.9%/yrLatest (2025): $613 · +39.4% YoY. Source: county tax records.
Cash-flow waterfall
monthlySold comps — $/sqft
last 12 mo · ≤1 miLoading sold comps…