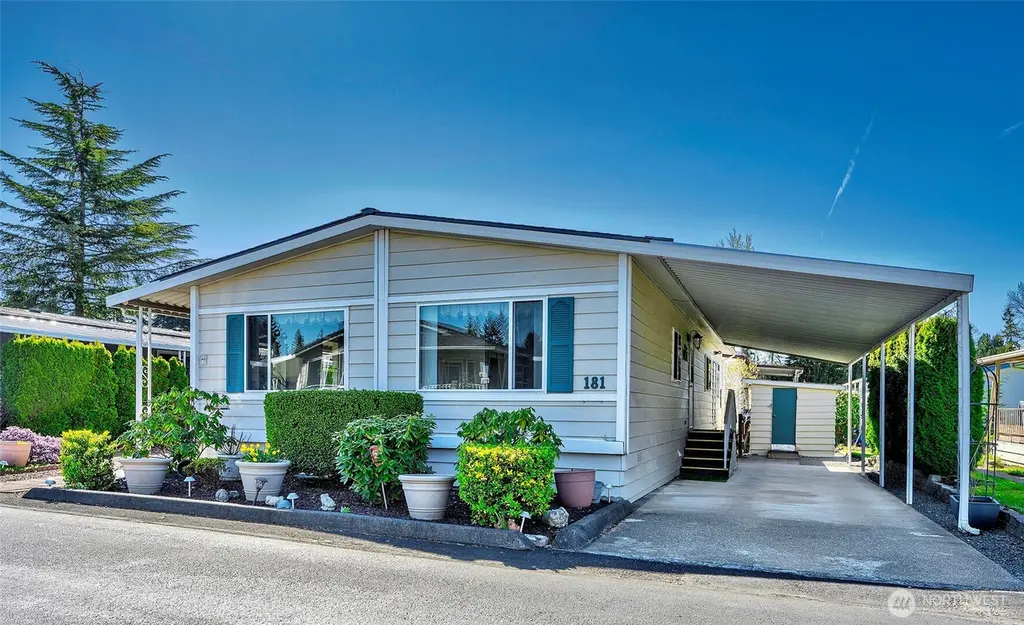
620 112th St SE #181 · Everett, WA
Flood risk No data
- FEMA flood zone
- —
- Chance of flooding over 30 yrs
- —
- Est. flood insurance / yr
- —
Fire risk No data
- Est. fire insurance / yr
- —
Heat risk No data
- Hot days now (above threshold)
- —
- Hot days in 30 yrs
- —
Wind risk No data
- Chance of severe wind over 30 yrs
- —
Air-quality risk No data
- Unhealthy air days now
- —
- Unhealthy air days in 30 yrs
- —
Risk factors via First Street. Map © Google.
Why this score? — see what drove the B+ grade
The composite is a weighted blend of 9 inputs, each scored 0–100. Each bar is that input's sub-score; the figure is the points it added to the 100-point composite (weight × sub-score).
- Cash flow +30.0/30.0
- ARV discount +15.0/15.0
- 1% rule +10.0/10.0
- DSCR +10.0/10.0
- Schools +5.9/10.0
- Livability +3.7/5.0
- Condition / age +2.5/5.0
- Rent growth +1.7/5.0
- Appreciation +0.0/10.0
$125,000
🖨 Deal sheet (PDF) 📄 Offer letter ✓ Due diligence
Listing remarks
Silver Lake area. Great neighborhood. Nice manufactured home in popular 55+ Lago De Plata Park. Home includes grand entry w/ cathedral ceilings and exposed beams, updated windows and roof, electric fireplace and built in cabinetry, painted millwork throughout, newer lvp flooring, oversized kitchen with skylight and sitting bar, good sized pantry, updated fixtures, large primary bedroom w/ huge walk-in shower, walk in closet as well. 2nd bedroom good sized w/ attached full bathroom, large garden area faces south with lots of sun, detached outbuilding/shed, covered sitting deck. Rare RV/Boat parking available. All appliances and washer/dryer included. Professionally cleaned and move in ready!
Key facts
- Grand entry
- Updated windows
- Cathedral ceilings
Tags
Neighborhood map
What this means for you Summary
Snapshot
- This is a 3-bed/2.0-bath manufactured listed at $125k.
Deal economics
- At list price, monthly cash flow is $1k ($14k/yr) — positive.
- The deal already cash-flows at list — no discount required.
- Meets the 1% rule at list price ($2k rent vs $125k).
- Recommended offer: $121k (3.0% below list) — sets the bar for market timing.
- Cap rate 17.8% vs local median 2.5% in Everett — top-decile yield for the area; either an underpriced asset or a hidden risk that comps aren't pricing in. Stress-test before assuming the spread holds.
Location & tenants
- Location reads 73/100 on livability (#199 in WA) — a middle-class / working-renter tenant base. Strengths: commute A+, housing A, health & safety A; Watch: schools C-, crime D+, amenities F.
- Everett School District (urban): math 60% / reading 72% proficiency, ranked #26 of 291 in WA (top 9%) — acceptable for families but not a draw, mixed tenant base, ~2y average lease.
- Market conditions: Rents falling (-3.2%/yr); 277 active listings in the ZIP; 40 comparable units currently listed for rent nearby; rentals leasing fast (median 3d on market — plan ~1-2 weeks tenant-placement turnaround); solid renter incomes; 3,982 units permitted in Snohomish County in 2024 (1,492 in 5+ unit buildings).
Forward outlook
- Local home prices are declining (-3.0%/yr); year-one equity from $864 of loan paydown is wiped out by about $4k of value loss. Plan a longer hold.
- Snohomish County population projected at +30% by 2050 — long-run rental-demand tailwind backs the buy-and-hold thesis.
- At projected returns (-3.0% appreciation + 0.0% rent growth), your $35k cash investment doubles in ~4 years — after that, you're playing with house money.
Negotiation context
- It's been on market 53 days — a 3% lower offer ($121k) is reasonable based on typical stale-listing flexibility.
- 4 sale attempts since 24y ago with the ask held roughly flat each time — persistent listings suggest the price (not the market) is what's stuck; bring a comps-based counter.
Questions for the listing agent
- It's been on market 53 days. Have you received any prior offers? Is the seller open to a 3% concession, seller financing, or rate buy-down credit?
- Built in 1979 — when were the roof, HVAC, electrical panel, plumbing, and water heater last replaced?
- Is there a deadline driving the sale (1031 exchange, divorce, estate, relocation)? That informs how much negotiation room exists.
- Crime grade is D in this area — have there been break-ins, vandalism, or insurance claims at this property in the last 3 years? What carrier currently insures it and at what premium?
- What's the average days-on-market for RENTAL listings here right now (not sales)? A rising rental-DOM trend means longer vacancies and softer asking-rent achievability than the comps imply.
- What's the recent tenant-quality profile in this submarket — average credit score on applications, eviction rate, late-payment / NSF rate, and stable-employment percentage? A property-management company in the area should have these aggregated.
- How much new for-sale + rental construction is in the pipeline within 1–3 miles? Heavy new supply typically softens prices + rents 12–24 months out; constrained supply supports both.
Investment metrics
- 1% rule
- 1.99% ✓
- Cap rate
- 17.79%
- Cash-on-cash
- 41.04%
- DSCR
- 2.83
- GRM
- 4.2
CMA / ARV
- ARV (median comp)
- $149,961
- List price
- $125,000
- Delta
- -16.64%
- Verdict
- UNDERPRICED
- Comps
- 15 within 1.0 mi
Show comp detail 12 sales within ~0.75 mi
| Address | Dist | Beds/Ba | Sqft | Sold | Price | $/sf | Match |
|---|---|---|---|---|---|---|---|
| 620 112th St SE #227 | 0.00mi | 3/2.0 | 1,404 (+5%) | 4mo | $108,000 | $77 | 89 |
| 620 112th St SE #153 | 0.00mi | 2/2.0 (-1) | 1,340 (0%) | 12mo | $110,000 | $82 | 85 |
| 620 112th St SE #189 | 0.00mi | 2/2.0 (-1) | 1,390 (+4%) | 8mo | $145,500 | $105 | 82 |
| 11622 Silver Lake Rd #58 | 0.28mi | 2/2.0 (-1) | 1,344 (+0%) | 4mo | $78,000 | $58 | 78 |
| 11622 Silver Lake Rd #30 | 0.28mi | 2/2.0 (-1) | 1,344 (+0%) | 7mo | $150,000 | $112 | 76 |
| 11622 Silver Lake Rd #70 | 0.28mi | 3/2.0 | 1,188 (-11%) | 9mo | $152,500 | $128 | 60 |
| 12030 Andrew Sater Rd | 0.43mi | 2/2.0 (-1) | 1,264 (-6%) | 6mo | $85,000 | $67 | 60 |
| 11500 Meridian Ave S #22 | 0.64mi | 3/2.0 | 1,290 (-4%) | 10mo | $199,000 | $154 | 56 |
| 11500 Meridian Ave S #91 | 0.64mi | 3/2.0 | 1,456 (+9%) | 2mo | $226,000 | $155 | 54 |
| 11622 Silver Lake Rd #90 | 0.28mi | 2/2.0 (-1) | 1,152 (-14%) | 10mo | $85,000 | $74 | 51 |
| 12030 2nd Dr SE | 0.54mi | 2/2.0 (-1) | 1,436 (+7%) | 10mo | $485,000 | $338 | 50 |
| 12219 Freeway Pl | 0.53mi | 2/2.0 (-1) | 1,452 (+8%) | 12mo | $525,000 | $362 | 46 |
Match score weights: distance 35% · size 25% · config 20% · recency 20%. Top-matched comps best support the ARV.
Projected returns pro-forma
-3.0% appreciation · 0.0% rent growth · sell at horizon
- IRR
- 34.3%
- Equity multiple
- 2.39×
- Total profit
- $48,685
- Equity at exit
- $18,638
- IRR
- 39.6%
- Equity multiple
- 4.21×
- Total profit
- $112,338
- Equity at exit
- $10,808
Cash invested: $35,000 (down + closing). Projections, not guarantees.
Landlord ↔ Tenant lean methodology
- Overall (STATE)
- 28 Tenant-Leaning
- State Washington
- 28 Tenant-Leaning · D+8
- County
- — inherits STATE
- City
- — inherits STATE
ZIP-level market 98208
- Rents YoY
- -3.2%
- Active inventory
- 277
- Price-to-rent
- 4.2×
Monthly cashflow live
- Estimated rent
- $2,485 high interval (Pro) →
- Mortgage (P&I)
- −$656
- Tax from tax record
- −$58 /mo · $698/yr
- Insurance
- −$52
- HOA
- −$0
- Vacancy / Maint / Mgmt
- −$522
- Net cashflow
- $1,197
Break-even live
Sensitivity live
| Price | -10% $1,268 | -5% $1,232 | +0% $1,197 | +5% $1,162 | +10% $1,126 |
|---|---|---|---|---|---|
| Rent | -10% $1,001 | -5% $1,099 | +0% $1,197 | +5% $1,295 | +10% $1,393 |
| Rate | -1.0pp $1,260 | -0.5pp $1,229 | base $1,197 | +0.5pp $1,165 | +1.0pp $1,132 |
UW: 25.0% down · 7.5% · 30yr · 1.5% tax · 5.0% vac · 8.0% maint · 8.0% mgmt
Financing live
Cash to close
- Down payment
- $31,250
- Closing costs
- $3,750
- Reserves months
- —
- Total cash needed
- —
Loan-product check · same deal, 3 products live
Conventional
25% down · 7.5% · 30yr
- Down + closing
- —
- Monthly P&I
- —
- Monthly cashflow
- —
- DSCR
- —
- Eligible?
- —
Personal DTI + credit; lowest rate.
DSCR
20% down · 8.5% · 30yr
- Down + closing
- —
- Monthly P&I
- —
- Monthly cashflow
- —
- DSCR
- —
- Eligible?
- —
No personal income docs; deal must DSCR.
Hard money
10% down · 12.0% · 12mo
- Down + closing
- —
- Monthly P&I
- —
- Monthly cashflow
- —
- DSCR
- —
- Eligible?
- —
Short-term bridge; refi at stabilization.
Rent comps 40 comps
| Address | Beds | Baths | Sqft | Rent | $/sqft | DOM | Units | Dist |
|---|---|---|---|---|---|---|---|---|
| 525 112th St SE Everett, WA | 1.0–2.0 | 1.0–2.0 | 1019 | $2,416 | $2.37 | 3d | 6 | 0.17mi |
| 11401 3rd Ave SE Everett, WA | 2.0 | 1.0–2.0 | 862 | $1,892 | $2.20 | 0d | 15 | 0.21mi |
| 515 112th St SE Everett, WA | 2.0–3.0 | 2.0–2.5 | 1050 | $2,345 | $2.23 | 0d | 2 | 0.24mi |
| 11026 Meridian Dr SE Everett, WA | 3.0 | 2.5 | 1700 | $3,000 | $1.76 | 45d | 1 | 0.53mi |
| 4 112th St SW Unit A Everett, WA | 3.0 | 2.5 | 1661 | $3,300 | $1.99 | 45d | 1 | 0.56mi |
| 11005 16th Ave SE Everett, WA | 1.0–2.0 | 1.0–2.0 | 841 | $2,031 | $2.41 | 0d | 5 | 0.58mi |
| 133 124th St SE Everett, WA | 1.0–2.0 | 1.0–2.0 | 820 | $2,055 | $2.50 | 3d | 9 | 0.69mi |
| 10509 14th Dr SE Everett, WA | 3.0 | 2.5 | 1506 | $2,700 | $1.79 | 0d | 1 | 0.69mi |
| 1304 Bruskrud Rd Everett, WA | 2.0 | 1.5–2.0 | 900 | $2,000 | $2.22 | 0d | 5 | 0.71mi |
| 1701 121st St SE Everett, WA | 1.0–3.0 | 1.0–2.0 | 867 | $2,900 | $3.34 | 3d | 12 | 0.78mi |
| 1726 121st St SE Unit A Everett, WA | 4.0 | 2.5 | 1495 | $2,550 | $1.71 | 6d | 1 | 0.84mi |
| 10101 7th Ave SE Everett, WA | 1.0–3.0 | 1.0–2.0 | 1073 | $2,805 | $2.61 | 0d | 15 | 0.84mi |
| 305 127th St SE Unit A Everett, WA | 2.0 | 2.5 | 1456 | $2,649 | $1.82 | 45d | 1 | 0.86mi |
| 120 SE Everett Mall Way Everett, WA | 1.0–2.0 | 1.0–2.0 | 813 | $2,134 | $2.62 | 0d | 43 | 0.87mi |
| 2020 Lake Heights Dr Everett, WA | 1.0–3.0 | 1.0–2.0 | 918 | $2,424 | $2.64 | 0d | 14 | 0.88mi |
| 128 127th St SE Everett, WA | 3.0 | 1.0–2.0 | 884 | $3,296 | $3.73 | 0d | 11 | 0.88mi |
| 11225 19th Ave SE Everett, WA | 1.0–3.0 | 1.0–2.0 | 925 | $2,609 | $2.82 | 0d | 10 | 0.90mi |
| 222 124th St SW Unit A2 Everett, WA | 3.0 | 2.5 | 1560 | $2,975 | $1.91 | 6d | 1 | 0.97mi |
| 12115 19th Ave SE Everett, WA | 1.0–3.0 | 1.0–2.0 | 884 | $2,460 | $2.78 | 0d | 12 | 0.97mi |
| 11311 19th Ave SE Everett, WA | 1.0–3.0 | 1.0–2.0 | 932 | $2,623 | $2.81 | 0d | 14 | 1.00mi |
| 923 112th St SW Everett, WA | 1.0–3.0 | 1.0–2.0 | 858 | $2,305 | $2.69 | 3d | 24 | 1.11mi |
| 11207 9th Pl W Everett, WA | 2.0 | 1.0 | 995 | $1,899 | $1.91 | 21d | 7 | 1.14mi |
| 12600 4th Ave W Everett, WA | 2.0 | 2.5 | 1336 | $2,295 | $1.72 | 18d | 1 | 1.16mi |
| 9925 4th Ave W Apt 6 Everett, WA | 2.0 | 2.0 | 1000 | $1,445 | $1.45 | 3d | 1 | 1.16mi |
| 13117 3rd Ave SE Unit J1 Everett, WA | 3.0 | 3.0 | 1659 | $3,249 | $1.96 | 45d | 1 | 1.16mi |
| 13401 Dumas Rd Mill Creek, WA | 1.0–2.0 | 1.0–2.0 | 893 | $2,277 | $2.55 | 0d | 6 | 1.16mi |
| 9618 19th Ave SE Unit C Everett, WA | 3.0 | 3.0 | 1637 | $3,200 | $1.95 | 11d | 1 | 1.20mi |
| 12510 23rd Dr SE Everett, WA | 4.0 | 2.5 | 1757 | $2,995 | $1.70 | 25d | 1 | 1.21mi |
| 2601 106th Pl SE Everett, WA | 3.0 | 2.0 | 1221 | $3,245 | $2.66 | 13d | 1 | 1.22mi |
| 222 W Marilyn Ave Everett, WA | 3.0 | 1.0 | 1000 | $2,400 | $2.40 | 18d | 1 | 1.25mi |
| 1108 Center Rd Everett, WA | 2.0 | 2.0 | 1200 | $2,150 | $1.79 | 16d | 1 | 1.27mi |
| 820 124th St SW Apt D Everett, WA | 2.0 | 1.5 | 960 | $1,595 | $1.66 | 6d | 1 | 1.28mi |
| 13510 N Creek Dr Mill Creek, WA | 1.0–4.0 | 1.0–2.0 | 1020 | $2,024 | $1.98 | 4d | 1 | 1.29mi |
| 11812 E Gibson Rd Everett, WA | 2.0 | 2.0 | 956 | $1,814 | $1.90 | 0d | 6 | 1.29mi |
| 11719 12th Ave W Everett, WA | 3.0 | 2.5 | 1533 | $2,800 | $1.83 | 45d | 1 | 1.32mi |
| 11727 12th Ave W #77 Everett, WA | 3.0 | 2.5 | 1533 | $3,100 | $2.02 | 23d | 1 | 1.33mi |
| 10111 9th Ave W Everett, WA | 1.0–2.0 | 1.0–2.5 | 1098 | $2,550 | $2.32 | 6d | 4 | 1.33mi |
| 12522 8th Ave W Everett, WA | 1.0–3.0 | 1.0–2.0 | 1005 | $2,496 | $2.48 | 0d | 9 | 1.35mi |
| 233 Dorn Ave Unit 1 Everett, WA | 2.0 | 1.0 | 944 | $1,950 | $2.07 | 12d | 1 | 1.40mi |
| 12121 Admiralty Way Everett, WA | 1.0–3.0 | 1.0–2.0 | 1116 | $2,855 | $2.56 | 0d | 15 | 1.40mi |
Listing history 12 events
-
2026-06-02status $125,000 Pending 53 DOM
-
2026-06-01days on market $125,000 Active 53 DOM
-
2026-05-31days on market $125,000 Active 52 DOM
-
2026-04-09$125,000 Active
-
2018-07-13soldstatus $125,000 Sold
-
2018-06-19status Pending
-
2018-06-11status Pending Inspection
-
2018-05-30$125,000 Active
-
2006-07-31soldstatus $42,000
-
2006-06-15$44,990
-
2002-11-23soldstatus $42,000
-
2002-09-10$42,990
ⓘ Source: listings_history table (triggers on properties + properties_extension) + one-shot
backfill from property_details.listing_events for pre-trigger history.
Tax reassessment forecast WA · Resets to sale price
- Current annual tax
- $698 · $58/mo
- Projected year-2 tax
- $1,225 · $102/mo
- Expected delta
- +$527/yr (+$44/mo · 75.4%)
ⓘ Screening estimate from a state-policy table — verify with the county assessor before closing.
Nearby sold comps map
Loading sold comps map…
Walkable amenities ~0.75 mi
Loading nearby amenities…
Taxation est. · year 1
- Rental income
- $29,816
- − Mortgage interest
- −$7,002
- − Property taxes
- −$698
- − Insurance
- −$625
- − Repairs & maintenance
- −$2,385
- − Management
- −$2,385
- − Depreciation
- −$3,636
- Taxable income
- $13,084
- Est. tax owed @ 24.0%
- −$3,140
- After-tax cash flow
- $11,225/yr
For passive investors: Depreciation is non-cash, so a rental often shows a tax loss while cash-flowing — sheltering income. Rental losses are passive: they offset passive income freely, and up to $25,000/yr can offset ordinary (W-2) income if you actively participate and your MAGI is under $100k (phasing out to $0 by $150k); unused losses carry forward. On sale, claimed depreciation is recaptured at up to 25%, and gains may owe capital-gains tax (a 1031 exchange can defer both). Figures are a year-1 estimate at your 24.0% rate — not tax advice; consult a CPA.
Schools (NCES district)
- District
- Everett School District
- NCES district ID
- 5302670
- Math proficiency
- 60% ▲ 1.00%
- Reading proficiency
- 72% ▲ 1.00%
- Median HH income
- $66,815
- Composite
- 59.0/100
- National rank
- #1964
- State rank
- #26 of 291 in WA
Livability — Everett
- Score
- 73/100
- State rank
- #199
- US rank
- #5489
Category grades
Schools grade is shown separately in the Schools card above.
Census & demographics
- Census place
- Everett, WA
- County
- Snohomish County · 786,756 people
- City population
- 173,457
- Metro
- Seattle-Tacoma-Bellevue, WA
- Population (ZIP)
- 60,915
- Household income
- $103,705
- Rent vs Own
- Severe rent burden
- 1617.0
Population outlook (Snohomish County) Hauer SSP2
- Today (2025)
- 899,800 people
- By 2030
- 960,975 · +6.8%
- By 2040
- 1,074,447 · +19.4%
- By 2050
- 1,171,954 · +30.2%
- By 2075
- 1,384,849 · +53.9%
- By 2100
- 1,497,296 · +66.4%
Race, ethnicity, and origin ACS 2023
- Neighborhood character
- Diverse neighborhood (Simpson 0.65)
- Race & ethnicity
- White 55% Asian 17% Hispanic / Latino 14% Two or more races 13% Black 5%
- Hispanic origin (detail)
- Mexican 10%
- Common ancestry
- Portuguese 5% Italian 3% Slovak 2%
- Foreign-born
- 27% · Canada, Vietnam, South Korea
- Languages at home
- 66% English-only · Spanish 9% Vietnamese 4% Other Asian/Pacific 4%
Political lean MEDSL · Snohomish
- 2024 margin
- D (+19.0) · D 57.8% · R 38.9% · Other 3.3%
- 2008→2024 swing
- +0.1pp no change · 2008: 18.9pp · 2024: 19.0pp
- All cycles
- 2024: D+19.0 2020: D+20.6 2016: D+16.6 2012: D+16.2 2008: D+18.9
Not yet ingested
- Civics
- —
Market trends
- HPI YoY
- ▼ -884.74%
- Current HPI
- 337.856
- Rent YoY
- ▼ -3.16%
- Metro
- Seattle-Tacoma-Bellevue, WA
- State GDP YoY
- ▲ 4.65%
- F500 in state
- 22
Industry mix (Fortune 500 HQ in WA)
| Industry | F500 HQs | Revenue |
|---|---|---|
| Retail | 2 | $269B |
|
||
| Technology / Retail | 1 | $638B |
|
||
| Technology | 1 | $245B |
|
||
| Telecommunications | 1 | $38B |
|
||
| Food / Beverage | 1 | $36B |
|
||
| Automotive / Trucks | 1 | $34B |
|
||
Price history
+190.8% since first listed9 events — show timeline
- 2026-04-09 Listed $125,000 NWMLS as Distributed by MLS Grid
- 2018-07-13 Sold (MLS) $125,000 NWMLS as Distributed by MLS Grid
- 2018-06-19 Pending — NWMLS as Distributed by MLS Grid
- 2018-06-11 Pending — NWMLS as Distributed by MLS Grid
- 2018-05-30 Listed $125,000 NWMLS as Distributed by MLS Grid
- 2006-07-31 Sold (MLS) $42,000 NWMLS as Distributed by MLS Grid
- 2006-06-15 Listed $44,990 NWMLS as Distributed by MLS Grid
- 2002-11-23 Sold (MLS) $42,000 NWMLS as Distributed by MLS Grid
- 2002-09-10 Listed $42,990 NWMLS as Distributed by MLS Grid
Property tax history
+3.4%/yrLatest (2026): $698 · -17.6% YoY. Source: county tax records.
Cash-flow waterfall
monthlySold comps — $/sqft
last 12 mo · ≤1 miLoading sold comps…