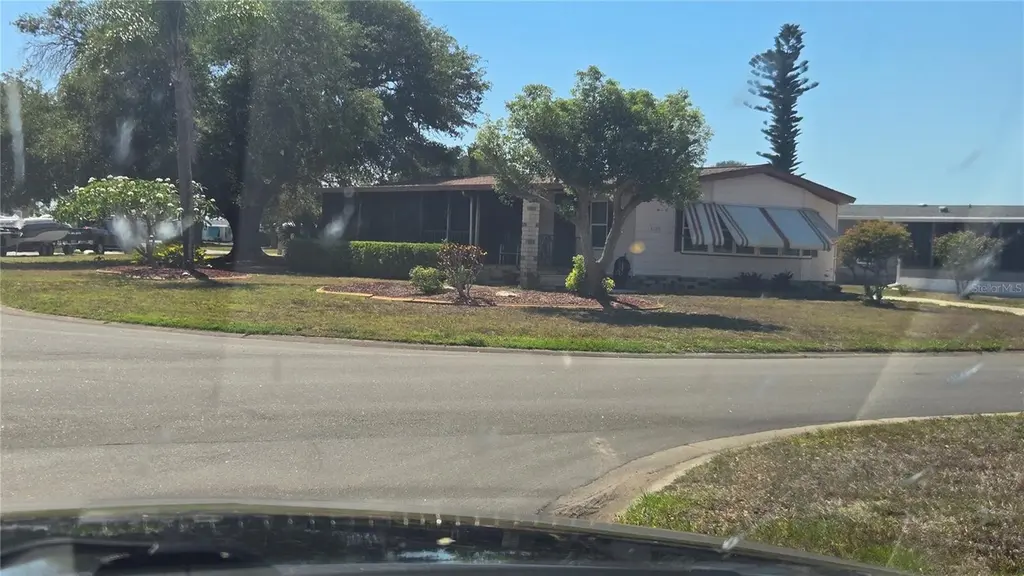
6199 Oriole Blvd · Englewood, FL
Flood risk 6/10 · Moderate
- FEMA flood zone
- X (shaded)
- Chance of flooding over 30 yrs
- 0.7%
- Est. flood insurance / yr
- $507 – $1,088
Fire risk 3/10 · Minor
- Est. fire insurance / yr
- $947 – $1,759
Heat risk 10/10 · Severe
- Hot days now (above 107°F)
- 7 days/yr
- Hot days in 30 yrs
- 30 days/yr
Wind risk 10/10 · Severe
- Chance of severe wind over 30 yrs
- 99.0%
Air-quality risk 2/10 · Minimal
- Unhealthy air days now
- 1 days/yr
- Unhealthy air days in 30 yrs
- 1 days/yr
Risk factors via First Street. Map © Google.
Why this score? — see what drove the B+ grade
The composite is a weighted blend of 9 inputs, each scored 0–100. Each bar is that input's sub-score; the figure is the points it added to the 100-point composite (weight × sub-score).
- Cash flow +30.0/30.0
- ARV discount +15.0/15.0
- DSCR +10.0/10.0
- 1% rule +9.3/10.0
- Schools +4.6/10.0
- Livability +3.7/5.0
- Rent growth +2.5/5.0
- Condition / age +2.5/5.0
- Appreciation +0.0/10.0
$144,900
🖨 Deal sheet 📄 Offer letter ✓ Due diligence
Listing remarks
This is in one of Englewoods premier subdivisions with a life style for comfort and relaxation. This two bedroom two bath home is large enough for entertaining and guests. The Edgewater Club which is only $315. annually has many many social events through the year. You will also be able to swim in a heated Pool (cooled in the summer), play Pickle Ball, Horse Shoes, Tennis and much more. You will be located close to shopping, restaurants, golf courses, fishing, boating, hospitals and best of all the Beaches on Manasota Key on the Gulf of America. Don't miss out! See you soon.
Key facts
- Tennis
- Close to restaurants
- Pickle ball
Tags
Property features AI
Finance
- Other: Turnkey furnished; Public-record living area approximately 1,534 square feet
- Financial info: Lease restrictions apply
- HOA & community: Has HOA with annual fee of $50 (approximately $4.17/month); Association approval required; Association amenities include pool, tennis courts, pickleball courts and shuffleboard; Clubhouse, street lights, deed restrictions, association recreation owned; Senior community; Pets allowed: cats and dogs
Exterior
- Parking: Off-street parking
- Utilities: Public sewer; Water connected; Electricity connected; Cable available; Phone available
- Home design: Manufactured double-wide home; Attached property; One story; Home faces south
- Construction: Vinyl siding; Shingle roof; Crawlspace foundation; Built as completed (manufactured)
- Exterior features: Covered screened porch; Side porch; Awnings; Exterior lighting; Rain gutters; Storage shed; Mature landscaping with oak trees; Corner, landscaped and oversized paved lot; Near golf course
Interior
- Kitchen: Dishwasher; Microwave; Range; Refrigerator
- Bedrooms: 2 bedrooms
- Flooring: Laminate
- Bathrooms: 2 full bathrooms
- Heating & cooling: Electric heating; Central air conditioning
- Interior features: Ceiling fans; Thermostat; Walk-in closets; Window treatments; Blinds; Exhaust fan
- Laundry & utility: Washer hookup; Dryer hookup (electric); Laundry located inside
Neighborhood map
What this means for you Summary
Snapshot
- This is a 2-bed/2.0-bath manufactured listed at $145k.
Deal economics
- At list price, monthly cash flow is $700 ($8k/yr) — positive.
- The deal already cash-flows at list — no discount required.
- Meets the 1% rule at list price ($2k rent vs $145k).
- Recommended offer: $143k (1.5% below list) — sets the bar for market timing.
- Cap rate 12.1% vs local median 3.8% in Englewood — top-decile yield for the area; either an underpriced asset or a hidden risk that comps aren't pricing in. Stress-test before assuming the spread holds.
Location & tenants
- Location reads 73/100 on livability (#321 in FL) — a middle-class / working-renter tenant base. Strengths: housing A+, cost of living A, health & safety A; Watch: employment C-, amenities F, commute F.
- Charlotte (suburban): math 54% / reading 54% proficiency, ranked #22 of 73 in FL (top 30%) — acceptable for families but not a draw, mixed tenant base, ~2y average lease.
- Zoned schools: Myakka River Elementary School (math 65% / reading 60%, grade B, #601 of 2,144 statewide, top 28%, 608 students, 51% FRL); Lemon Bay High School (math 50% / reading 56%, grade C-, #148 of 667 statewide, top 23%, 1,360 students, 28% FRL).
- Market conditions: Rents soft (-0.1%/yr); 734 active listings in the ZIP; 15 comparable units currently listed for rent nearby; rentals at typical pace (median 21d on market — plan ~3-4 weeks tenant-placement turnaround); 4,585 units permitted in Charlotte County in 2024 (703 in 5+ unit buildings).
- This rent runs 43% of the median local income ($57k/yr) — at the standard rent-burdened threshold; future hikes will face affordability resistance.
Forward outlook
- Local home prices are declining (-3.0%/yr); year-one equity from $1k of loan paydown is wiped out by about $4k of value loss. Plan a longer hold.
- Charlotte County population projected at +24% by 2050 — long-run rental-demand tailwind backs the buy-and-hold thesis.
- At projected returns (-3.0% appreciation + 0.0% rent growth), your $41k cash investment doubles in ~8 years — after that, you're playing with house money.
Negotiation context
- It's been on market 29 days — a 2% lower offer ($143k) is reasonable based on typical stale-listing flexibility.
- Current owner paid $84k; list at $145k implies a 72% gain — meaningful room to come down on a strong offer.
Risks & watch-outs
- Climate carrying-cost: major flood risk; severe wind risk, 99% chance of damaging wind over 30y; extreme-heat days projected 7→30/yr by 2055 (HVAC capex compounding) — expect insurance premiums to compound above CPI over the hold.
Questions for the listing agent
- What does the HOA fee cover, when was the last increase, and are there any pending special assessments or reserve-fund shortfalls?
- Is there a deadline driving the sale (1031 exchange, divorce, estate, relocation)? That informs how much negotiation room exists.
- Schools are A-rated — typically a magnet for longer-tenancy family renters. What's the average tenant stay here, and is there a school-zone premium baked into asking?
- What's the average days-on-market for RENTAL listings here right now (not sales)? A rising rental-DOM trend means longer vacancies and softer asking-rent achievability than the comps imply.
- What's the recent tenant-quality profile in this submarket — average credit score on applications, eviction rate, late-payment / NSF rate, and stable-employment percentage? A property-management company in the area should have these aggregated.
- How much new for-sale + rental construction is in the pipeline within 1–3 miles? Heavy new supply typically softens prices + rents 12–24 months out; constrained supply supports both.
Investment metrics
- 1% rule
- 1.43% ✓
- Cap rate
- 12.09%
- Cash-on-cash
- 20.71%
- DSCR
- 1.92
- GRM
- 5.8
CMA / ARV
- ARV (on-the-fly)
- $190,216
- Comps found
- 3
Show comp detail 3 sales within ~0.75 mi
| Address | Dist | Beds/Ba | Sqft | Sold | Price | $/sf | Match |
|---|---|---|---|---|---|---|---|
| 6089 Toucan Dr | 0.19mi | 3/2.0 (+1) | 1,608 (+5%) | 10mo | $199,900 | $124 | 70 |
| 6287 Oriole Blvd | 0.21mi | 2/2.0 | 1,344 (-12%) | 11mo | $130,000 | $97 | 60 |
| 2727 Tanager Ln | 0.49mi | 3/2.0 (+1) | 1,728 (+13%) | 1mo | $225,000 | $130 | 50 |
Match score weights: distance 35% · size 25% · config 20% · recency 20%. Top-matched comps best support the ARV.
Projected returns pro-forma
-3.0% appreciation · 0.0% rent growth · sell at horizon
- IRR
- 9.7%
- Equity multiple
- 1.37×
- Total profit
- $15,048
- Equity at exit
- $21,605
- IRR
- 16.3%
- Equity multiple
- 2.16×
- Total profit
- $47,076
- Equity at exit
- $12,528
Cash invested: $40,572 (down + closing). Projections, not guarantees.
Landlord ↔ Tenant lean methodology
- Overall (STATE)
- 87 Strongly Landlord-Friendly
- State Florida
- 87 Strongly Landlord-Friendly · R+3
- County
- — inherits STATE
- City
- — inherits STATE
ZIP-level market 34224
- Home prices YoY
- -18.9%
- Rents YoY
- -0.1%
- Active inventory
- 734
- Price-to-rent
- 5.8×
Monthly cashflow live
- Estimated rent
- $2,067 high interval (Pro) →
- Mortgage (P&I)
- −$760
- Tax from tax record
- −$108 /mo · $1,299/yr
- Insurance
- −$60
- HOA
- −$4
- Vacancy / Maint / Mgmt
- −$434
- Net cashflow
- $700
Break-even live
UW: 25.0% down · 7.5% · 30yr · 1.5% tax · 5.0% vac · 8.0% maint · 8.0% mgmt
Financing live
Cash to close
- Down payment
- $36,225
- Closing costs
- $4,347
- Reserves months
- —
- Total cash needed
- —
Loan-product check · same deal, 3 products live
Conventional
25% down · 7.5% · 30yr
- Down + closing
- —
- Monthly P&I
- —
- Monthly cashflow
- —
- DSCR
- —
- Eligible?
- —
Personal DTI + credit; lowest rate.
DSCR
20% down · 8.5% · 30yr
- Down + closing
- —
- Monthly P&I
- —
- Monthly cashflow
- —
- DSCR
- —
- Eligible?
- —
No personal income docs; deal must DSCR.
Hard money
10% down · 12.0% · 12mo
- Down + closing
- —
- Monthly P&I
- —
- Monthly cashflow
- —
- DSCR
- —
- Eligible?
- —
Short-term bridge; refi at stabilization.
Rent comps 15 comps
| Address | Beds | Baths | Sqft | Rent | $/sqft | DOM | Units | Dist |
|---|---|---|---|---|---|---|---|---|
| 2643 Lear Rd Englewood, FL | 2.0 | 2.0 | 1206 | $5,800 | $4.81 | 21d | 1 | 0.82mi |
| 9271 Tacoma Ave Unit B Englewood, FL | 2.0 | 2.0 | 1206 | $1,650 | $1.37 | 21d | 1 | 0.86mi |
| 9322 Anita Ave Englewood, FL | 2.0 | 2.0 | 1133 | $1,495 | $1.32 | 21d | 1 | 0.87mi |
| 2275 S McCall Rd #201 Englewood, FL | 2.0 | 2.0 | 1050 | $2,000 | $1.90 | 13d | 1 | 0.92mi |
| 9416 Anita Ave Englewood, FL | 3.0 | 2.0 | 1162 | $1,750 | $1.51 | 13d | 1 | 1.02mi |
| 6688 San Casa Dr Englewood, FL | 2.0 | 2.0 | 1143 | $1,600 | $1.40 | 21d | 1 | 1.04mi |
| 9410 Tacoma Ave Unit A Englewood, FL | 3.0 | 2.0 | 1062 | $1,600 | $1.51 | 13d | 1 | 1.10mi |
| 7160 Carlsbad Ter Englewood, FL | 3.0 | 2.0 | 2061 | $4,500 | $2.18 | 21d | 1 | 1.24mi |
| 1120 Lampp Dr Englewood, FL | 3.0 | 2.0 | 1212 | $4,000 | $3.30 | 21d | 1 | 1.28mi |
| 8363 Sago Ct Englewood, FL | 2.0 | 2.0 | 1360 | $1,950 | $1.43 | 21d | 1 | 1.32mi |
| 1081 Humboldt St Englewood, FL | 3.0 | 2.0 | 1838 | $2,400 | $1.31 | 21d | 1 | 1.34mi |
| 9400 New Martinsville Ave Englewood, FL | 3.0 | 2.0 | 1879 | $3,300 | $1.76 | 21d | 1 | 1.37mi |
| 6320 Brookridge St Englewood, FL | 3.0 | 2.0 | 1445 | $5,550 | $3.84 | 21d | 1 | 1.39mi |
| 7344 Brookhaven Ter Englewood, FL | 3.0 | 2.0 | 1594 | $2,095 | $1.31 | 21d | 1 | 1.39mi |
| 858 E 7th St Englewood, FL | 3.0 | 2.0 | 1244 | $1,995 | $1.60 | 21d | 1 | 1.49mi |
HOA detail
- Monthly dues
- $4 · $48/yr
- Likely covers
- waterpool
Listing history 20 events
-
2026-06-18days on market $144,900 Active 29 DOM
-
2026-06-17days on market $144,900 Active 28 DOM
-
2026-06-16days on market $144,900 Active 27 DOM
-
2026-06-15days on market $144,900 Active 26 DOM
-
2026-06-14days on market $144,900 Active 24 DOM
-
2026-06-13days on market $144,900 Active 23 DOM
-
2026-06-10days on market $144,900 Active 21 DOM
-
2026-06-09days on market $144,900 Active 20 DOM
-
2026-06-08days on market $144,900 Active 19 DOM
-
2026-06-07days on market $144,900 Active 18 DOM
-
2026-06-05days on market $144,900 Active 15 DOM
-
2026-06-03days on market $144,900 Active 14 DOM
-
2026-06-02days on market $144,900 Active 13 DOM
-
2026-06-01days on market $144,900 Active 12 DOM
-
2026-05-31days on market $144,900 Active 11 DOM
-
2026-05-30days on market $144,900 Active 10 DOM
-
2026-05-20$144,900 Active
-
2002-12-10soldstatus $84,000
-
2001-02-14soldstatus $72,000
-
1983-07-01soldstatus $17,500
ⓘ Source: listings_history table (triggers on properties + properties_extension) + one-shot
backfill from property_details.listing_events for pre-trigger history.
Tax reassessment forecast FL · Resets to sale price
- Current annual tax
- $1,299 · $108/mo
- Projected year-2 tax
- $1,299 · $108/mo
- Expected delta
- $0/yr ($0/mo · 0.0%)
ⓘ Screening estimate from a state-policy table — verify with the county assessor before closing.
Climate risk First Street
- Flood 6/10 Major FEMA zone X (shaded) · 70% chance over 30 yrs
- Wildfire 3/10 Moderate
- Heat 10/10 Extreme 7 d/yr ≥107°F today · 30 d/yr by 30 yrs out
- Wind 10/10 Extreme 99% chance of damaging wind over 30 yrs
- Air quality 2/10 Low 1 unhealthy d/yr today · 1 by 30 yrs out
Nearby sold comps map
Loading sold comps map…
Walkable amenities ~0.75 mi
Loading nearby amenities…
Taxation est. · year 1
- Rental income
- $24,801
- − Mortgage interest
- −$8,117
- − Property taxes
- −$1,299
- − Insurance
- −$724
- − Repairs & maintenance
- −$1,984
- − Management
- −$1,984
- − HOA
- −$48
- − Depreciation
- −$4,215
- Taxable income
- $6,429
- Est. tax owed @ 24.0%
- −$1,543
- After-tax cash flow
- $6,859/yr
For passive investors: Depreciation is non-cash, so a rental often shows a tax loss while cash-flowing — sheltering income. Rental losses are passive: they offset passive income freely, and up to $25,000/yr can offset ordinary (W-2) income if you actively participate and your MAGI is under $100k (phasing out to $0 by $150k); unused losses carry forward. On sale, claimed depreciation is recaptured at up to 25%, and gains may owe capital-gains tax (a 1031 exchange can defer both). Figures are a year-1 estimate at your 24.0% rate — not tax advice; consult a CPA.
Schools (NCES district)
- District
- Charlotte
- NCES district ID
- 1200240
- Math proficiency
- 54% ▼ -6.00%
- Reading proficiency
- 54% ▼ -1.00%
- Median HH income
- $44,864
- Composite
- 45.62/100
- National rank
- #2586
- State rank
- #22 of 73 in FL
Livability — Englewood
- Score
- 73/100
- State rank
- #321
- US rank
- #5655
Category grades
Schools grade is shown separately in the Schools card above.
Census & demographics
- Census place
- Englewood, FL
- County
- Charlotte County · 196,994 people
- City population
- 35,420
- Metro
- Punta Gorda, FL
- Population (ZIP)
- 15,536
- Household income
- $57,281
- Rent vs Own
- Severe rent burden
- 329.0
Population outlook (Charlotte County) Hauer SSP2
- Today (2025)
- 198,646 people
- By 2030
- 210,507 · +6.0%
- By 2040
- 230,857 · +16.2%
- By 2050
- 247,148 · +24.4%
- By 2075
- 281,777 · +41.8%
- By 2100
- 293,609 · +47.8%
Race, ethnicity, and origin ACS 2023
- Neighborhood character
- Predominantly White (92%)
- Race & ethnicity
- White 92% Two or more races 5% Hispanic / Latino 3% Asian 1%
- Common ancestry
- Romanian 4% Slovak 4% Lithuanian 4%
- Foreign-born
- 9% · Canada
- Languages at home
- 92% English-only · Other Indo-European 2% Spanish 2% German/W. Germanic 1%
Political lean MEDSL · Charlotte
- 2024 margin
- Solid R (+34.0) · D 32.7% · R 66.7%
- 2008→2024 swing
- -26.7pp toward R · 2008: -7.2pp · 2024: -34.0pp
- All cycles
- 2024: R+34.0 2020: R+26.6 2016: R+27.8 2012: R+14.3 2008: R+7.2
Not yet ingested
- Civics
- —
Market trends
- HPI YoY
- ▼ -75.76%
- Current HPI
- 325.0345
- Rent YoY
- ▼ -0.11%
- Metro
- Punta Gorda, FL
- State GDP YoY
- ▲ 3.28%
- F500 in state
- 36
Industry mix (Fortune 500 HQ in FL)
| Industry | F500 HQs | Revenue |
|---|---|---|
| Industrial Technology | 2 | $29B |
|
||
| Insurance | 2 | $17B |
|
||
| Retail | 1 | $60B |
|
||
| Technology Distribution | 1 | $58B |
|
||
| Homebuilding | 1 | $35B |
|
||
| Technology Manufacturing | 1 | $35B |
|
||
Price history
+728.0% since first listed4 events — show timeline
- 2026-05-20 Listed $144,900 Stellar MLS as Distributed by MLS Grid
- 2002-12-10 Sold (Public Records) $84,000 Public Records
- 2001-02-14 Sold (Public Records) $72,000 Public Records
- 1983-07-01 Sold (Public Records) $17,500 Public Records
Property tax history
+4.5%/yrLatest (2025): $1,299 · +3.1% YoY. Source: county tax records.
Cash-flow waterfall
monthlySold comps — $/sqft
last 12 mo · ≤1 miLoading sold comps…