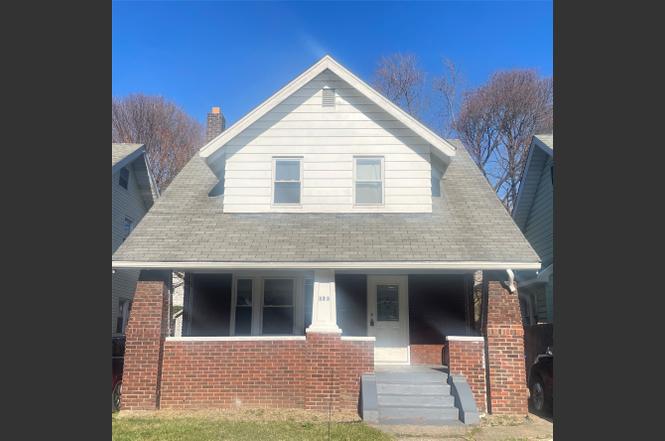
323 Lighthouse St · Erie, PA
Flood risk 4/10 · Minor
- FEMA flood zone
- X (unshaded)
- Chance of flooding over 30 yrs
- 0.24%
- Est. flood insurance / yr
- $473 – $860
Fire risk 1/10 · Minimal
- Est. fire insurance / yr
- $511 – $949
Heat risk 3/10 · Minor
- Hot days now (above 90°F)
- 7 days/yr
- Hot days in 30 yrs
- 18 days/yr
Wind risk 1/10 · Minimal
- Chance of severe wind over 30 yrs
- —
Air-quality risk 2/10 · Minimal
- Unhealthy air days now
- 1 days/yr
- Unhealthy air days in 30 yrs
- 3 days/yr
Risk factors via First Street. Map © Google.
Why this score? — see what drove the C+ grade
The composite is a weighted blend of 9 inputs, each scored 0–100. Each bar is that input's sub-score; the figure is the points it added to the 100-point composite (weight × sub-score).
- Cash flow +26.2/30.0
- DSCR +8.8/10.0
- Appreciation +7.1/10.0
- 1% rule +5.9/10.0
- ARV discount +5.8/15.0
- Livability +4.2/5.0
- Rent growth +2.5/5.0
- Condition / age +2.5/5.0
- Schools +1.3/10.0
$115,000
🖨 Deal sheet (PDF) 📄 Offer letter ✓ Due diligence
Listing remarks MLS
This freshly renovated move in ready home is a gem! With 3 bedrooms and 2 bathrooms, this home boasts new flooring, paint, kitchen, water heater, a newer furnace, newer windows. Not stopping there, it also features a new water main and Gas line all the way to the curb, ensuring peace of mind. Enjoy the cozy front porch, perfect for relaxation and welcoming guests. This home is ready for you to move in and make it your own!
Key facts
- Premium flooring
- Modern paint palette
- Curated curb appeal
Tags
Neighborhood map
What this means for you Summary
Snapshot
- This is a 3-bed/1.0-bath single-family listed at $115k.
Deal economics
- At list price, monthly cash flow is $292 ($4k/yr) — positive.
- The deal already cash-flows at list — no discount required.
- Meets the 1% rule at list price ($1k rent vs $115k).
- Recommended offer: $112k (3.0% below list) — sets the bar for market timing.
- Cap rate 9.3% vs local median 5.3% in Erie — top-decile yield for the area; either an underpriced asset or a hidden risk that comps aren't pricing in. Stress-test before assuming the spread holds.
Location & tenants
- Location reads 83/100 on livability (#109 in PA, #840 nationally) — a professional / high-income tenant draw. Strengths: amenities A+, commute A+, cost of living A+; Watch: crime D+, employment F.
- Erie City SD (urban): math 12% / reading 19% proficiency, ranked #510 of 539 in PA (top 95%) — low school quality limits family demand, transient renter base, plan for 1-2y turnover; 81% free/reduced lunch — lower-income household profile, screen leases tightly.
- Market conditions: Rents flat; 39 active listings in the ZIP; 5 comparable units currently listed for rent nearby; rentals lingering (median 45d on market — plan ~5-8 weeks vacancy on turnover, expect pricing pressure); 100% of comp listings sitting > 30 days — soft ceiling on asking rent; lower-income renter base — watch delinquency; 364 units permitted in Erie County in 2024 (188 in 5+ unit buildings).
- This rent runs 45% of the median local income ($33k/yr) — at the standard rent-burdened threshold; future hikes will face affordability resistance.
Forward outlook
- In year one you build about $6k of equity ($795 loan paydown + $5k appreciation (4.2% local appreciation)).
- Erie County population projected at -14% by 2050 — secular population decline; favor cash flow + early exit over multi-decade hold.
- At projected returns (4.2% appreciation + 0.1% rent growth), your $32k cash investment doubles in ~4 years — after that, you're playing with house money.
- By year 7, paydown + projected appreciation supports a ~$36k cash-out refi (75% LTV) — recoverable capital for the next deal without selling this one.
Negotiation context
- It's been on market 58 days — a 3% lower offer ($112k) is reasonable based on typical stale-listing flexibility.
- 4 sale attempts since 10y ago with the ask held roughly flat each time — persistent listings suggest the price (not the market) is what's stuck; bring a comps-based counter.
- Current owner paid $93k; 24% above their basis — modest negotiation headroom, anchor on the comps not their cost.
Risks & watch-outs
- Watch-outs: built in 1917 — expect roof / HVAC / electrical / plumbing capex.
Questions for the listing agent
- It's been on market 58 days. Have you received any prior offers? Is the seller open to a 3% concession, seller financing, or rate buy-down credit?
- Built in 1917 — when were the roof, HVAC, electrical panel, plumbing, and water heater last replaced?
- Is there a deadline driving the sale (1031 exchange, divorce, estate, relocation)? That informs how much negotiation room exists.
- Crime grade is D in this area — have there been break-ins, vandalism, or insurance claims at this property in the last 3 years? What carrier currently insures it and at what premium?
- What's the average days-on-market for RENTAL listings here right now (not sales)? A rising rental-DOM trend means longer vacancies and softer asking-rent achievability than the comps imply.
- What's the recent tenant-quality profile in this submarket — average credit score on applications, eviction rate, late-payment / NSF rate, and stable-employment percentage? A property-management company in the area should have these aggregated.
- How much new for-sale + rental construction is in the pipeline within 1–3 miles? Heavy new supply typically softens prices + rents 12–24 months out; constrained supply supports both.
Investment metrics
- 1% rule
- 1.09% ✓
- Cap rate
- 9.34%
- Cash-on-cash
- 10.88%
- DSCR
- 1.48
- GRM
- 7.7
CMA / ARV
- ARV (on-the-fly)
- $110,850
- Comps found
- 12
Show comp detail 12 sales within ~0.75 mi
| Address | Dist | Beds/Ba | Sqft | Sold | Price | $/sf | Match |
|---|---|---|---|---|---|---|---|
| 323 Lighthouse St | 0.00mi | 3/1.5 | 1,478 (0%) | 1mo | $115,000 | $78 | 97 |
| 424 Hess Ave | 0.07mi | 3/1.0 | 1,488 (+1%) | 10mo | $108,000 | $73 | 88 |
| 1129 E 4th St | 0.09mi | 3/1.0 | 1,540 (+4%) | 3mo | $115,000 | $75 | 86 |
| 424 Lighthouse St | 0.06mi | 3/1.5 | 1,385 (-6%) | 2mo | $105,000 | $76 | 83 |
| 1038 Queen St | 0.25mi | 3/1.0 | 1,364 (-8%) | 7mo | $130,000 | $95 | 69 |
| 944 E 10th St | 0.54mi | 3/2.0 | 1,544 (+4%) | 1mo | $45,000 | $29 | 63 |
| 1411 Lynn St | 0.31mi | 4/1.0 (+1) | 1,320 (-11%) | 3mo | $102,000 | $77 | 60 |
| 1325 Lynn St | 0.26mi | 4/1.0 (+1) | 1,320 (-11%) | 8mo | $102,500 | $78 | 59 |
| 1018 Pennsylvania Ave | 0.53mi | 3/1.0 | 1,294 (-12%) | 10mo | $45,000 | $35 | 46 |
| 734 E 7th St | 0.63mi | 3/1.0 | 1,320 (-11%) | 8mo | $81,000 | $61 | 46 |
| 762 E 7th St | 0.59mi | 3/1.0 | 1,320 (-11%) | 13mo | $30,000 | $23 | 44 |
| 715 E 7th St | 0.68mi | 3/1.0 | 1,320 (-11%) | 11mo | $58,500 | $44 | 42 |
Match score weights: distance 35% · size 25% · config 20% · recency 20%. Top-matched comps best support the ARV.
Projected returns pro-forma
4.17% appreciation · 0.1% rent growth · sell at horizon
- IRR
- 18.8%
- Equity multiple
- 2.12×
- Total profit
- $36,138
- Equity at exit
- $59,449
- IRR
- 18.0%
- Equity multiple
- 3.79×
- Total profit
- $89,814
- Equity at exit
- $98,157
Cash invested: $32,200 (down + closing). Projections, not guarantees.
Landlord ↔ Tenant lean methodology
- Overall (STATE)
- 62 Landlord-Friendly
- State Pennsylvania
- 62 Landlord-Friendly · EVEN
- County
- — inherits STATE
- City
- — inherits STATE
ZIP-level market 16507
- Home prices YoY
- 2.6%
- Rents YoY
- 0.1%
- Active inventory
- 39
- Price-to-rent
- 7.7×
Monthly cashflow live
- Estimated rent
- $1,249 high interval (Pro) →
- Mortgage (P&I)
- −$603
- Tax from tax record
- −$44 /mo · $528/yr
- Insurance
- −$48
- HOA
- −$0
- Vacancy / Maint / Mgmt
- −$262
- Net cashflow
- $292
Break-even live
Sensitivity live
| Price | -10% $357 | -5% $324 | +0% $292 | +5% $259 | +10% $227 |
|---|---|---|---|---|---|
| Rent | -10% $193 | -5% $243 | +0% $292 | +5% $341 | +10% $391 |
| Rate | -1.0pp $350 | -0.5pp $321 | base $292 | +0.5pp $262 | +1.0pp $232 |
UW: 25.0% down · 7.5% · 30yr · 1.5% tax · 5.0% vac · 8.0% maint · 8.0% mgmt
Financing live
Cash to close
- Down payment
- $28,750
- Closing costs
- $3,450
- Reserves months
- —
- Total cash needed
- —
Loan-product check · same deal, 3 products live
Conventional
25% down · 7.5% · 30yr
- Down + closing
- —
- Monthly P&I
- —
- Monthly cashflow
- —
- DSCR
- —
- Eligible?
- —
Personal DTI + credit; lowest rate.
DSCR
20% down · 8.5% · 30yr
- Down + closing
- —
- Monthly P&I
- —
- Monthly cashflow
- —
- DSCR
- —
- Eligible?
- —
No personal income docs; deal must DSCR.
Hard money
10% down · 12.0% · 12mo
- Down + closing
- —
- Monthly P&I
- —
- Monthly cashflow
- —
- DSCR
- —
- Eligible?
- —
Short-term bridge; refi at stabilization.
Rent comps 5 comps
| Address | Beds | Baths | Sqft | Rent | $/sqft | DOM | Units | Dist |
|---|---|---|---|---|---|---|---|---|
| 622 E 4th St Erie, PA | 3.0 | 1.0 | 1500 | $1,250 | $0.83 | 45d | 1 | 0.71mi |
| 519 E 6th St Unit 3 Erie, PA | 2.0 | 1.0 | 900 | $775 | $0.86 | 45d | 1 | 0.86mi |
| 223 E 9th St Erie, PA | 2.0 | 2.0 | 1564 | $1,300 | $0.83 | 45d | 1 | 1.31mi |
| 614 E 22nd St Unit 1 Erie, PA | 3.0 | 1.0 | 1300 | $1,000 | $0.77 | 45d | 1 | 1.42mi |
| 100 Erie Insurance Pl Erie, PA | 3.0 | 1.0 | 1120 | $1,425 | $1.27 | 45d | 1 | 1.42mi |
Listing history 15 events
-
2026-04-25status Pending
-
2026-02-26$115,000 Active
-
2024-07-11soldstatus $93,000
-
2024-07-10soldstatus $93,000 Closed 426-char remark
Show marketing remark (426 chars)
This freshly renovated move in ready home is a gem! With 3 bedrooms and 2 bathrooms, this home boasts new flooring, paint, kitchen, water heater, a newer furnace, newer windows. Not stopping there, it also features a new water main and Gas line all the way to the curb, ensuring peace of mind. Enjoy the cozy front porch, perfect for relaxation and welcoming guests. This home is ready for you to move in and make it your own!
-
2024-06-14status Pending 426-char remark
Show marketing remark (426 chars)
This freshly renovated move in ready home is a gem! With 3 bedrooms and 2 bathrooms, this home boasts new flooring, paint, kitchen, water heater, a newer furnace, newer windows. Not stopping there, it also features a new water main and Gas line all the way to the curb, ensuring peace of mind. Enjoy the cozy front porch, perfect for relaxation and welcoming guests. This home is ready for you to move in and make it your own!
-
2024-06-07price $99,900 426-char remark
Show marketing remark (426 chars)
This freshly renovated move in ready home is a gem! With 3 bedrooms and 2 bathrooms, this home boasts new flooring, paint, kitchen, water heater, a newer furnace, newer windows. Not stopping there, it also features a new water main and Gas line all the way to the curb, ensuring peace of mind. Enjoy the cozy front porch, perfect for relaxation and welcoming guests. This home is ready for you to move in and make it your own!
-
2024-05-22$110,000 Active 426-char remark
Show marketing remark (426 chars)
This freshly renovated move in ready home is a gem! With 3 bedrooms and 2 bathrooms, this home boasts new flooring, paint, kitchen, water heater, a newer furnace, newer windows. Not stopping there, it also features a new water main and Gas line all the way to the curb, ensuring peace of mind. Enjoy the cozy front porch, perfect for relaxation and welcoming guests. This home is ready for you to move in and make it your own!
-
2017-07-05soldstatus $10,000 86-char remark
Show marketing remark (86 chars)
House "sold as is" owner started renovations. Most of the demo is complete.
-
2017-03-21$15,000 86-char remark
Show marketing remark (86 chars)
House "sold as is" owner started renovations. Most of the demo is complete.
-
2016-06-17soldstatus $6,500
-
2016-02-02$9,500
-
2005-02-22soldstatus $45,900
-
1990-07-11soldstatus $31,900
-
1985-11-08soldstatus $32,500
-
1985-11-08soldstatus $32,500
ⓘ Source: listings_history table (triggers on properties + properties_extension) + one-shot
backfill from property_details.listing_events for pre-trigger history.
Tax reassessment forecast PA · Partial reset (capped growth)
- Current annual tax
- $528 · $44/mo
- Projected year-2 tax
- $1,173 · $98/mo
- Expected delta
- +$644/yr (+$54/mo · 121.9%)
ⓘ Screening estimate from a state-policy table — verify with the county assessor before closing.
Climate risk First Street
- Flood 4/10 Moderate FEMA zone X (unshaded) · 24% chance over 30 yrs
- Wildfire 1/10 Low
- Heat 3/10 Moderate 7 d/yr ≥90°F today · 18 d/yr by 30 yrs out
- Wind 1/10 Low
- Air quality 2/10 Low 1 unhealthy d/yr today · 3 by 30 yrs out
Nearby sold comps map
Loading sold comps map…
Walkable amenities ~0.75 mi
Loading nearby amenities…
Taxation est. · year 1
- Rental income
- $14,992
- − Mortgage interest
- −$6,442
- − Property taxes
- −$528
- − Insurance
- −$575
- − Repairs & maintenance
- −$1,199
- − Management
- −$1,199
- − Depreciation
- −$3,345
- Taxable income
- $1,702
- Est. tax owed @ 24.0%
- −$409
- After-tax cash flow
- $3,095/yr
For passive investors: Depreciation is non-cash, so a rental often shows a tax loss while cash-flowing — sheltering income. Rental losses are passive: they offset passive income freely, and up to $25,000/yr can offset ordinary (W-2) income if you actively participate and your MAGI is under $100k (phasing out to $0 by $150k); unused losses carry forward. On sale, claimed depreciation is recaptured at up to 25%, and gains may owe capital-gains tax (a 1031 exchange can defer both). Figures are a year-1 estimate at your 24.0% rate — not tax advice; consult a CPA.
Schools (NCES district)
- District
- Erie City SD
- NCES district ID
- 4209300
- Math proficiency
- 12% ▼ -11.00%
- Reading proficiency
- 19% ▼ -16.00%
- Median HH income
- $33,625
- Composite
- 12.59/100
- National rank
- #9617
- State rank
- #510 of 539 in PA
Livability — Erie
- Score
- 83/100
- State rank
- #109
- US rank
- #840
Category grades
Schools grade is shown separately in the Schools card above.
Census & demographics
- Census place
- Erie, PA
- County
- Erie County · 92,215 people
- City population
- 92,215
- Metro
- Erie, PA
- Population (ZIP)
- 8,597
- Household income
- $33,361
- Rent vs Own
- Severe rent burden
- 776.0
Population outlook (Erie County) Hauer SSP2
- Today (2025)
- 272,159 people
- By 2030
- 266,299 · -2.2%
- By 2040
- 250,987 · -7.8%
- By 2050
- 234,925 · -13.7%
- By 2075
- 199,164 · -26.8%
- By 2100
- 162,985 · -40.1%
Race, ethnicity, and origin ACS 2023
- Neighborhood character
- Diverse neighborhood (Simpson 0.60)
- Race & ethnicity
- White 58% Black 24% Two or more races 9% Hispanic / Latino 8% Asian 3%
- Hispanic origin (detail)
- Mexican 1% Puerto Rican 4%
- Common ancestry
- Romanian 10% Scotch-Irish 1% Lithuanian 1%
- Foreign-born
- 6% · Canada, Vietnam, China
- Languages at home
- 90% English-only · Spanish 5% Vietnamese 1% Russian/Polish/Slavic 1%
Political lean MEDSL · Erie
- 2024 margin
- Toss-up / Even · D 49.0% · R 50.0%
- 2008→2024 swing
- -20.9pp toward R · 2008: 19.9pp · 2024: -1.0pp
- All cycles
- 2024: R+1.0 2020: D+1.0 2016: R+2.0 2012: D+16.9 2008: D+19.9
Not yet ingested
- Civics
- —
Market trends
- HPI YoY
- ▲ 4.17%
- Current HPI
- 163.92
- Rent YoY
- ▲ 0.10%
- Metro
- Erie, PA
- State GDP YoY
- ▲ 1.68%
- F500 in state
- 34
Industry mix (Fortune 500 HQ in PA)
| Industry | F500 HQs | Revenue |
|---|---|---|
| Healthcare | 2 | $309B |
|
||
| Insurance | 2 | $27B |
|
||
| Telecommunications / Media | 1 | $124B |
|
||
| Industrial Distribution | 1 | $22B |
|
||
| Financial Services | 1 | $20B |
|
||
| Chemicals / Materials | 1 | $18B |
|
||
Price history
+253.8% since first listed15 events — show timeline
- 2026-04-25 Pending — GEBOR
- 2026-02-26 Listed $115,000 GEBOR
- 2024-07-11 Sold (Public Records) $93,000 Public Records
- 2024-07-10 Sold (MLS) $93,000 GEBOR
- 2024-06-14 Pending — GEBOR
- 2024-06-07 Price Changed $99,900 GEBOR
- 2024-05-22 Listed $110,000 GEBOR
- 2017-07-05 Sold (MLS) $10,000 GEBOR
- 2017-03-21 Listed $15,000 GEBOR
- 2016-06-17 Sold (MLS) $6,500 GEBOR
- 2016-02-02 Listed $9,500 GEBOR
- 2005-02-22 Sold (Public Records) $45,900 Public Records
- 1990-07-11 Sold (Public Records) $31,900 Public Records
- 1985-11-08 Sold (Public Records) $32,500 Public Records
- 1985-11-08 Sold (Public Records) $32,500 Public Records
Property tax history
-9.1%/yrLatest (2026): $528 · +3.4% YoY. Source: county tax records.
Cash-flow waterfall
monthlySold comps — $/sqft
last 12 mo · ≤1 miLoading sold comps…