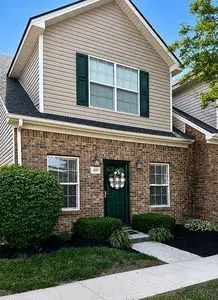
1119 Oatlands Park · Lexington-Fayette, KY
Flood risk 1/10 · Minimal
- FEMA flood zone
- X (unshaded)
- Chance of flooding over 30 yrs
- 0.0%
- Est. flood insurance / yr
- $507 – $1,088
Fire risk 2/10 · Minimal
- Est. fire insurance / yr
- $839 – $1,559
Heat risk 4/10 · Minor
- Hot days now (above 102°F)
- 7 days/yr
- Hot days in 30 yrs
- 19 days/yr
Wind risk 2/10 · Minimal
- Chance of severe wind over 30 yrs
- 3.0%
Air-quality risk 1/10 · Minimal
- Unhealthy air days now
- 0 days/yr
- Unhealthy air days in 30 yrs
- 0 days/yr
Risk factors via First Street. Map © Google.
Why this score? — see what drove the D grade
The composite is a weighted blend of 9 inputs, each scored 0–100. Each bar is that input's sub-score; the figure is the points it added to the 100-point composite (weight × sub-score).
- Cash flow +15.2/30.0
- ARV discount +7.5/15.0
- DSCR +4.7/10.0
- Schools +3.4/10.0
- 1% rule +3.2/10.0
- Rent growth +3.1/5.0
- Livability +2.5/5.0
- Condition / age +2.5/5.0
- Appreciation +0.0/10.0
$279,900
🖨 Deal sheet (PDF) 📄 Offer letter ✓ Due diligence
Listing remarks MLS
Deceptively huge town home with tons of storage. This executive townhouse is ready for your imagination. The first floor boasts everything you need for one floor living including kitchen and dining area, family room, laundry, bedroom and bathroom with private access to a patio. The second floor is over 800 square feet shared between two bedrooms and a bathroom. Cathedral ceilings and lots of storage space will allow your creative side to come alive here. Recent updates include hvac 7 years, hot water heater 5 years, shutters this year. Situated in a private deed restricted community with extremely convenient location close to Hamburg, I75 & I64, Polo Club Todds Rd and Man O War corridors.
Key facts
- Abundance of storage
- Executive town-home
- Built 2005
Tags
Neighborhood map
What this means for you Summary
Snapshot
- This is a 3-bed/2.0-bath other listed at $280k.
Deal economics
- At list price, monthly cash flow is $98 ($1k/yr) — positive.
- The deal already cash-flows at list — no discount required.
- To meet the 1% rule (rent ≥ 1% of price), the offer needs to be $230k (17.8% below list).
- Recommended offer: $230k (17.8% below list) — sets the bar for 1% rule.
- Cap rate 6.7% vs local median 3.8% in Lexington-Fayette — top-decile yield for the area; either an underpriced asset or a hidden risk that comps aren't pricing in. Stress-test before assuming the spread holds.
Location & tenants
- Location reads: area grade D — affects rentability + tenant quality, not the cash-flow math above.
- Fayette County (urban): math 35% / reading 45% proficiency, ranked #27 of 165 in KY (top 16%) — families likely to look elsewhere, expect single-tenant / working-renter base with shorter leases.
- Zoned schools: Athens-Chilesburg Elementary (math 65% / reading 70%, grade B+, #12 of 676 statewide, top 2%, 533 students, 17% FRL); Edythe Jones Hayes Middle School (math 47% / reading 60%, grade C+, #13 of 217 statewide, top 6%, 1,081 students, 37% FRL); Henry Clay High School (math 43% / reading 49%, grade D-, #20 of 254 statewide, top 8%, 2,031 students, 47% FRL).
- Zoned-school proficiency averages 56% at this address vs 40% district-wide (+16 pts) — the actual schools serving this property are materially stronger than the Fayette County average implies; a family-tenant draw the district grade alone would hide.
- Market conditions: Rents rising (+2.2%/yr); 280 active listings in the ZIP; 7 comparable units currently listed for rent nearby; rentals at typical pace (median 16d on market — plan ~3-4 weeks tenant-placement turnaround); solid renter incomes; 1,036 units permitted in Fayette County in 2024 (542 in 5+ unit buildings).
Forward outlook
- Local home prices are declining (-3.0%/yr); year-one equity from $2k of loan paydown is wiped out by about $8k of value loss. Plan a longer hold.
- Fayette County population projected at +35% by 2050 — long-run rental-demand tailwind backs the buy-and-hold thesis.
Negotiation context
- It's been on market 16 days — a 2% lower offer ($276k) is reasonable based on typical stale-listing flexibility.
- 5 sale attempts since 22y ago with the ask held roughly flat each time — persistent listings suggest the price (not the market) is what's stuck; bring a comps-based counter.
- Current owner paid $172k; list at $280k implies a 63% gain — meaningful room to come down on a strong offer.
Questions for the listing agent
- Is there a deadline driving the sale (1031 exchange, divorce, estate, relocation)? That informs how much negotiation room exists.
- The area grade is low — what's the realistic commute time and amenity access for the typical tenant pool here? Any planned neighborhood developments (good or bad) we should know about?
- What's the average days-on-market for RENTAL listings here right now (not sales)? A rising rental-DOM trend means longer vacancies and softer asking-rent achievability than the comps imply.
- What's the recent tenant-quality profile in this submarket — average credit score on applications, eviction rate, late-payment / NSF rate, and stable-employment percentage? A property-management company in the area should have these aggregated.
- How much new for-sale + rental construction is in the pipeline within 1–3 miles? Heavy new supply typically softens prices + rents 12–24 months out; constrained supply supports both.
Investment metrics
- 1% rule
- 0.82% ✗
- Cap rate
- 6.71%
- Cash-on-cash
- 1.50%
- DSCR
- 1.07
- GRM
- 10.1
CMA / ARV
No comps found within radius.
Projected returns pro-forma
-3.0% appreciation · 2.22% rent growth · sell at horizon
- IRR
- -14.7%
- Equity multiple
- 0.48×
- Total profit
- $-41,005
- Equity at exit
- $41,734
- IRR
- -7.3%
- Equity multiple
- 0.55×
- Total profit
- $-35,304
- Equity at exit
- $24,201
Cash invested: $78,372 (down + closing). Projections, not guarantees.
Landlord ↔ Tenant lean methodology
- Overall (STATE)
- 83 Strongly Landlord-Friendly
- State Kentucky
- 83 Strongly Landlord-Friendly · R+16
- County
- — inherits STATE
- City
- — inherits STATE
ZIP-level market 40509
- Home prices YoY
- -20.6%
- Rents YoY
- 2.2%
- Active inventory
- 280
- Price-to-rent
- 10.1×
Monthly cashflow live
- Estimated rent
- $2,301 high interval (Pro) →
- Mortgage (P&I)
- −$1,468
- Tax from tax record
- −$135 /mo · $1,624/yr
- Insurance
- −$117
- HOA
- −$0
- Vacancy / Maint / Mgmt
- −$483
- Net cashflow
- $98
Break-even live
Sensitivity live
| Price | -10% $256 | -5% $177 | +0% $98 | +5% $19 | +10% $-60 |
|---|---|---|---|---|---|
| Rent | -10% $-84 | -5% $7 | +0% $98 | +5% $189 | +10% $280 |
| Rate | -1.0pp $239 | -0.5pp $169 | base $98 | +0.5pp $25 | +1.0pp $-48 |
UW: 25.0% down · 7.5% · 30yr · 1.5% tax · 5.0% vac · 8.0% maint · 8.0% mgmt
Financing live
Cash to close
- Down payment
- $69,975
- Closing costs
- $8,397
- Reserves months
- —
- Total cash needed
- —
Loan-product check · same deal, 3 products live
Conventional
25% down · 7.5% · 30yr
- Down + closing
- —
- Monthly P&I
- —
- Monthly cashflow
- —
- DSCR
- —
- Eligible?
- —
Personal DTI + credit; lowest rate.
DSCR
20% down · 8.5% · 30yr
- Down + closing
- —
- Monthly P&I
- —
- Monthly cashflow
- —
- DSCR
- —
- Eligible?
- —
No personal income docs; deal must DSCR.
Hard money
10% down · 12.0% · 12mo
- Down + closing
- —
- Monthly P&I
- —
- Monthly cashflow
- —
- DSCR
- —
- Eligible?
- —
Short-term bridge; refi at stabilization.
Rent comps 7 comps
| Address | Beds | Baths | Sqft | Rent | $/sqft | DOM | Units | Dist |
|---|---|---|---|---|---|---|---|---|
| 4176 Todds Rd Lexington, KY | 1.0–3.0 | 1.0–2.0 | 1245 | $2,100 | $1.69 | 15d | 15 | 0.27mi |
| 3644 Iron Lace Dr Lexington, KY | 4.0 | 2.5 | 1688 | $2,295 | $1.36 | 15d | 1 | 0.67mi |
| 3548 Stolen Horse Trce Lexington, KY | 4.0 | 2.5 | 2500 | $2,995 | $1.20 | 25d | 1 | 0.70mi |
| 467 Hays Blvd Lexington, KY | 2.0–3.0 | 2.5 | 1436 | $1,947 | $1.36 | 15d | 3 | 1.06mi |
| 4636 Marcus Trl Lexington, KY | 4.0 | 2.5 | 2440 | $2,500 | $1.02 | 15d | 1 | 1.07mi |
| 1409 Pleasant Ridge Dr Lexington, KY | 4.0 | 2.5 | 1694 | $3,250 | $1.92 | 25d | 1 | 1.25mi |
| 421 Forest Hill Dr Lexington, KY | 3.0 | 2.5 | 2151 | $2,295 | $1.07 | 25d | 1 | 1.37mi |
Listing history 12 events
-
2026-06-22days on market $279,900 Active 16 DOM
-
2026-06-18days on market $279,900 Active 13 DOM
-
2026-06-17days on market $279,900 Active 12 DOM
-
2026-06-16days on market $279,900 Active 11 DOM
-
2026-06-15days on market $279,900 Active 10 DOM
-
2026-06-14days on market $279,900 Active 8 DOM
-
2026-06-13days on market $279,900 Active 7 DOM
-
2026-06-10days on market $279,900 Active 5 DOM
-
2026-06-09days on market $279,900 Active 4 DOM
-
2026-06-08days on market $279,900 Active 3 DOM
-
2026-06-07remarks 683-char remark
-
2026-06-07$279,900 Active 2 DOM
ⓘ Source: listings_history table (triggers on properties + properties_extension) + one-shot
backfill from property_details.listing_events for pre-trigger history.
Tax reassessment forecast KY · Resets to sale price
- Current annual tax
- $1,624 · $135/mo
- Projected year-2 tax
- $2,407 · $201/mo
- Expected delta
- +$783/yr (+$65/mo · 48.2%)
ⓘ Screening estimate from a state-policy table — verify with the county assessor before closing.
Climate risk First Street
- Flood 1/10 Low FEMA zone X (unshaded) · 0% chance over 30 yrs
- Wildfire 2/10 Low
- Heat 4/10 Moderate 7 d/yr ≥102°F today · 19 d/yr by 30 yrs out
- Wind 2/10 Low 3% chance of damaging wind over 30 yrs
- Air quality 1/10 Low 0 unhealthy d/yr today · 0 by 30 yrs out
Nearby sold comps map
Loading sold comps map…
Walkable amenities ~0.75 mi
Loading nearby amenities…
Taxation est. · year 1
- Rental income
- $27,612
- − Mortgage interest
- −$15,679
- − Property taxes
- −$1,624
- − Insurance
- −$1,400
- − Repairs & maintenance
- −$2,209
- − Management
- −$2,209
- − Depreciation
- −$8,143
- Taxable loss
- −$3,651
- Est. tax savings @ 24.0%
- +$876
- After-tax cash flow
- $2,052/yr
For passive investors: Depreciation is non-cash, so a rental often shows a tax loss while cash-flowing — sheltering income. Rental losses are passive: they offset passive income freely, and up to $25,000/yr can offset ordinary (W-2) income if you actively participate and your MAGI is under $100k (phasing out to $0 by $150k); unused losses carry forward. On sale, claimed depreciation is recaptured at up to 25%, and gains may owe capital-gains tax (a 1031 exchange can defer both). Figures are a year-1 estimate at your 24.0% rate — not tax advice; consult a CPA.
Schools (NCES district)
- District
- Fayette County
- NCES district ID
- 2101860
- Math proficiency
- 35% ▼ -16.00%
- Reading proficiency
- 45% ▼ -13.00%
- Median HH income
- $49,245
- Composite
- 34.38/100
- National rank
- #5211
- State rank
- #27 of 165 in KY
Livability — Lexington-Fayette
No livability data for this city. (Only ~50 U.S. cities are tracked.)
Census & demographics
- Census place
- Lexington-Fayette, KY
- County
- Fayette County · 317,143 people
- City population
- 321,882
- Metro
- Lexington-Fayette, KY
- Population (ZIP)
- 47,036
- Household income
- $94,804
- Rent vs Own
- Severe rent burden
- 1763.0
Population outlook (Fayette County) Hauer SSP2
- Today (2025)
- 363,454 people
- By 2030
- 388,270 · +6.8%
- By 2040
- 438,688 · +20.7%
- By 2050
- 490,667 · +35.0%
- By 2075
- 625,394 · +72.1%
- By 2100
- 721,354 · +98.5%
Race, ethnicity, and origin ACS 2023
- Neighborhood character
- Predominantly White (67%)
- Race & ethnicity
- White 67% Black 14% Two or more races 8% Asian 7% Hispanic / Latino 7%
- Hispanic origin (detail)
- Mexican 4%
- Common ancestry
- Italian 2% Slovak 2% Romanian 2%
- Foreign-born
- 12% · Canada, China
- Languages at home
- 84% English-only · Spanish 6% Other Indo-European 3% Other Asian/Pacific 2%
Political lean MEDSL · Fayette
- 2024 margin
- D (+18.1) · D 58.0% · R 39.9% · Other 2.1%
- 2008→2024 swing
- +13.3pp toward D · 2008: 4.8pp · 2024: 18.1pp
- All cycles
- 2024: D+18.1 2020: D+20.8 2016: D+9.5 2012: D+1.0 2008: D+4.8
Not yet ingested
- Civics
- —
Market trends
- HPI YoY
- ▼ -58.72%
- Current HPI
- 226.8663
- Rent YoY
- ▲ 2.22%
- Metro
- Lexington-Fayette, KY
- State GDP YoY
- ▲ 1.81%
- F500 in state
- 4
Industry mix (Fortune 500 HQ in KY)
| Industry | F500 HQs | Revenue |
|---|---|---|
| Healthcare | 1 | $118B |
|
||
| Food / Beverage | 1 | $7B |
|
||
Price history
+107.5% since first listed14 events — show timeline
- 2026-06-06 Listed $279,900 FSBO.com
- 2021-03-09 Sold (Public Records) $172,000 Public Records
- 2021-02-16 Sold (MLS) $172,000 ImagineMLS
- 2021-01-23 Pending — ImagineMLS
- 2021-01-06 Contingent — ImagineMLS
- 2021-01-01 Price Changed $179,900 ImagineMLS
- 2020-12-07 Listed $184,900 ImagineMLS
- 2005-11-01 Sold (MLS) $134,900 ImagineMLS
- 2005-08-01 Listing Removed — ImagineMLS
- 2005-05-15 Listed $134,900 ImagineMLS
- 2005-04-15 Listing Removed — ImagineMLS
- 2005-01-12 Listing Removed — ImagineMLS
- 2004-03-15 Listed $134,900 ImagineMLS
- 2004-03-15 Listed $134,900 ImagineMLS
Property tax history
+1.8%/yrLatest (2015): $1,624 · +1.8% YoY. Source: county tax records.
Cash-flow waterfall
monthlySold comps — $/sqft
last 12 mo · ≤1 miLoading sold comps…