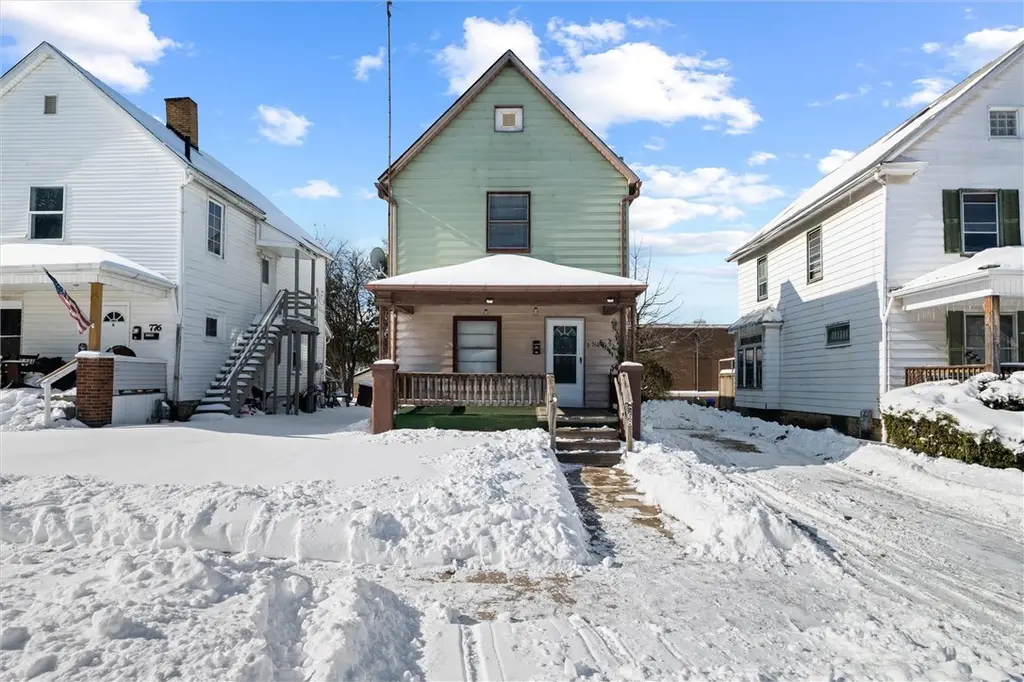
768 Baldwin Ave · Sharon, PA
Flood risk 1/10 · Minimal
- FEMA flood zone
- X (unshaded)
- Chance of flooding over 30 yrs
- 0.0%
- Est. flood insurance / yr
- $507 – $1,088
Fire risk 1/10 · Minimal
- Est. fire insurance / yr
- $511 – $949
Heat risk 3/10 · Minor
- Hot days now (above 97°F)
- 7 days/yr
- Hot days in 30 yrs
- 17 days/yr
Wind risk 1/10 · Minimal
- Chance of severe wind over 30 yrs
- —
Air-quality risk 3/10 · Minor
- Unhealthy air days now
- 2 days/yr
- Unhealthy air days in 30 yrs
- 6 days/yr
Risk factors via First Street. Map © Google.
Why this score? — see what drove the B+ grade
The composite is a weighted blend of 9 inputs, each scored 0–100. Each bar is that input's sub-score; the figure is the points it added to the 100-point composite (weight × sub-score).
- Cash flow +30.0/30.0
- ARV discount +15.0/15.0
- DSCR +10.0/10.0
- 1% rule +9.6/10.0
- Livability +3.2/5.0
- Rent growth +2.5/5.0
- Schools +2.5/10.0
- Condition / age +2.5/5.0
- Appreciation +0.0/10.0
$75,000
🖨 Deal sheet (PDF) 📄 Offer letter ✓ Due diligence
Listing remarks MLS
Spacious 3–4 bedroom investment property offering flexible living and strong rental appeal. The main home features the possibility of a first-floor bedroom( or den) , a large living room, and an eat-in kitchen—ideal for comfortable everyday living. Convenient first-floor laundry and a half bath add to the functionality. Upstairs offers the potential for 2–3 additional bedrooms, plus a walk-up attic providing extra storage or future expansion possibilities. Newer furnace and 100 amp electric service. Adding even more value, the property includes a separate efficiency apartment in the rear unit—perfect for rental income. A great opportunity for investors or owner-occupants looking to offset expenses while building equity.
Key facts
- Half bath
- Walk up attic
- Eat in kitchen
Tags
Neighborhood map
What this means for you Summary
Snapshot
- This is a 4-bed/2.5-bath single-family listed at $75k.
Deal economics
- At list price, monthly cash flow is $337 ($4k/yr) — positive.
- The deal already cash-flows at list — no discount required.
- Meets the 1% rule at list price ($1k rent vs $75k).
- Recommended offer: $66k (12.0% below list) — sets the bar for market timing.
Location & tenants
- Location reads 65/100 on livability (#1,100 in PA) — a middle-class / working-renter tenant base. Strengths: cost of living A+, housing A+, health & safety A+; Watch: crime F, amenities F, commute F.
- Sharon City SD (suburban): math 20% / reading 42% proficiency, ranked #446 of 539 in PA (top 83%) — families likely to look elsewhere, expect single-tenant / working-renter base with shorter leases; 67% free/reduced lunch — lower-income household profile, screen leases tightly.
- Zoned schools: Musser El Sch (math 17% / reading 32%, grade F, #1,180 of 1,518 statewide, top 80%, 309 students, 100% FRL); Sharon Ms (math 7% / reading 42%, grade F, #420 of 512 statewide, top 82%, 308 students, 100% FRL); Sharon Hs (math 57% / reading 74%, grade B, #63 of 437 statewide, top 14%, 523 students, 95% FRL) — zoned schools average 98% FRL vs 67% district-wide (31 pts higher); higher-poverty schools than district average — tighter screening recommended.
- Market conditions: 75 active listings in the ZIP; 10 comparable units currently listed for rent nearby; rentals at typical pace (median 16d on market — plan ~3-4 weeks tenant-placement turnaround); 62 units permitted in Mercer County in 2024 (0 in 5+ unit buildings).
Forward outlook
- Local home prices are declining (-3.0%/yr); year-one equity from $519 of loan paydown is wiped out by about $2k of value loss. Plan a longer hold.
- Mercer County population projected at -22% by 2050 — secular population decline; favor cash flow + early exit over multi-decade hold.
- At projected returns (-3.0% appreciation + 3.0% rent growth), your $21k cash investment doubles in ~7 years — after that, you're playing with house money.
Negotiation context
- It's been on market 141 days — a 12% lower offer ($66k) is reasonable based on typical stale-listing flexibility.
- 2 sale attempts since 11y ago with the ask held roughly flat each time — persistent listings suggest the price (not the market) is what's stuck; bring a comps-based counter.
Questions for the listing agent
- It's been on market 141 days. Have you received any prior offers? Is the seller open to a 12% concession, seller financing, or rate buy-down credit?
- Why hasn't it sold? Are there any deal-killer items the seller is aware of (foundation, flood, title, zoning, code violations)?
- Is there a deadline driving the sale (1031 exchange, divorce, estate, relocation)? That informs how much negotiation room exists.
- Schools are D-rated, which usually means shorter tenancies and higher turnover. Who's the typical renter profile here, and what's been the actual vacancy rate?
- Crime grade is F in this area — have there been break-ins, vandalism, or insurance claims at this property in the last 3 years? What carrier currently insures it and at what premium?
- What's the average days-on-market for RENTAL listings here right now (not sales)? A rising rental-DOM trend means longer vacancies and softer asking-rent achievability than the comps imply.
- What's the recent tenant-quality profile in this submarket — average credit score on applications, eviction rate, late-payment / NSF rate, and stable-employment percentage? A property-management company in the area should have these aggregated.
- How much new for-sale + rental construction is in the pipeline within 1–3 miles? Heavy new supply typically softens prices + rents 12–24 months out; constrained supply supports both.
Investment metrics
- 1% rule
- 1.46% ✓
- Cap rate
- 11.69%
- Cash-on-cash
- 19.27%
- DSCR
- 1.86
- GRM
- 5.7
CMA / ARV
- ARV (median comp)
- $102,546
- List price
- $75,000
- Delta
- -26.86%
- Verdict
- UNDERPRICED
- Comps
- 3 within 2.0 mi
Show comp detail 12 sales within ~0.75 mi
| Address | Dist | Beds/Ba | Sqft | Sold | Price | $/sf | Match |
|---|---|---|---|---|---|---|---|
| 784 Baldwin Ave | 0.01mi | 3/1.0 (-1) | — | 1mo | $45,000 | — | 75 |
| 564 Spruce Ave | 0.23mi | 3/1.0 (-1) | — | 2mo | $110,000 | — | 64 |
| 655 New Castle Ave | 0.25mi | 3/1.0 (-1) | — | 1mo | $100,000 | — | 64 |
| 834 Spencer Ave | 0.49mi | 4/2.0 | — | 1mo | $131,000 | — | 62 |
| 695 Crowder Ave | 0.39mi | 3/2.0 (-1) | — | 2mo | $159,000 | — | 61 |
| 521 Mcclure | 0.31mi | 3/1.0 (-1) | — | 2mo | $55,000 | — | 60 |
| 368 Stambaugh Ave | 0.40mi | 3/1.5 (-1) | — | 2mo | $90,900 | — | 58 |
| 1040 March St | 0.37mi | 3/0.5 (-1) | — | 1mo | $40,000 | — | 56 |
| 203 Baldwin Ave | 0.54mi | 4/1.0 | — | 1mo | $40,000 | — | 56 |
| 432 Alderman Ave | 0.44mi | 3/1.0 (-1) | — | 1mo | $45,000 | — | 55 |
| 273 Orchard St | 0.50mi | 3/1.0 (-1) | — | 1mo | $50,000 | — | 52 |
| 124 Wengler Ave | 0.65mi | 3/1.0 (-1) | — | 1mo | $101,000 | — | 45 |
Match score weights: distance 35% · size 25% · config 20% · recency 20%. Top-matched comps best support the ARV.
Projected returns pro-forma
-3.0% appreciation · 3.0% rent growth · sell at horizon
- IRR
- 11.2%
- Equity multiple
- 1.44×
- Total profit
- $9,345
- Equity at exit
- $11,183
- IRR
- 20.3%
- Equity multiple
- 2.71×
- Total profit
- $35,886
- Equity at exit
- $6,485
Cash invested: $21,000 (down + closing). Projections, not guarantees.
Landlord ↔ Tenant lean methodology
- Overall (STATE)
- 62 Landlord-Friendly
- State Pennsylvania
- 62 Landlord-Friendly · EVEN
- County
- — inherits STATE
- City
- — inherits STATE
ZIP-level market 16146
- Active inventory
- 75
- Price-to-rent
- 5.7×
Monthly cashflow live
- Estimated rent
- $1,098 high interval (Pro) →
- Mortgage (P&I)
- −$393
- Tax from tax record
- −$106 /mo · $1,268/yr
- Insurance
- −$31
- HOA
- −$0
- Vacancy / Maint / Mgmt
- −$231
- Net cashflow
- $337
Break-even live
Sensitivity live
| Price | -10% $380 | -5% $358 | +0% $337 | +5% $316 | +10% $295 |
|---|---|---|---|---|---|
| Rent | -10% $250 | -5% $294 | +0% $337 | +5% $381 | +10% $424 |
| Rate | -1.0pp $375 | -0.5pp $356 | base $337 | +0.5pp $318 | +1.0pp $298 |
UW: 25.0% down · 7.5% · 30yr · 1.5% tax · 5.0% vac · 8.0% maint · 8.0% mgmt
Financing live
Cash to close
- Down payment
- $18,750
- Closing costs
- $2,250
- Reserves months
- —
- Total cash needed
- —
Loan-product check · same deal, 3 products live
Conventional
25% down · 7.5% · 30yr
- Down + closing
- —
- Monthly P&I
- —
- Monthly cashflow
- —
- DSCR
- —
- Eligible?
- —
Personal DTI + credit; lowest rate.
DSCR
20% down · 8.5% · 30yr
- Down + closing
- —
- Monthly P&I
- —
- Monthly cashflow
- —
- DSCR
- —
- Eligible?
- —
No personal income docs; deal must DSCR.
Hard money
10% down · 12.0% · 12mo
- Down + closing
- —
- Monthly P&I
- —
- Monthly cashflow
- —
- DSCR
- —
- Eligible?
- —
Short-term bridge; refi at stabilization.
Rent comps 10 comps
| Address | Beds | Baths | Sqft | Rent | $/sqft | DOM | Units | Dist |
|---|---|---|---|---|---|---|---|---|
| 726 Baldwin Ave Sharon, PA | 3.0 | 1.0 | — | $1,100 | — | 15d | 1 | 0.07mi |
| 523 New Castle Ave Sharon, PA | 3.0 | 1.0 | — | $1,000 | — | 15d | 1 | 0.34mi |
| 979 King St Sharon, PA | 3.0 | 1.0 | — | $895 | — | 45d | 1 | 0.50mi |
| 1023 Negley St Farrell, PA | 3.0 | 1.0 | — | $1,095 | — | 15d | 1 | 0.83mi |
| 107 N Oakland Ave Unit 2 Sharon, PA | 3.0 | 1.0 | — | $1,100 | — | 23d | 1 | 0.88mi |
| 515 Wallis Ave Farrell, PA | 4.0 | 1.5 | — | $1,100 | — | 45d | 1 | 0.89mi |
| 136 5th Ave Sharon, PA | 3.0 | 1.0 | 3049 | $899 | $0.29 | 15d | 1 | 0.92mi |
| 557 Lafayette Ave Sharon, PA | 3.0 | 1.0 | — | $1,000 | — | 15d | 1 | 1.14mi |
| Mercer Ave Wheatland, PA | 3.0 | 1.5 | — | $850 | — | 15d | 1 | 1.23mi |
| 420 Reed St Sharon, PA | 3.0 | 1.0 | — | $995 | — | 15d | 1 | 1.34mi |
Listing history 20 events
-
2026-06-21days on market $75,000 Active 141 DOM
-
2026-06-19days on market $75,000 Active 139 DOM
-
2026-06-18days on market $75,000 Active 138 DOM
-
2026-06-17days on market $75,000 Active 137 DOM
-
2026-06-16days on market $75,000 Active 136 DOM
-
2026-06-15days on market $75,000 Active 135 DOM
-
2026-06-14days on market $75,000 Active 133 DOM
-
2026-06-13days on market $75,000 Active 132 DOM
-
2026-06-10days on market $75,000 Active 130 DOM
-
2026-06-09days on market $75,000 Active 129 DOM
-
2026-06-08days on market $75,000 Active 128 DOM
-
2026-06-07days on market $75,000 Active 127 DOM
-
2026-06-05days on market $75,000 Active 124 DOM
-
2026-06-02days on market $75,000 Active 122 DOM
-
2026-06-01days on market $75,000 Active 121 DOM
-
2026-05-31days on market $75,000 Active 120 DOM
-
2026-05-30days on market $75,000 Active 119 DOM
-
2026-01-25$75,000 Active 753-char remark
Show marketing remark (753 chars)
Spacious 3–4 bedroom investment property offering flexible living and strong rental appeal. The main home features the possibility of a first-floor bedroom( or den) , a large living room, and an eat-in kitchen—ideal for comfortable everyday living. Convenient first-floor laundry and a half bath add to the functionality. Upstairs offers the potential for 2–3 additional bedrooms, plus a walk-up attic providing extra storage or future expansion possibilities. Newer furnace and 100 amp electric service. Adding even more value, the property includes a separate efficiency apartment in the rear unit—perfect for rental income. A great opportunity for investors or owner-occupants looking to offset expenses while building equity.
-
2016-06-23historical 425-char remark
Show marketing remark (425 chars)
Remolded Mother-In-Law Suite. Spacious covered back deck with a large fenced in area giving you privacy right outside your back door. Large Eat-in Kitchen, Laundry Room Conveniently located on Main Level. Ceramic tile in kitchen and Laundry room. Central Air. Walk up Attic. 2013 Hot water tank. Remodeled Guest/Mother-in-law suite located behind home complete with Full Bath/Kitchen, New Siding and Roof. Off Street Parking.
-
2015-06-24$47,500 425-char remark
Show marketing remark (425 chars)
Remolded Mother-In-Law Suite. Spacious covered back deck with a large fenced in area giving you privacy right outside your back door. Large Eat-in Kitchen, Laundry Room Conveniently located on Main Level. Ceramic tile in kitchen and Laundry room. Central Air. Walk up Attic. 2013 Hot water tank. Remodeled Guest/Mother-in-law suite located behind home complete with Full Bath/Kitchen, New Siding and Roof. Off Street Parking.
ⓘ Source: listings_history table (triggers on properties + properties_extension) + one-shot
backfill from property_details.listing_events for pre-trigger history.
Tax reassessment forecast PA · Partial reset (capped growth)
- Current annual tax
- $1,268 · $106/mo
- Projected year-2 tax
- $1,268 · $106/mo
- Expected delta
- $0/yr ($0/mo · 0.0%)
ⓘ Screening estimate from a state-policy table — verify with the county assessor before closing.
Climate risk First Street
- Flood 1/10 Low FEMA zone X (unshaded) · 0% chance over 30 yrs
- Wildfire 1/10 Low
- Heat 3/10 Moderate 7 d/yr ≥97°F today · 17 d/yr by 30 yrs out
- Wind 1/10 Low
- Air quality 3/10 Moderate 2 unhealthy d/yr today · 6 by 30 yrs out
Nearby sold comps map
Loading sold comps map…
Walkable amenities ~0.75 mi
Loading nearby amenities…
Taxation est. · year 1
- Rental income
- $13,176
- − Mortgage interest
- −$4,201
- − Property taxes
- −$1,268
- − Insurance
- −$375
- − Repairs & maintenance
- −$1,054
- − Management
- −$1,054
- − Depreciation
- −$2,182
- Taxable income
- $3,041
- Est. tax owed @ 24.0%
- −$730
- After-tax cash flow
- $3,316/yr
For passive investors: Depreciation is non-cash, so a rental often shows a tax loss while cash-flowing — sheltering income. Rental losses are passive: they offset passive income freely, and up to $25,000/yr can offset ordinary (W-2) income if you actively participate and your MAGI is under $100k (phasing out to $0 by $150k); unused losses carry forward. On sale, claimed depreciation is recaptured at up to 25%, and gains may owe capital-gains tax (a 1031 exchange can defer both). Figures are a year-1 estimate at your 24.0% rate — not tax advice; consult a CPA.
Schools (NCES district)
- District
- Sharon City SD
- NCES district ID
- 4221330
- Math proficiency
- 20% ▼ -10.00%
- Reading proficiency
- 42% ▼ -8.00%
- Median HH income
- $31,081
- Composite
- 25.14/100
- National rank
- #7521
- State rank
- #446 of 539 in PA
Livability — Sharon
- Score
- 65/100
- State rank
- #1100
- US rank
- #12460
Category grades
Schools grade is shown separately in the Schools card above.
Census & demographics
- Census place
- Sharon, PA
- County
- Mercer County · 28,053 people
- City population
- 12,936
- Metro
- Youngstown-Warren-Boardman, OH-PA
- Population (ZIP)
- 12,936
- Household income
- $45,670
- Rent vs Own
- Severe rent burden
- 685.0
Population outlook (Mercer County) Hauer SSP2
- Today (2025)
- 108,341 people
- By 2030
- 104,269 · -3.8%
- By 2040
- 94,624 · -12.7%
- By 2050
- 84,891 · -21.6%
- By 2075
- 65,094 · -39.9%
- By 2100
- 47,657 · -56.0%
Race, ethnicity, and origin ACS 2023
- Neighborhood character
- Predominantly White (76%)
- Race & ethnicity
- White 76% Black 16% Two or more races 7% Hispanic / Latino 3%
- Common ancestry
- Romanian 3% Slovak 2% Iranian 1%
- Foreign-born
- 4% · Canada
- Languages at home
- 97% English-only · Russian/Polish/Slavic 1% Spanish 1% Arabic 1%
Political lean MEDSL · Mercer
- 2024 margin
- Solid R (+30.2) · D 34.5% · R 64.7%
- 2008→2024 swing
- -29.9pp toward R · 2008: -0.3pp · 2024: -30.2pp
- All cycles
- 2024: R+30.2 2020: R+26.0 2016: R+25.0 2012: R+2.5 2008: R+0.3
Not yet ingested
- Civics
- —
Market trends
- HPI YoY
- ▼ -109.55%
- Current HPI
- 155.0912
- Rent YoY
- —
- Metro
- Youngstown-Warren-Boardman, OH-PA
- State GDP YoY
- ▲ 1.68%
- F500 in state
- 34
Industry mix (Fortune 500 HQ in PA)
| Industry | F500 HQs | Revenue |
|---|---|---|
| Healthcare | 2 | $309B |
|
||
| Insurance | 2 | $27B |
|
||
| Telecommunications / Media | 1 | $124B |
|
||
| Industrial Distribution | 1 | $22B |
|
||
| Financial Services | 1 | $20B |
|
||
| Chemicals / Materials | 1 | $18B |
|
||
Price history
+57.9% since first listed3 events — show timeline
- 2026-01-25 Listed $75,000 West Penn MLS
- 2016-06-23 Delisted — West Penn MLS
- 2015-06-24 Listed $47,500 West Penn MLS
Property tax history
-3.9%/yrLatest (2025): $1,268 · +4.0% YoY. Source: county tax records.
Cash-flow waterfall
monthlySold comps — $/sqft
last 12 mo · ≤1 miLoading sold comps…