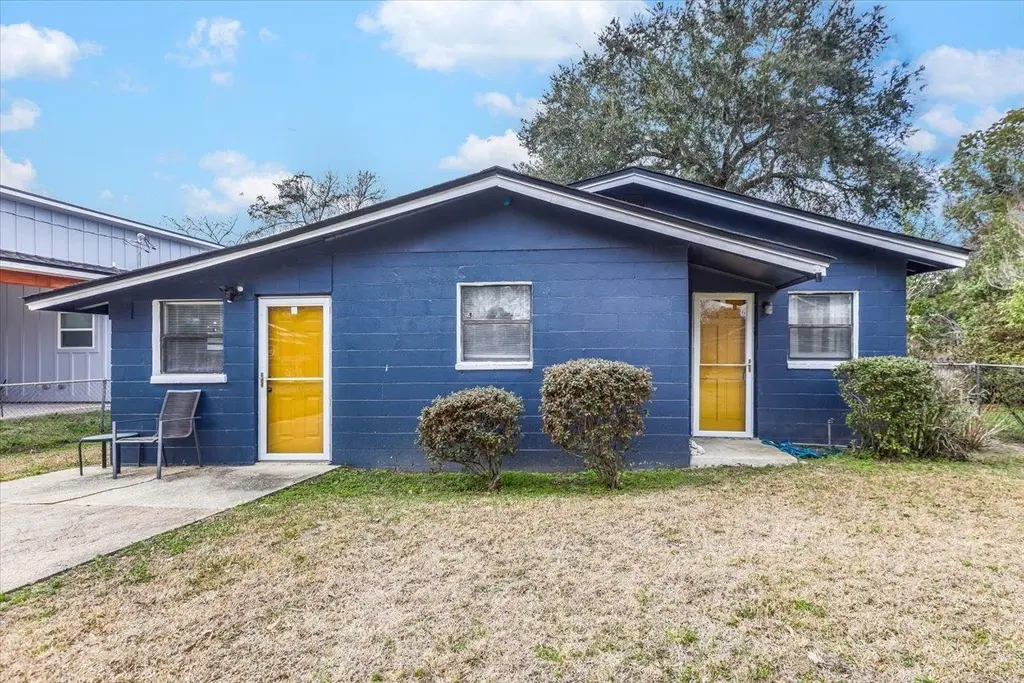
516 Thomas St · Quincy, FL
Flood risk 1/10 · Minimal
- FEMA flood zone
- X (unshaded)
- Chance of flooding over 30 yrs
- 0.0%
- Est. flood insurance / yr
- $507 – $1,088
Fire risk 4/10 · Minor
- Est. fire insurance / yr
- $947 – $1,759
Heat risk 8/10 · Major
- Hot days now (above 107°F)
- 7 days/yr
- Hot days in 30 yrs
- 21 days/yr
Wind risk 9/10 · Severe
- Chance of severe wind over 30 yrs
- 99.0%
Air-quality risk 4/10 · Minor
- Unhealthy air days now
- 5 days/yr
- Unhealthy air days in 30 yrs
- 6 days/yr
Risk factors via First Street. Map © Google.
Why this score? — see what drove the B+ grade
The composite is a weighted blend of 9 inputs, each scored 0–100. Each bar is that input's sub-score; the figure is the points it added to the 100-point composite (weight × sub-score).
- Cash flow +30.0/30.0
- ARV discount +15.0/15.0
- 1% rule +10.0/10.0
- DSCR +10.0/10.0
- Livability +3.3/5.0
- Schools +2.6/10.0
- Rent growth +2.5/5.0
- Condition / age +2.5/5.0
- Appreciation +0.0/10.0
$78,000
🖨 Deal sheet (PDF) 📄 Offer letter ✓ Due diligence
Listing remarks MLS
This 3-bedroom, 2-bath concrete block home features large bedrooms, a spacious family room, and indoor laundry. Enjoy the outdoors on the large deck and fenced yard, perfect for pets and privacy. A great home for comfortable living and entertaining!
Key facts
- Large deck
- Fenced yard
- Indoor laundry
Tags
Neighborhood map
What this means for you Summary
Snapshot
- This is a 3-bed/1.0-bath single-family listed at $78k.
Deal economics
- At list price, monthly cash flow is $657 ($8k/yr) — positive.
- The deal already cash-flows at list — no discount required.
- Meets the 1% rule at list price ($1k rent vs $78k).
- Recommended offer: $69k (12.0% below list) — sets the bar for market timing.
- Cap rate 16.4% vs local median 3.9% in Quincy — top-decile yield for the area; either an underpriced asset or a hidden risk that comps aren't pricing in. Stress-test before assuming the spread holds.
Location & tenants
- Location reads 66/100 on livability (#588 in FL) — a middle-class / working-renter tenant base. Strengths: cost of living A+, health & safety B+; Watch: amenities F, commute F, employment F.
- Gadsden (rural): math 31% / reading 31% proficiency, ranked #70 of 73 in FL (top 96%) — families likely to look elsewhere, expect single-tenant / working-renter base with shorter leases; 83% free/reduced lunch — lower-income household profile, screen leases tightly.
- Market conditions: 117 active listings in the ZIP; 1 comparable units currently listed for rent nearby; 107 units permitted in Gadsden County in 2024 (36 in 5+ unit buildings).
Forward outlook
- Local home prices are declining (-3.0%/yr); year-one equity from $539 of loan paydown is wiped out by about $2k of value loss. Plan a longer hold.
- Gadsden County population projected at -27% by 2050 — secular population decline; favor cash flow + early exit over multi-decade hold.
- At projected returns (-3.0% appreciation + 3.0% rent growth), your $22k cash investment doubles in ~4 years — after that, you're playing with house money.
Negotiation context
- It's been on market 206 days — a 12% lower offer ($69k) is reasonable based on typical stale-listing flexibility.
- 3 sale attempts; this cycle's ask has dropped $22k (22%) from the opening price — seller is motivated, your offer sets the floor, not the list.
Risks & watch-outs
- Climate carrying-cost: severe wind risk, 99% chance of damaging wind over 30y; extreme-heat days projected 7→21/yr by 2055 (HVAC capex compounding) — expect insurance premiums to compound above CPI over the hold.
Questions for the listing agent
- It's been on market 206 days. Have you received any prior offers? Is the seller open to a 12% concession, seller financing, or rate buy-down credit?
- Built in 1967 — when were the roof, HVAC, electrical panel, plumbing, and water heater last replaced?
- Why hasn't it sold? Are there any deal-killer items the seller is aware of (foundation, flood, title, zoning, code violations)?
- Is there a deadline driving the sale (1031 exchange, divorce, estate, relocation)? That informs how much negotiation room exists.
- What's the average days-on-market for RENTAL listings here right now (not sales)? A rising rental-DOM trend means longer vacancies and softer asking-rent achievability than the comps imply.
- What's the recent tenant-quality profile in this submarket — average credit score on applications, eviction rate, late-payment / NSF rate, and stable-employment percentage? A property-management company in the area should have these aggregated.
- How much new for-sale + rental construction is in the pipeline within 1–3 miles? Heavy new supply typically softens prices + rents 12–24 months out; constrained supply supports both.
Investment metrics
- 1% rule
- 1.86% ✓
- Cap rate
- 16.41%
- Cash-on-cash
- 36.12%
- DSCR
- 2.61
- GRM
- 4.5
CMA / ARV
- ARV (median comp)
- $134,232
- List price
- $78,000
- Delta
- -41.89%
- Verdict
- UNDERPRICED
- Comps
- 20 within 1.0 mi
Show comp detail 10 sales within ~0.75 mi
| Address | Dist | Beds/Ba | Sqft | Sold | Price | $/sf | Match |
|---|---|---|---|---|---|---|---|
| 447 S Shelfer St | 0.29mi | 3/2.0 | 1,360 (-6%) | 3mo | $230,000 | $169 | 70 |
| 1224 Stevens St | 0.28mi | 3/2.0 | 1,528 (+6%) | 4mo | $238,000 | $156 | 70 |
| 518 Thomas St | 0.01mi | 3/2.5 | 1,327 (-8%) | 17mo | $245,000 | $185 | 66 |
| 1634 Stevens St | 0.02mi | 4/2.5 (+1) | 1,588 (+10%) | 18mo | $255,000 | $161 | 56 |
| 1520 Hardin St | 0.16mi | 3/1.0 | 1,260 (-12%) | 20mo | $114,500 | $91 | 55 |
| 1310 Osceola St | 0.59mi | 3/2.0 | 1,292 (-10%) | 3mo | $255,000 | $197 | 49 |
| 1127 W Washington St | 0.69mi | 3/2.0 | 1,367 (-5%) | 12mo | $259,000 | $189 | 45 |
| 16 N Virginia St | 0.64mi | 3/2.0 | 1,470 (+2%) | 21mo | $275,000 | $187 | 45 |
| 2034 W Jefferson St | 0.63mi | 3/2.0 | 1,470 (+2%) | 24mo | $285,000 | $194 | 43 |
| 128 N Pittman St | 0.64mi | 3/2.0 | 1,322 (-8%) | 23mo | $262,500 | $199 | 33 |
Match score weights: distance 35% · size 25% · config 20% · recency 20%. Top-matched comps best support the ARV.
Projected returns pro-forma
-3.0% appreciation · 3.0% rent growth · sell at horizon
- IRR
- 31.8%
- Equity multiple
- 2.34×
- Total profit
- $29,216
- Equity at exit
- $11,630
- IRR
- 38.9%
- Equity multiple
- 4.63×
- Total profit
- $79,309
- Equity at exit
- $6,744
Cash invested: $21,840 (down + closing). Projections, not guarantees.
Landlord ↔ Tenant lean methodology
- Overall (STATE)
- 87 Strongly Landlord-Friendly
- State Florida
- 87 Strongly Landlord-Friendly · R+3
- County
- — inherits STATE
- City
- — inherits STATE
ZIP-level market 32351
- Home prices YoY
- -24.6%
- Active inventory
- 117
- Price-to-rent
- 4.5×
Monthly cashflow live
- Estimated rent
- $1,450 medium interval (Pro) →
- Mortgage (P&I)
- −$409
- Tax from tax record
- −$47 /mo · $560/yr
- Insurance
- −$32
- HOA
- −$0
- Vacancy / Maint / Mgmt
- −$304
- Net cashflow
- $657
Break-even live
Sensitivity live
| Price | -10% $701 | -5% $679 | +0% $657 | +5% $635 | +10% $613 |
|---|---|---|---|---|---|
| Rent | -10% $543 | -5% $600 | +0% $657 | +5% $715 | +10% $772 |
| Rate | -1.0pp $697 | -0.5pp $677 | base $657 | +0.5pp $637 | +1.0pp $617 |
UW: 25.0% down · 7.5% · 30yr · 1.5% tax · 5.0% vac · 8.0% maint · 8.0% mgmt
Financing live
Cash to close
- Down payment
- $19,500
- Closing costs
- $2,340
- Reserves months
- —
- Total cash needed
- —
Loan-product check · same deal, 3 products live
Conventional
25% down · 7.5% · 30yr
- Down + closing
- —
- Monthly P&I
- —
- Monthly cashflow
- —
- DSCR
- —
- Eligible?
- —
Personal DTI + credit; lowest rate.
DSCR
20% down · 8.5% · 30yr
- Down + closing
- —
- Monthly P&I
- —
- Monthly cashflow
- —
- DSCR
- —
- Eligible?
- —
No personal income docs; deal must DSCR.
Hard money
10% down · 12.0% · 12mo
- Down + closing
- —
- Monthly P&I
- —
- Monthly cashflow
- —
- DSCR
- —
- Eligible?
- —
Short-term bridge; refi at stabilization.
Rent comps 1 comps
| Address | Beds | Baths | Sqft | Rent | $/sqft | DOM | Units | Dist |
|---|---|---|---|---|---|---|---|---|
| 216 S Jackson St Quincy, FL | 3.0 | 2.0 | 1068 | $1,450 | $1.36 | 15d | 1 | 1.10mi |
Listing history 15 events
-
2026-06-05days on market $78,000 Active 206 DOM
-
2026-06-03days on market $78,000 Active 205 DOM
-
2026-06-02days on market $78,000 Active 204 DOM
-
2026-06-01days on market $78,000 Active 203 DOM
-
2026-05-31days on market $78,000 Active 202 DOM
-
2026-05-30days on market $78,000 Active 201 DOM
-
2026-05-06price $78,000 249-char remark
Show marketing remark (249 chars)
This 3-bedroom, 2-bath concrete block home features large bedrooms, a spacious family room, and indoor laundry. Enjoy the outdoors on the large deck and fenced yard, perfect for pets and privacy. A great home for comfortable living and entertaining!
-
2026-04-28status Active 249-char remark
Show marketing remark (249 chars)
This 3-bedroom, 2-bath concrete block home features large bedrooms, a spacious family room, and indoor laundry. Enjoy the outdoors on the large deck and fenced yard, perfect for pets and privacy. A great home for comfortable living and entertaining!
-
2026-04-28price $90,000 249-char remark
Show marketing remark (249 chars)
This 3-bedroom, 2-bath concrete block home features large bedrooms, a spacious family room, and indoor laundry. Enjoy the outdoors on the large deck and fenced yard, perfect for pets and privacy. A great home for comfortable living and entertaining!
-
2026-03-23historical Active Under Contract 249-char remark
Show marketing remark (249 chars)
This 3-bedroom, 2-bath concrete block home features large bedrooms, a spacious family room, and indoor laundry. Enjoy the outdoors on the large deck and fenced yard, perfect for pets and privacy. A great home for comfortable living and entertaining!
-
2025-11-10$100,000 Active 249-char remark
Show marketing remark (249 chars)
This 3-bedroom, 2-bath concrete block home features large bedrooms, a spacious family room, and indoor laundry. Enjoy the outdoors on the large deck and fenced yard, perfect for pets and privacy. A great home for comfortable living and entertaining!
-
2025-07-22historical
-
2025-05-06price $120,000
-
2025-02-07price $125,000
-
2025-02-07$122,000 Active
ⓘ Source: listings_history table (triggers on properties + properties_extension) + one-shot
backfill from property_details.listing_events for pre-trigger history.
Tax reassessment forecast FL · Resets to sale price
- Current annual tax
- $560 · $47/mo
- Projected year-2 tax
- $647 · $54/mo
- Expected delta
- +$88/yr (+$7/mo · 15.6%)
ⓘ Screening estimate from a state-policy table — verify with the county assessor before closing.
Climate risk First Street
- Flood 1/10 Low FEMA zone X (unshaded) · 0% chance over 30 yrs
- Wildfire 4/10 Moderate
- Heat 8/10 Severe 7 d/yr ≥107°F today · 21 d/yr by 30 yrs out
- Wind 9/10 Extreme 99% chance of damaging wind over 30 yrs
- Air quality 4/10 Moderate 5 unhealthy d/yr today · 6 by 30 yrs out
Nearby sold comps map
Loading sold comps map…
Walkable amenities ~0.75 mi
Loading nearby amenities…
Taxation est. · year 1
- Rental income
- $17,400
- − Mortgage interest
- −$4,369
- − Property taxes
- −$560
- − Insurance
- −$390
- − Repairs & maintenance
- −$1,392
- − Management
- −$1,392
- − Depreciation
- −$2,269
- Taxable income
- $7,028
- Est. tax owed @ 24.0%
- −$1,687
- After-tax cash flow
- $6,201/yr
For passive investors: Depreciation is non-cash, so a rental often shows a tax loss while cash-flowing — sheltering income. Rental losses are passive: they offset passive income freely, and up to $25,000/yr can offset ordinary (W-2) income if you actively participate and your MAGI is under $100k (phasing out to $0 by $150k); unused losses carry forward. On sale, claimed depreciation is recaptured at up to 25%, and gains may owe capital-gains tax (a 1031 exchange can defer both). Figures are a year-1 estimate at your 24.0% rate — not tax advice; consult a CPA.
Schools (NCES district)
- District
- Gadsden
- NCES district ID
- 1200600
- Math proficiency
- 31% ▼ -16.00%
- Reading proficiency
- 31% ▼ -7.00%
- Median HH income
- $36,470
- Composite
- 25.75/100
- National rank
- #7373
- State rank
- #70 of 73 in FL
Livability — Quincy
- Score
- 66/100
- State rank
- #588
- US rank
- #11260
Category grades
Schools grade is shown separately in the Schools card above.
Census & demographics
- Census place
- Quincy, FL
- Population (ZIP)
- 16,808
Population outlook (Gadsden County) Hauer SSP2
- Today (2025)
- 42,956 people
- By 2030
- 40,878 · -4.8%
- By 2040
- 36,218 · -15.7%
- By 2050
- 31,502 · -26.7%
- By 2075
- 21,828 · -49.2%
- By 2100
- 14,480 · -66.3%
Race, ethnicity, and origin ACS 2023
- Neighborhood character
- Diverse neighborhood (Simpson 0.61)
- Race & ethnicity
- Black 54% White 27% Hispanic / Latino 17% Two or more races 5% Native American 2%
- Hispanic origin (detail)
- Mexican 11%
- Common ancestry
- Serbian 1% Slovak 1% Romanian 1%
- Foreign-born
- 8% · Canada
- Languages at home
- 85% English-only · Spanish 14%
Political lean MEDSL · Gadsden
- 2024 margin
- Solid D (+30.7) · D 65.0% · R 34.3%
- 2008→2024 swing
- -8.3pp toward R · 2008: 39.0pp · 2024: 30.7pp
- All cycles
- 2024: D+30.7 2020: D+36.6 2016: D+37.5 2012: D+40.6 2008: D+39.0
Not yet ingested
- Civics
- —
Market trends
- HPI YoY
- ▼ -52.50%
- Current HPI
- 161.1446
- Rent YoY
- —
- Metro
- —
- State GDP YoY
- ▲ 3.28%
- F500 in state
- 36
Industry mix (Fortune 500 HQ in FL)
| Industry | F500 HQs | Revenue |
|---|---|---|
| Industrial Technology | 2 | $29B |
|
||
| Insurance | 2 | $17B |
|
||
| Retail | 1 | $60B |
|
||
| Technology Distribution | 1 | $58B |
|
||
| Homebuilding | 1 | $35B |
|
||
| Technology Manufacturing | 1 | $35B |
|
||
Price history
-36.1% since first listed9 events — show timeline
- 2026-05-06 Price Changed $78,000 CATRS
- 2026-04-28 Relisted — CATRS
- 2026-04-28 Price Changed $90,000 CATRS
- 2026-03-23 Contingent — CATRS
- 2025-11-10 Listed $100,000 CATRS
- 2025-07-22 Listing Removed — CATRS
- 2025-05-06 Price Changed $120,000 CATRS
- 2025-02-07 Price Changed $125,000 CATRS
- 2025-02-07 Listed $122,000 CATRS
Property tax history
+2.1%/yrLatest (2025): $560 · +1.1% YoY. Source: county tax records.
Cash-flow waterfall
monthlySold comps — $/sqft
last 12 mo · ≤1 miLoading sold comps…