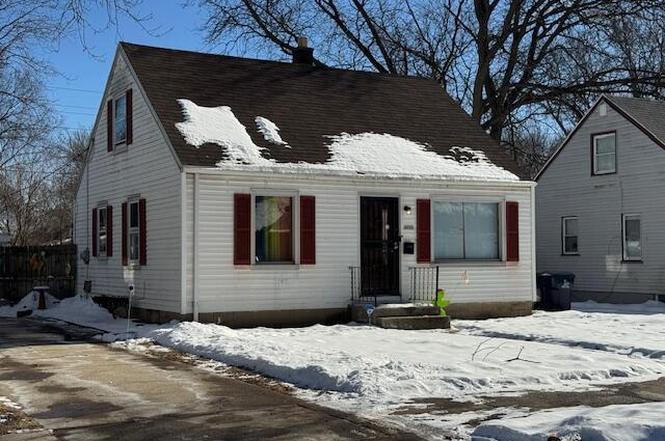
4700 N 45th St · Milwaukee, WI
Flood risk 4/10 · Minor
- FEMA flood zone
- X (shaded)
- Chance of flooding over 30 yrs
- 0.22%
- Est. flood insurance / yr
- $473 – $860
Fire risk 1/10 · Minimal
- Est. fire insurance / yr
- $636 – $1,182
Heat risk 2/10 · Minimal
- Hot days now (above 98°F)
- 7 days/yr
- Hot days in 30 yrs
- 13 days/yr
Wind risk 2/10 · Minimal
- Chance of severe wind over 30 yrs
- —
Air-quality risk 2/10 · Minimal
- Unhealthy air days now
- 2 days/yr
- Unhealthy air days in 30 yrs
- 2 days/yr
Risk factors via First Street. Map © Google.
Why this score? — see what drove the D+ grade
The composite is a weighted blend of 9 inputs, each scored 0–100. Each bar is that input's sub-score; the figure is the points it added to the 100-point composite (weight × sub-score).
- Cash flow +22.9/30.0
- DSCR +7.4/10.0
- 1% rule +6.4/10.0
- Livability +4.0/5.0
- Rent growth +3.8/5.0
- Condition / age +2.5/5.0
- Schools +1.2/10.0
- ARV discount +0.0/15.0
- Appreciation +0.0/10.0
$129,900
🖨 Deal sheet 📄 Offer letter ✓ Due diligence
Listing remarks MLS
Price is substantially below city assessment of $85,700. Sold As Is. Municipal work orders if any are buyers responcibility.
Key facts
- 6,534 sq ft lot
- Garage
- Built 1952
Neighborhood map
What this means for you Summary
Snapshot
- This is a 3-bed/1.0-bath single-family listed at $130k.
Deal economics
- At list price, monthly cash flow is $229 ($3k/yr) — positive.
- The deal already cash-flows at list — no discount required.
- Meets the 1% rule at list price ($1k rent vs $130k).
- Recommended offer: $122k (6.0% below list) — sets the bar for market timing.
- Cap rate 8.4% vs local median 5.1% in Milwaukee — top-decile yield for the area; either an underpriced asset or a hidden risk that comps aren't pricing in. Stress-test before assuming the spread holds.
Location & tenants
- Location reads 81/100 on livability (#55 in WI, #1,534 nationally) — a professional / high-income tenant draw. Strengths: amenities A+, commute A+, cost of living A+; Watch: employment D+, schools F, crime F.
- Milwaukee School District (urban): math 10% / reading 18% proficiency, ranked #337 of 342 in WI (top 98%) — low school quality limits family demand, transient renter base, plan for 1-2y turnover; 77% free/reduced lunch — lower-income household profile, screen leases tightly.
- Market conditions: Rents rising fast (+5.3%/yr); 153 active listings in the ZIP; 27 comparable units currently listed for rent nearby; rentals at typical pace (median 24d on market — plan ~3-4 weeks tenant-placement turnaround); 1,017 units permitted in Milwaukee County in 2024 (803 in 5+ unit buildings).
- This rent runs 39% of the median local income ($46k/yr) — at the standard rent-burdened threshold; future hikes will face affordability resistance.
Forward outlook
- Local home prices are declining (-3.0%/yr); year-one equity from $898 of loan paydown is wiped out by about $4k of value loss. Plan a longer hold.
- Milwaukee County population projected at +4% by 2050 — modest demand growth; plan on rents tracking national, not racing it.
- At projected returns (-3.0% appreciation + 5.3% rent growth), your $36k cash investment doubles in ~10 years — after that, you're playing with house money.
Negotiation context
- It's been on market 78 days — a 6% lower offer ($122k) is reasonable based on typical stale-listing flexibility.
- 2 sale attempts since 13y ago; this cycle's ask has dropped $10k (7%) from the opening price — seller is motivated, your offer sets the floor, not the list.
- Current owner paid $18k; list at $130k implies a 622% gain — meaningful room to come down on a strong offer.
Risks & watch-outs
- Watch-outs: built in 1952 — expect roof / HVAC / electrical / plumbing capex.
Questions for the listing agent
- It's been on market 78 days. Have you received any prior offers? Is the seller open to a 6% concession, seller financing, or rate buy-down credit?
- Built in 1952 — when were the roof, HVAC, electrical panel, plumbing, and water heater last replaced?
- Why hasn't it sold? Are there any deal-killer items the seller is aware of (foundation, flood, title, zoning, code violations)?
- Is there a deadline driving the sale (1031 exchange, divorce, estate, relocation)? That informs how much negotiation room exists.
- Schools are F-rated, which usually means shorter tenancies and higher turnover. Who's the typical renter profile here, and what's been the actual vacancy rate?
- Crime grade is F in this area — have there been break-ins, vandalism, or insurance claims at this property in the last 3 years? What carrier currently insures it and at what premium?
- The area grade is low — what's the realistic commute time and amenity access for the typical tenant pool here? Any planned neighborhood developments (good or bad) we should know about?
- What's the average days-on-market for RENTAL listings here right now (not sales)? A rising rental-DOM trend means longer vacancies and softer asking-rent achievability than the comps imply.
- What's the recent tenant-quality profile in this submarket — average credit score on applications, eviction rate, late-payment / NSF rate, and stable-employment percentage? A property-management company in the area should have these aggregated.
- How much new for-sale + rental construction is in the pipeline within 1–3 miles? Heavy new supply typically softens prices + rents 12–24 months out; constrained supply supports both.
Investment metrics
- 1% rule
- 1.14% ✓
- Cap rate
- 8.41%
- Cash-on-cash
- 7.57%
- DSCR
- 1.34
- GRM
- 7.3
CMA / ARV
- ARV (on-the-fly)
- $110,594
- Comps found
- 12
Show comp detail 12 sales within ~0.75 mi
| Address | Dist | Beds/Ba | Sqft | Sold | Price | $/sf | Match |
|---|---|---|---|---|---|---|---|
| 4430 W Glendale Ave | 0.13mi | 3/1.0 | 908 (-1%) | 0mo | $180,000 | $198 | 93 |
| 4752 N 44th St | 0.10mi | 2/1.0 (-1) | 913 (-0%) | 1mo | $160,000 | $175 | 90 |
| 4941 N Sherman Blvd | 0.34mi | 3/1.0 | 973 (+6%) | 0mo | $110,000 | $113 | 73 |
| 3908 W Hampton Ave | 0.39mi | 3/1.0 | 968 (+6%) | 1mo | $90,000 | $93 | 71 |
| 5003 N 51st Blvd | 0.55mi | 3/1.0 | 934 (+2%) | 0mo | $110,000 | $118 | 70 |
| 4618 W Congress St | 0.37mi | 2/1.0 (-1) | 1,008 (+10%) | 1mo | $81,500 | $81 | 60 |
| 4868 N 52nd St | 0.48mi | 2/1.0 (-1) | 850 (-7%) | 2mo | $145,605 | $171 | 60 |
| 4415 N 36th St | 0.65mi | 2/2.0 (-1) | 944 (+3%) | 2mo | $102,500 | $109 | 54 |
| 4235 W Fairmount Ave | 0.40mi | 3/2.0 | 1,044 (+14%) | 1mo | $150,000 | $144 | 53 |
| 3733 W Fairmount Ave | 0.59mi | 2/1.0 (-1) | 1,000 (+9%) | 1mo | $100,000 | $100 | 51 |
| 4463 N 36th St | 0.62mi | 2/1.0 (-1) | 815 (-11%) | 1mo | $99,000 | $121 | 48 |
| 5243 N 46th St | 0.71mi | 2/1.0 (-1) | 803 (-12%) | 1mo | $135,000 | $168 | 41 |
Match score weights: distance 35% · size 25% · config 20% · recency 20%. Top-matched comps best support the ARV.
Projected returns pro-forma
-3.0% appreciation · 5.29% rent growth · sell at horizon
- IRR
- -2.1%
- Equity multiple
- 0.92×
- Total profit
- $-2,905
- Equity at exit
- $19,369
- IRR
- 10.1%
- Equity multiple
- 1.87×
- Total profit
- $31,490
- Equity at exit
- $11,231
Cash invested: $36,372 (down + closing). Projections, not guarantees.
Landlord ↔ Tenant lean methodology
- Overall (STATE)
- 73 Landlord-Friendly
- State Wisconsin
- 73 Landlord-Friendly · R+2
- County
- — inherits STATE
- City
- — inherits STATE
ZIP-level market 53218
- Home prices YoY
- -19.0%
- Rents YoY
- 5.3%
- Active inventory
- 153
- Price-to-rent
- 7.3×
Monthly cashflow live
- Estimated rent
- $1,481 high interval (Pro) →
- Mortgage (P&I)
- −$681
- Tax from tax record
- −$206 /mo · $2,469/yr
- Insurance
- −$54
- HOA
- −$0
- Vacancy / Maint / Mgmt
- −$311
- Net cashflow
- $229
Break-even live
UW: 25.0% down · 7.5% · 30yr · 1.5% tax · 5.0% vac · 8.0% maint · 8.0% mgmt
Financing live
Cash to close
- Down payment
- $32,475
- Closing costs
- $3,897
- Reserves months
- —
- Total cash needed
- —
Loan-product check · same deal, 3 products live
Conventional
25% down · 7.5% · 30yr
- Down + closing
- —
- Monthly P&I
- —
- Monthly cashflow
- —
- DSCR
- —
- Eligible?
- —
Personal DTI + credit; lowest rate.
DSCR
20% down · 8.5% · 30yr
- Down + closing
- —
- Monthly P&I
- —
- Monthly cashflow
- —
- DSCR
- —
- Eligible?
- —
No personal income docs; deal must DSCR.
Hard money
10% down · 12.0% · 12mo
- Down + closing
- —
- Monthly P&I
- —
- Monthly cashflow
- —
- DSCR
- —
- Eligible?
- —
Short-term bridge; refi at stabilization.
Rent comps 27 comps
| Address | Beds | Baths | Sqft | Rent | $/sqft | DOM | Units | Dist |
|---|---|---|---|---|---|---|---|---|
| 4703 N 45th St Milwaukee, WI | 3.0 | 1.0 | 1031 | $1,695 | $1.64 | 23d | 1 | 0.04mi |
| 4702 N 44th St Milwaukee, WI | 3.0 | 2.0 | 1050 | $1,850 | $1.76 | 43d | 1 | 0.07mi |
| 4727 N 46th St Milwaukee, WI | 3.0 | 1.0 | 936 | $1,700 | $1.82 | 43d | 1 | 0.09mi |
| 4852 N 48th St Unit 4852 Milwaukee, WI | 2.0 | 1.0 | 830 | $995 | $1.20 | 2d | 1 | 0.27mi |
| 4479A N 44th St Milwaukee, WI | 2.0 | 1.0 | 1000 | $895 | $0.90 | 43d | 1 | 0.28mi |
| 4640 N 51st Blvd Milwaukee, WI | 2.0 | 1.0 | 1075 | $1,275 | $1.19 | 43d | 1 | 0.39mi |
| 4661 N 38th St Unit 4661 Milwaukee, WI | 2.0 | 1.0 | 1000 | $845 | $0.84 | 14d | 1 | 0.43mi |
| 5050 N 47th St Milwaukee, WI | 2.0 | 1.0 | 1092 | $1,700 | $1.56 | 43d | 1 | 0.46mi |
| 4572 N 38th St Unit 2 Milwaukee, WI | 2.0 | 1.0 | 600 | $950 | $1.58 | 43d | 1 | 0.48mi |
| 4651 N 36th St #4 Milwaukee, WI | 2.0 | 1.0 | 747 | $945 | $1.27 | 23d | 1 | 0.55mi |
| 4340 W Eggert Pl Milwaukee, WI | 4.0 | 1.0 | 1066 | $1,695 | $1.59 | 23d | 1 | 0.56mi |
| 4334 W Eggert Pl Milwaukee, WI | 4.0 | 1.0 | 1077 | $1,695 | $1.57 | 23d | 1 | 0.56mi |
| 4610 W Eggert Pl #4612 Milwaukee, WI | 3.0 | 1.0 | 852 | $1,095 | $1.29 | 23d | 1 | 0.57mi |
| 5165-5167 N 45th St Unit 5165 Milwaukee, WI | 3.0 | 1.0 | 1020 | $1,200 | $1.18 | 17d | 1 | 0.57mi |
| 5032 N 32nd St Milwaukee, WI | 3.0 | 2.0 | 1089 | $1,750 | $1.61 | 12d | 1 | 0.93mi |
| 5237 N 34th St Unit 5237 Lower Milwaukee, WI | 2.0 | 1.0 | 956 | $1,350 | $1.41 | 23d | 1 | 0.96mi |
| 5435 N 40th St Milwaukee, WI | 2.0 | 1.0 | 850 | $1,150 | $1.35 | 17d | 1 | 0.98mi |
| 3925 N 42nd St Milwaukee, WI | 2.0 | 1.0 | 985 | $1,400 | $1.42 | 23d | 1 | 1.01mi |
| 3890 N Sherman Blvd Milwaukee, WI | 2.0 | 1.0 | 950 | $1,100 | $1.16 | 12d | 1 | 1.05mi |
| 4355 N 28th St Milwaukee, WI | 2.0 | 1.0 | 1118 | $975 | $0.87 | 21d | 1 | 1.14mi |
| 3871-3873 N 36th St Unit 3871 Milwaukee, WI | 2.0 | 1.0 | 987 | $950 | $0.96 | 23d | 1 | 1.19mi |
| 6518 W Hampton Ave Unit 2 Milwaukee, WI | 2.0 | 1.0 | 1100 | $1,200 | $1.09 | 43d | 1 | 1.23mi |
| 5696 N 42nd St Milwaukee, WI | 4.0 | 1.0 | 1023 | $1,495 | $1.46 | 23d | 1 | 1.29mi |
| 4227 N 26th St Milwaukee, WI | 2.0 | 1.0 | 950 | $1,000 | $1.05 | 17d | 1 | 1.34mi |
| 3630 W Nash St Milwaukee, WI | 2.0 | 1.0 | 1000 | $1,200 | $1.20 | 23d | 1 | 1.36mi |
| 3606 N 41st St Unit 3608 Milwaukee, WI | 2.0 | 1.0 | 1095 | $975 | $0.89 | 43d | 1 | 1.38mi |
| 5688 N 56th St Milwaukee, WI | 3.0 | 1.0 | 850 | $1,445 | $1.70 | 12d | 1 | 1.43mi |
Listing history 8 events
-
2026-04-21status Pending
-
2026-03-23price $129,900
-
2026-02-02$139,900 Active
-
2013-01-12$18,000 124-char remark
Show marketing remark (124 chars)
Price is substantially below city assessment of $85,700. Sold As Is. Municipal work orders if any are buyers responcibility.
-
2013-01-12historical 124-char remark
Show marketing remark (124 chars)
Price is substantially below city assessment of $85,700. Sold As Is. Municipal work orders if any are buyers responcibility.
-
2010-11-30soldstatus $18,000 124-char remark
Show marketing remark (124 chars)
Price is substantially below city assessment of $85,700. Sold As Is. Municipal work orders if any are buyers responcibility.
-
2003-06-24soldstatus $58,000
-
1957-05-01soldstatus $16,500
ⓘ Source: listings_history table (triggers on properties + properties_extension) + one-shot
backfill from property_details.listing_events for pre-trigger history.
Tax reassessment forecast WI · Partial reset (capped growth)
- Current annual tax
- $2,469 · $206/mo
- Projected year-2 tax
- $2,469 · $206/mo
- Expected delta
- $0/yr ($0/mo · 0.0%)
ⓘ Screening estimate from a state-policy table — verify with the county assessor before closing.
Climate risk First Street
- Flood 4/10 Moderate FEMA zone X (shaded) · 22% chance over 30 yrs
- Wildfire 1/10 Low
- Heat 2/10 Low 7 d/yr ≥98°F today · 13 d/yr by 30 yrs out
- Wind 2/10 Low
- Air quality 2/10 Low 2 unhealthy d/yr today · 2 by 30 yrs out
Nearby sold comps map
Loading sold comps map…
Walkable amenities ~0.75 mi
Loading nearby amenities…
Taxation est. · year 1
- Rental income
- $17,778
- − Mortgage interest
- −$7,276
- − Property taxes
- −$2,469
- − Insurance
- −$650
- − Repairs & maintenance
- −$1,422
- − Management
- −$1,422
- − Depreciation
- −$3,779
- Taxable income
- $760
- Est. tax owed @ 24.0%
- −$182
- After-tax cash flow
- $2,569/yr
For passive investors: Depreciation is non-cash, so a rental often shows a tax loss while cash-flowing — sheltering income. Rental losses are passive: they offset passive income freely, and up to $25,000/yr can offset ordinary (W-2) income if you actively participate and your MAGI is under $100k (phasing out to $0 by $150k); unused losses carry forward. On sale, claimed depreciation is recaptured at up to 25%, and gains may owe capital-gains tax (a 1031 exchange can defer both). Figures are a year-1 estimate at your 24.0% rate — not tax advice; consult a CPA.
Schools (NCES district)
- District
- Milwaukee School District
- NCES district ID
- 5509600
- Math proficiency
- 10% ▼ -5.00%
- Reading proficiency
- 18% ▬ 0.00%
- Median HH income
- $36,339
- Composite
- 11.61/100
- National rank
- #9696
- State rank
- #337 of 342 in WI
Livability — Milwaukee
- Score
- 81/100
- State rank
- #55
- US rank
- #1534
Category grades
Schools grade is shown separately in the Schools card above.
Census & demographics
- Census place
- Milwaukee, WI
- County
- Milwaukee County · 926,379 people
- City population
- 573,768
- Metro
- Milwaukee-Waukesha, WI
- Population (ZIP)
- 41,196
- Household income
- $45,642
- Rent vs Own
- Severe rent burden
- 2421.0
Population outlook (Milwaukee County) Hauer SSP2
- Today (2025)
- 995,758 people
- By 2030
- 1,009,124 · +1.3%
- By 2040
- 1,028,128 · +3.3%
- By 2050
- 1,040,066 · +4.4%
- By 2075
- 1,057,849 · +6.2%
- By 2100
- 1,039,774 · +4.4%
Race, ethnicity, and origin ACS 2023
- Neighborhood character
- Predominantly Black (72%)
- Race & ethnicity
- Black 72% Asian 10% White 10% Hispanic / Latino 5% Two or more races 3%
- Common ancestry
- Romanian 1% Lithuanian 1%
- Foreign-born
- 6% · Philippines, Canada
- Languages at home
- 89% English-only · Other Asian/Pacific 7% Spanish 3%
Political lean MEDSL · Milwaukee
- 2024 margin
- Solid D (+38.5) · D 68.3% · R 29.8% · Other 1.8%
- 2008→2024 swing
- +2.7pp toward D · 2008: 35.9pp · 2024: 38.5pp
- All cycles
- 2024: D+38.5 2020: D+39.9 2016: D+37.5 2012: D+34.6 2008: D+35.9
Not yet ingested
- Civics
- —
Market trends
- HPI YoY
- ▼ -76.44%
- Current HPI
- 325.1975
- Rent YoY
- ▲ 5.29%
- Metro
- Milwaukee-Waukesha, WI
- State GDP YoY
- ▲ 2.10%
- F500 in state
- 20
Industry mix (Fortune 500 HQ in WI)
| Industry | F500 HQs | Revenue |
|---|---|---|
| Industrial Machinery | 4 | $23B |
|
||
| Industrial Technology | 2 | $36B |
|
||
| Insurance | 1 | $36B |
|
||
| Professional Services | 1 | $19B |
|
||
| Utilities | 1 | $9B |
|
||
| Consumer Goods | 1 | $3B |
|
||
Price history
+687.3% since first listed8 events — show timeline
- 2026-04-21 Pending — METROMLS
- 2026-03-23 Price Changed $129,900 METROMLS
- 2026-02-02 Listed $139,900 METROMLS
- 2013-01-12 Listing Removed — METROMLS
- 2013-01-12 Listed $18,000 METROMLS
- 2010-11-30 Sold (MLS) $18,000 METROMLS
- 2003-06-24 Sold (Public Records) $58,000 Public Records
- 1957-05-01 Sold (Public Records) $16,500 Public Records
Property tax history
+4.3%/yrLatest (2024): $2,469 · +16.4% YoY. Source: county tax records.
Cash-flow waterfall
monthlySold comps — $/sqft
last 12 mo · ≤1 miLoading sold comps…