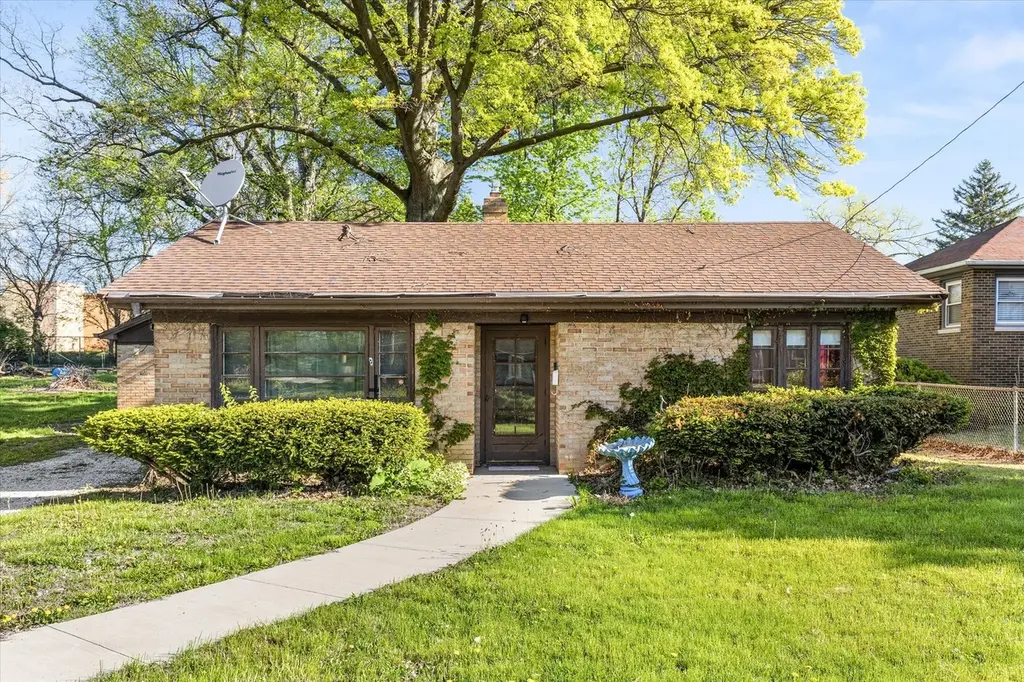
210 E 1st St · Streator, IL
Flood risk 3/10 · Minor
- FEMA flood zone
- X (unshaded)
- Chance of flooding over 30 yrs
- 0.2%
- Est. flood insurance / yr
- $473 – $860
Fire risk 1/10 · Minimal
- Est. fire insurance / yr
- $804 – $1,492
Heat risk 3/10 · Minor
- Hot days now (above 104°F)
- 7 days/yr
- Hot days in 30 yrs
- 17 days/yr
Wind risk 2/10 · Minimal
- Chance of severe wind over 30 yrs
- 1.0%
Air-quality risk 2/10 · Minimal
- Unhealthy air days now
- 1 days/yr
- Unhealthy air days in 30 yrs
- 1 days/yr
Risk factors via First Street. Map © Google.
Why this score? — see what drove the B- grade
The composite is a weighted blend of 9 inputs, each scored 0–100. Each bar is that input's sub-score; the figure is the points it added to the 100-point composite (weight × sub-score).
- Cash flow +30.0/30.0
- 1% rule +10.0/10.0
- DSCR +10.0/10.0
- ARV discount +7.5/15.0
- Livability +3.2/5.0
- Rent growth +2.5/5.0
- Condition / age +2.5/5.0
- Schools +1.3/10.0
- Appreciation +0.0/10.0
$82,000
🖨 Deal sheet (PDF) 📄 Offer letter ✓ Due diligence
Listing remarks
Opportunity awaits with this all brick, 2-bedroom, 1-bath home featuring a 1-car garage and plenty of potential! Whether you're looking to roll up your sleeves and create your dream space or add a solid investment to your portfolio, this property is ready for your vision. With good bones and a functional layout, it's the perfect canvas to update, renovate, and truly make your own. Ideal for investors, flippers, or buyers looking for a project-don't miss the chance to unlock its full potential!
Key facts
- Garage
- Built 1950
- Listed 5 days
Property features AI
Finance
- HOA & community: No master association fee required
Exterior
- Parking: Detached garage (gravel), garage owned — total 1 garage/parking space
- Utilities: Public water; Public sewer
- Home design: Detached single-family home; One-story
- Construction: Brick construction; Asphalt roof; Built approximately 71–80 years ago; Property built before 1978
- Exterior features: Lot dimensions approximately 140 x 60 x 140 x 59; Less than 0.25 acre lot
Interior
- Kitchen: Kitchen with hardwood flooring; Range; Refrigerator
- Bedrooms: Main-level master bedroom (carpeted); Main-level additional bedroom (10 x 9, carpeted); Two additional bedrooms listed
- Flooring: Carpet in living areas and bedrooms; Hardwood in kitchen
- Bathrooms: One full bathroom
- Heating & cooling: Forced air heating; Central air conditioning
- Interior features: Four total rooms; School bus service available
- Laundry & utility: Laundry room; Washer; Dryer
Neighborhood map
What this means for you Summary
Snapshot
- This is a 2-bed/1.0-bath single-family listed at $82k.
Deal economics
- At list price, monthly cash flow is $407 ($5k/yr) — positive.
- The deal already cash-flows at list — no discount required.
- Meets the 1% rule at list price ($1k rent vs $82k).
- Cap rate 12.3% vs local median 7.8% in Streator — top-decile yield for the area; either an underpriced asset or a hidden risk that comps aren't pricing in. Stress-test before assuming the spread holds.
Location & tenants
- Location reads 63/100 on livability (#752 in IL) — a middle-class / working-renter tenant base. Strengths: cost of living A+, health & safety A+, housing B+; Watch: amenities F, commute F, employment F.
- Streator Twp Hsd 40 (town): math 11% / reading 19% proficiency, ranked #513 of 620 in IL (top 83%) — low school quality limits family demand, transient renter base, plan for 1-2y turnover.
- Zoned schools: Centennial Elem School (math 13% / reading 20%, grade F, #1,224 of 2,056 statewide, top 60%, 470 students, 0% FRL); Northlawn Jr High School (math 7% / reading 14%, grade F, #580 of 665 statewide, top 88%, 617 students, 0% FRL); Streator Twp High School (math 11% / reading 19%, grade F, #462 of 693 statewide, top 68%, 809 students, 0% FRL).
- Market conditions: 85 active listings in the ZIP; 2 comparable units currently listed for rent nearby; 82 units permitted in LaSalle County in 2024 (0 in 5+ unit buildings).
Forward outlook
- Local home prices are declining (-3.0%/yr); year-one equity from $567 of loan paydown is wiped out by about $2k of value loss. Plan a longer hold.
- LaSalle County population projected at -16% by 2050 — secular population decline; favor cash flow + early exit over multi-decade hold.
- At projected returns (-3.0% appreciation + 3.0% rent growth), your $23k cash investment doubles in ~6 years — after that, you're playing with house money.
Negotiation context
- Only 5 days on market — expect competitive offers; lowballing is unlikely to land.
Risks & watch-outs
- Watch-outs: property tax is 2.9% of price; built in 1950 — expect roof / HVAC / electrical / plumbing capex.
Questions for the listing agent
- Built in 1950 — when were the roof, HVAC, electrical panel, plumbing, and water heater last replaced?
- Property tax is high relative to price — has the assessment been appealed recently, and will the sale trigger a re-assessment?
- Is there a deadline driving the sale (1031 exchange, divorce, estate, relocation)? That informs how much negotiation room exists.
- Schools are F-rated, which usually means shorter tenancies and higher turnover. Who's the typical renter profile here, and what's been the actual vacancy rate?
- What's the average days-on-market for RENTAL listings here right now (not sales)? A rising rental-DOM trend means longer vacancies and softer asking-rent achievability than the comps imply.
- What's the recent tenant-quality profile in this submarket — average credit score on applications, eviction rate, late-payment / NSF rate, and stable-employment percentage? A property-management company in the area should have these aggregated.
- How much new for-sale + rental construction is in the pipeline within 1–3 miles? Heavy new supply typically softens prices + rents 12–24 months out; constrained supply supports both.
Investment metrics
- 1% rule
- 1.65% ✓
- Cap rate
- 12.25%
- Cash-on-cash
- 21.28%
- DSCR
- 1.95
- GRM
- 5.1
CMA / ARV
- ARV (on-the-fly)
- $82,008
- Comps found
- 9
Show comp detail 9 sales within ~0.75 mi
| Address | Dist | Beds/Ba | Sqft | Sold | Price | $/sf | Match |
|---|---|---|---|---|---|---|---|
| 210 E 1st St | 0.00mi | 2/1.0 | 804 (0%) | 0mo | $82,000 | $102 | 100 |
| 1204 N Park St | 0.19mi | 2/1.0 | 800 (-0%) | 10mo | $88,000 | $110 | 82 |
| 1311 N Sterling St | 0.17mi | 1/1.0 (-1) | 840 (+4%) | 15mo | $79,000 | $94 | 68 |
| 1006 N Vermillion St | 0.32mi | 2/1.0 | 762 (-5%) | 20mo | $110,000 | $144 | 60 |
| 1102 E Bronson St | 0.69mi | 2/1.0 | 788 (-2%) | 14mo | $102,500 | $130 | 53 |
| 608 E Bronson St | 0.34mi | 2/2.0 | 888 (+10%) | 13mo | $162,500 | $183 | 52 |
| 602 N Monroe St | 0.65mi | 2/1.0 | 750 (-7%) | 12mo | $45,000 | $60 | 49 |
| 511 W Boys St | 0.56mi | 2/1.0 | 700 (-13%) | 6mo | $68,250 | $98 | 47 |
| 613 Boys St | 0.63mi | 2/1.0 | 864 (+8%) | 18mo | $75,000 | $87 | 43 |
Match score weights: distance 35% · size 25% · config 20% · recency 20%. Top-matched comps best support the ARV.
Projected returns pro-forma
-3.0% appreciation · 3.0% rent growth · sell at horizon
- IRR
- 13.9%
- Equity multiple
- 1.55×
- Total profit
- $12,728
- Equity at exit
- $12,226
- IRR
- 22.7%
- Equity multiple
- 2.95×
- Total profit
- $44,800
- Equity at exit
- $7,090
Cash invested: $22,960 (down + closing). Projections, not guarantees.
Landlord ↔ Tenant lean methodology
- Overall (STATE)
- 43 Moderately Tenant-Leaning
- State Illinois
- 43 Moderately Tenant-Leaning · D+7
- County
- — inherits STATE
- City
- — inherits STATE
ZIP-level market 61364
- Home prices YoY
- -31.1%
- Active inventory
- 85
- Price-to-rent
- 5.1×
Monthly cashflow live
- Estimated rent
- $1,352 medium interval (Pro) →
- Mortgage (P&I)
- −$430
- Tax from tax record
- −$196 /mo · $2,355/yr
- Insurance
- −$34
- HOA
- −$0
- Lot rent
- −$0
- Vacancy / Maint / Mgmt
- −$284
- Net cashflow
- $407
Break-even live
Sensitivity live
| Price | -10% $454 | -5% $430 | +0% $407 | +5% $384 | +10% $361 |
|---|---|---|---|---|---|
| Rent | -10% $300 | -5% $354 | +0% $407 | +5% $461 | +10% $514 |
| Rate | -1.0pp $449 | -0.5pp $428 | base $407 | +0.5pp $386 | +1.0pp $364 |
UW: 25.0% down · 7.5% · 30yr · 1.5% tax · 5.0% vac · 8.0% maint · 8.0% mgmt
Financing live
Cash to close
- Down payment
- $20,500
- Closing costs
- $2,460
- Reserves months
- —
- Total cash needed
- —
Loan-product check · same deal, 3 products live
Conventional
25% down · 7.5% · 30yr
- Down + closing
- —
- Monthly P&I
- —
- Monthly cashflow
- —
- DSCR
- —
- Eligible?
- —
Personal DTI + credit; lowest rate.
DSCR
20% down · 8.5% · 30yr
- Down + closing
- —
- Monthly P&I
- —
- Monthly cashflow
- —
- DSCR
- —
- Eligible?
- —
No personal income docs; deal must DSCR.
Hard money
10% down · 12.0% · 12mo
- Down + closing
- —
- Monthly P&I
- —
- Monthly cashflow
- —
- DSCR
- —
- Eligible?
- —
Short-term bridge; refi at stabilization.
Rent comps 2 comps
| Address | Beds | Baths | Sqft | Rent | $/sqft | DOM | Units | Dist |
|---|---|---|---|---|---|---|---|---|
| 402 S Illinois St Streator, IL | 2.0 | 1.0 | 1116 | $1,550 | $1.39 | 24d | 1 | 1.40mi |
| 402 S Illinois St Streator, IL | 2.0 | 1.0 | 1116 | $1,550 | $1.39 | 0d | 1 | 1.40mi |
Listing history 2 events
-
2026-05-05status Pending
-
2026-04-30$82,000 Active
ⓘ Source: listings_history table (triggers on properties + properties_extension) + one-shot
backfill from property_details.listing_events for pre-trigger history.
Tax reassessment forecast IL · Partial reset (capped growth)
- Current annual tax
- $2,355 · $196/mo
- Projected year-2 tax
- $2,355 · $196/mo
- Expected delta
- $0/yr ($0/mo · 0.0%)
ⓘ Screening estimate from a state-policy table — verify with the county assessor before closing.
Climate risk First Street
- Flood 3/10 Moderate FEMA zone X (unshaded) · 20% chance over 30 yrs
- Wildfire 1/10 Low
- Heat 3/10 Moderate 7 d/yr ≥104°F today · 17 d/yr by 30 yrs out
- Wind 2/10 Low 100% chance of damaging wind over 30 yrs
- Air quality 2/10 Low 1 unhealthy d/yr today · 1 by 30 yrs out
Nearby sold comps map
Loading sold comps map…
Walkable amenities ~0.75 mi
Loading nearby amenities…
Taxation est. · year 1
- Rental income
- $16,218
- − Mortgage interest
- −$4,593
- − Property taxes
- −$2,355
- − Insurance
- −$410
- − Repairs & maintenance
- −$1,297
- − Management
- −$1,297
- − Depreciation
- −$2,385
- Taxable income
- $3,879
- Est. tax owed @ 24.0%
- −$931
- After-tax cash flow
- $3,956/yr
For passive investors: Depreciation is non-cash, so a rental often shows a tax loss while cash-flowing — sheltering income. Rental losses are passive: they offset passive income freely, and up to $25,000/yr can offset ordinary (W-2) income if you actively participate and your MAGI is under $100k (phasing out to $0 by $150k); unused losses carry forward. On sale, claimed depreciation is recaptured at up to 25%, and gains may owe capital-gains tax (a 1031 exchange can defer both). Figures are a year-1 estimate at your 24.0% rate — not tax advice; consult a CPA.
Schools (NCES district)
- District
- Streator Twp Hsd 40
- NCES district ID
- 1738100
- Math proficiency
- 11% ▼ -4.00%
- Reading proficiency
- 19% ▼ -1.00%
- Median HH income
- $43,002
- Composite
- 13.07/100
- National rank
- #9561
- State rank
- #513 of 620 in IL
Livability — Streator
- Score
- 63/100
- State rank
- #752
- US rank
- #15266
Category grades
Schools grade is shown separately in the Schools card above.
Census & demographics
- Census place
- Streator, IL
- County
- La Salle County · 41,676 people
- City population
- 17,963
- Metro
- Ottawa, IL
- Population (ZIP)
- 17,963
- Household income
- $59,060
- Rent vs Own
- Severe rent burden
- 450.0
Population outlook (LaSalle County) Hauer SSP2
- Today (2025)
- 107,080 people
- By 2030
- 104,196 · -2.7%
- By 2040
- 97,413 · -9.0%
- By 2050
- 90,294 · -15.7%
- By 2075
- 76,252 · -28.8%
- By 2100
- 61,339 · -42.7%
Race, ethnicity, and origin ACS 2023
- Neighborhood character
- Predominantly White (83%)
- Race & ethnicity
- White 83% Hispanic / Latino 11% Two or more races 4% Black 3%
- Hispanic origin (detail)
- Mexican 10%
- Common ancestry
- Romanian 3% Lithuanian 2% Slovak 2%
- Foreign-born
- 3% · Canada
- Languages at home
- 93% English-only · Spanish 6%
Political lean MEDSL · LaSalle
- 2024 margin
- R (+18.5) · D 40.1% · R 58.6% · Other 1.3%
- 2008→2024 swing
- -29.6pp toward R · 2008: 11.1pp · 2024: -18.5pp
- All cycles
- 2024: R+18.5 2020: R+14.3 2016: R+14.4 2012: R+0.4 2008: D+11.1
Not yet ingested
- Civics
- —
Market trends
- HPI YoY
- ▼ -105.28%
- Current HPI
- 233.5533
- Rent YoY
- —
- Metro
- Ottawa, IL
- State GDP YoY
- ▲ 1.59%
- F500 in state
- 60
Industry mix (Fortune 500 HQ in IL)
| Industry | F500 HQs | Revenue |
|---|---|---|
| Insurance | 4 | $201B |
|
||
| Consumer Goods | 4 | $87B |
|
||
| Industrial Machinery | 3 | $64B |
|
||
| Healthcare | 2 | $55B |
|
||
| Retail / Pharmacy | 1 | $148B |
|
||
| Agriculture / Food | 1 | $86B |
|
||
Price history
2 events — show timeline
- 2026-05-05 Pending — MRED as Distributed by MLS Grid
- 2026-04-30 Listed $82,000 MRED as Distributed by MLS Grid
Property tax history
+2.6%/yrLatest (2024): $2,355 · +8.1% YoY. Source: county tax records.
Cash-flow waterfall
monthlySold comps — $/sqft
last 12 mo · ≤1 miLoading sold comps…