 🏗️ New Construction
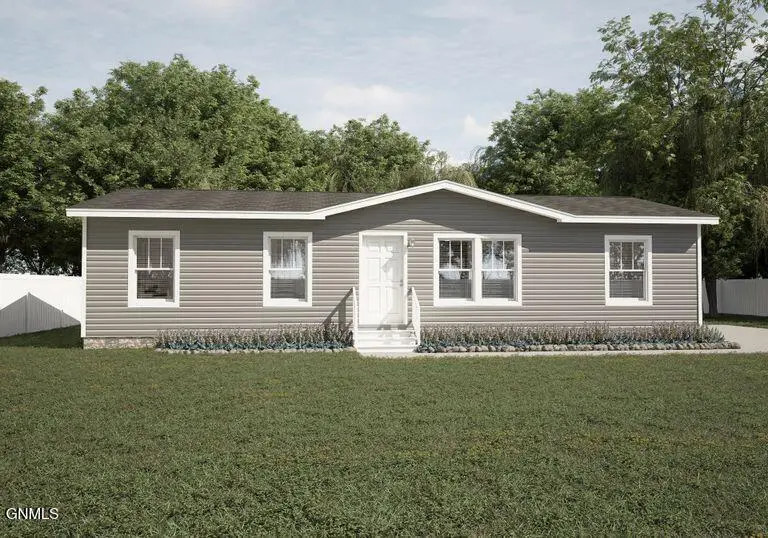
123 West Coyote St · Mandan, ND
Flood risk 1/10 · Minimal
- FEMA flood zone
- X (shaded)
- Chance of flooding over 30 yrs
- 0.0%
- Est. flood insurance / yr
- $507 – $1,088
Fire risk 4/10 · Minor
- Est. fire insurance / yr
- $1,289 – $2,393
Heat risk 2/10 · Minimal
- Hot days now (above 97°F)
- 7 days/yr
- Hot days in 30 yrs
- 12 days/yr
Wind risk 2/10 · Minimal
- Chance of severe wind over 30 yrs
- —
Air-quality risk 4/10 · Minor
- Unhealthy air days now
- 4 days/yr
- Unhealthy air days in 30 yrs
- 4 days/yr
Risk factors via First Street. Map © Google.
Why this score? — see what drove the B grade
The composite is a weighted blend of 9 inputs, each scored 0–100. Each bar is that input's sub-score; the figure is the points it added to the 100-point composite (weight × sub-score).
- Cash flow +30.0/30.0
- 1% rule +10.0/10.0
- DSCR +10.0/10.0
- ARV discount +7.5/15.0
- Rent growth +5.0/5.0
- Condition / age +5.0/5.0
- Livability +3.5/5.0
- Schools +3.3/10.0
- Appreciation +0.0/10.0
$130,000
🖨 Deal sheet 📄 Offer letter ✓ Due diligence
Key facts
- Central heat
- Zero maintenance
- 3,354 sq ft lot
Tags
Property features AI
Finance
- HOA & community: Located in Gateway Mobile Home Park
Exterior
- Parking: No designated parking
- Utilities: Public water; Public sewer
- Home design: Manufactured home (single wide); Residential property; New construction
- Construction: Built with other materials; 1,248 above-grade finished area
- Exterior features: No notable exterior features listed
Interior
- Kitchen: Dishwasher; Range; Refrigerator
- Bathrooms: 2 full bathrooms
- Heating & cooling: Central air conditioning; Electric heating
- Interior features: Dishwasher; Range; Refrigerator; No basement
Neighborhood map
What this means for you Summary
Snapshot
- This is a 4-bed/2.0-bath manufactured listed at $130k. Condition is rated excellent.
Deal economics
- At list price, monthly cash flow is $712 ($9k/yr) — positive.
- The deal already cash-flows at list — no discount required.
- Meets the 1% rule at list price ($2k rent vs $130k).
- Cap rate 16.2% vs local median 2.7% in Mandan — top-decile yield for the area; either an underpriced asset or a hidden risk that comps aren't pricing in. Stress-test before assuming the spread holds.
Location & tenants
- Location reads 70/100 on livability (#76 in ND) — a middle-class / working-renter tenant base. Strengths: cost of living A+, housing A+, employment A; Watch: crime C-, amenities F, commute F.
- Mandan 1 (suburban): math 35% / reading 38% proficiency, ranked #32 of 53 in ND (top 60%) — families likely to look elsewhere, expect single-tenant / working-renter base with shorter leases.
- Zoned schools: Mandan Middle School (math 36% / reading 40%, grade F, #21 of 35 statewide, top 59%, 928 students, 30% FRL); Mandan High School (math 18% / reading 42%, grade F, #90 of 144 statewide, top 66%, 1,138 students, 25% FRL) — zoned schools at 28% FRL track the district average.
- Market conditions: Rents rising fast (+14.0%/yr); 304 active listings in the ZIP; 1 comparable units currently listed for rent nearby; solid renter incomes; 94 units permitted in Morton County in 2024 (5 in 5+ unit buildings).
Forward outlook
- Local home prices are declining (-3.0%/yr); year-one equity from $595 of loan paydown is wiped out by about $3k of value loss. Plan a longer hold.
- Morton County population projected at +48% by 2050 — long-run rental-demand tailwind backs the buy-and-hold thesis.
- At projected returns (-3.0% appreciation + 8.0% rent growth), your $24k cash investment doubles in ~4 years — after that, you're playing with house money.
Negotiation context
- Only 6 days on market — expect competitive offers; lowballing is unlikely to land.
Questions for the listing agent
- Is there a deadline driving the sale (1031 exchange, divorce, estate, relocation)? That informs how much negotiation room exists.
- What's the average days-on-market for RENTAL listings here right now (not sales)? A rising rental-DOM trend means longer vacancies and softer asking-rent achievability than the comps imply.
- What's the recent tenant-quality profile in this submarket — average credit score on applications, eviction rate, late-payment / NSF rate, and stable-employment percentage? A property-management company in the area should have these aggregated.
- How much new for-sale + rental construction is in the pipeline within 1–3 miles? Heavy new supply typically softens prices + rents 12–24 months out; constrained supply supports both.
Investment metrics
- 1% rule
- 1.92% ✓
- Cap rate
- 16.21%
- Cash-on-cash
- 35.43%
- DSCR
- 2.58
- GRM
- 4.3
CMA / ARV
- ARV (on-the-fly)
- $86,112
- Comps found
- 12
Show comp detail 12 sales within ~0.75 mi
| Address | Dist | Beds/Ba | Sqft | Sold | Price | $/sf | Match |
|---|---|---|---|---|---|---|---|
| 203 E Deer St | 0.10mi | 3/2.0 (-1) | 1,250 (+0%) | 1mo | $35,000 | $28 | 89 |
| 403 E Prairie Ln | 0.17mi | 3/2.0 (-1) | 1,216 (-3%) | 3mo | $65,000 | $53 | 80 |
| 213 S Prairie Ln | 0.14mi | 3/2.0 (-1) | 1,216 (-3%) | 7mo | $69,000 | $57 | 78 |
| 185 South Prairie Ln | 0.18mi | 3/2.0 (-1) | 1,280 (+3%) | 9mo | $70,000 | $55 | 75 |
| 229 Prairie Ln | 0.17mi | 3/2.0 (-1) | 1,216 (-3%) | 10mo | $29,900 | $25 | 75 |
| 102 Deer St | 0.09mi | 3/2.0 (-1) | 1,140 (-9%) | 8mo | $79,000 | $69 | 70 |
| 104 Deer St | 0.08mi | 3/2.0 (-1) | 1,140 (-9%) | 9mo | $79,000 | $69 | 70 |
| 105 Deer St | 0.10mi | 3/2.0 (-1) | 1,140 (-9%) | 10mo | $79,000 | $69 | 67 |
| 1217 9th Ave SE | 0.58mi | 3/2.0 (-1) | 1,280 (+3%) | 2mo | $217,500 | $170 | 62 |
| 703 6th Ave SE Unit C16 | 0.29mi | 3/1.0 (-1) | 1,140 (-9%) | 7mo | $79,999 | $70 | 57 |
| 105 Gateway Trl | 0.72mi | 3/2.0 (-1) | 1,280 (+3%) | 3mo | $30,000 | $23 | 55 |
| 1208 7th Ave SE | 0.51mi | 3/1.0 (-1) | 1,320 (+6%) | 7mo | $145,000 | $110 | 51 |
Match score weights: distance 35% · size 25% · config 20% · recency 20%. Top-matched comps best support the ARV.
Projected returns pro-forma
-3.0% appreciation · 8.0% rent growth · sell at horizon
- IRR
- 36.6%
- Equity multiple
- 2.67×
- Total profit
- $40,162
- Equity at exit
- $12,840
- IRR
- 45.8%
- Equity multiple
- 6.53×
- Total profit
- $133,262
- Equity at exit
- $7,445
Cash invested: $24,111 (down + closing). Projections, not guarantees.
Landlord ↔ Tenant lean methodology
- Overall (STATE)
- 82 Strongly Landlord-Friendly
- State North Dakota
- 82 Strongly Landlord-Friendly · R+20
- County
- — inherits STATE
- City
- — inherits STATE
ZIP-level market 58554
- Rents YoY
- 14.0%
- Active inventory
- 304
- Price-to-rent
- 6.5×
Monthly cashflow live
- Estimated rent
- $1,655 medium interval (Pro) →
- Mortgage (P&I)
- −$452
- Tax est. 1.5%
- −$108 /mo · $1,292/yr
- Insurance
- −$36
- HOA
- −$0
- Vacancy / Maint / Mgmt
- −$347
- Net cashflow
- $712
Break-even live
UW: 25.0% down · 7.5% · 30yr · 1.5% tax · 5.0% vac · 8.0% maint · 8.0% mgmt
Financing live
Cash to close
- Down payment
- $21,528
- Closing costs
- $2,583
- Reserves months
- —
- Total cash needed
- —
Loan-product check · same deal, 3 products live
Conventional
25% down · 7.5% · 30yr
- Down + closing
- —
- Monthly P&I
- —
- Monthly cashflow
- —
- DSCR
- —
- Eligible?
- —
Personal DTI + credit; lowest rate.
DSCR
20% down · 8.5% · 30yr
- Down + closing
- —
- Monthly P&I
- —
- Monthly cashflow
- —
- DSCR
- —
- Eligible?
- —
No personal income docs; deal must DSCR.
Hard money
10% down · 12.0% · 12mo
- Down + closing
- —
- Monthly P&I
- —
- Monthly cashflow
- —
- DSCR
- —
- Eligible?
- —
Short-term bridge; refi at stabilization.
Rent comps 1 comps
| Address | Beds | Baths | Sqft | Rent | $/sqft | DOM | Units | Dist |
|---|---|---|---|---|---|---|---|---|
| 406 4th St NW Mandan, ND | 3.0 | 1.5 | 1208 | $1,200 | $0.99 | 21d | 1 | 0.86mi |
Listing history 1 events
-
2026-05-20$130,000 Active
ⓘ Source: listings_history table (triggers on properties + properties_extension) + one-shot
backfill from property_details.listing_events for pre-trigger history.
Climate risk First Street
- Flood 1/10 Low FEMA zone X (shaded) · 0% chance over 30 yrs
- Wildfire 4/10 Moderate
- Heat 2/10 Low 7 d/yr ≥97°F today · 12 d/yr by 30 yrs out
- Wind 2/10 Low
- Air quality 4/10 Moderate 4 unhealthy d/yr today · 4 by 30 yrs out
Nearby sold comps map
Loading sold comps map…
Walkable amenities ~0.75 mi
Loading nearby amenities…
Taxation est. · year 1
- Rental income
- $19,854
- − Mortgage interest
- −$4,824
- − Property taxes
- −$1,292
- − Insurance
- −$431
- − Repairs & maintenance
- −$1,588
- − Management
- −$1,588
- − Depreciation
- −$2,505
- Taxable income
- $7,627
- Est. tax owed @ 24.0%
- −$1,830
- After-tax cash flow
- $6,713/yr
For passive investors: Depreciation is non-cash, so a rental often shows a tax loss while cash-flowing — sheltering income. Rental losses are passive: they offset passive income freely, and up to $25,000/yr can offset ordinary (W-2) income if you actively participate and your MAGI is under $100k (phasing out to $0 by $150k); unused losses carry forward. On sale, claimed depreciation is recaptured at up to 25%, and gains may owe capital-gains tax (a 1031 exchange can defer both). Figures are a year-1 estimate at your 24.0% rate — not tax advice; consult a CPA.
Condition & rehab AI · 1 photo
This home is in excellent condition with no visible repairs or maintenance needed. It is move-in ready and would benefit from some cosmetic updates to enhance its curb appeal and interior aesthetics.
Value-add opportunities
- Both Painting the exterior and interior walls — Fresh paint can enhance the curb appeal and interior aesthetics.
- Both Landscaping improvements — Enhanced landscaping can improve the home's curb appeal and attract more potential buyers or renters.
- Both Upgrading the HVAC system — A modern HVAC system can improve comfort and energy efficiency, making the home more attractive to buyers and renters.
- Both Adding smart home features — Smart home features can increase the home's value by making it more convenient and energy-efficient for potential buyers and renters.
- Both Upgrading the kitchen and bathrooms — Modernizing the kitchen and bathrooms can significantly increase the home's value by making it more appealing to a wider range of buyers and renters.
Renovation cost estimate screening
Value-add ROI direction
- Both Painting the exterior and interior walls — Fresh paint can enhance the curb appeal and interior aesthetics. ↑
- Both Landscaping improvements — Enhanced landscaping can improve the home's curb appeal and attract more potential buyers or renters. ↑
- Both Upgrading the HVAC system — A modern HVAC system can improve comfort and energy efficiency, making the home more attractive to buyers and renters. ↑
- Both Adding smart home features — Smart home features can increase the home's value by making it more convenient and energy-efficient for potential buyers and renters. ↑
- Both Upgrading the kitchen and bathrooms — Modernizing the kitchen and bathrooms can significantly increase the home's value by making it more appealing to a wider range of buyers and renters. ↑
ⓘ Cost ranges are severity-bucket heuristics (US national rule-of-thumb). Get contractor quotes + a written scope before underwriting a rehab budget.
Schools (NCES district)
- District
- Mandan 1
- NCES district ID
- 3811820
- Math proficiency
- 35% ▼ -11.00%
- Reading proficiency
- 38% ▼ -5.00%
- Median HH income
- $60,131
- Composite
- 32.55/100
- National rank
- #5692
- State rank
- #32 of 53 in ND
Livability — Mandan
- Score
- 70/100
- State rank
- #76
- US rank
- #7567
Category grades
Schools grade is shown separately in the Schools card above.
Census & demographics
- Census place
- Mandan, ND
- County
- Morton County · 29,479 people
- City population
- 29,479
- Metro
- Bismarck, ND
- Population (ZIP)
- 29,479
- Household income
- $80,120
- Rent vs Own
- Severe rent burden
- 915.0
Population outlook (Morton County) Hauer SSP2
- Today (2025)
- 36,682 people
- By 2030
- 39,967 · +9.0%
- By 2040
- 46,921 · +27.9%
- By 2050
- 54,157 · +47.6%
- By 2075
- 73,661 · +100.8%
- By 2100
- 89,885 · +145.0%
Race, ethnicity, and origin ACS 2023
- Neighborhood character
- Predominantly White (87%)
- Race & ethnicity
- White 87% Hispanic / Latino 5% Native American 4% Two or more races 4% Black 2%
- Common ancestry
- Portuguese 14% Scotch-Irish 4% Iranian 2%
- Foreign-born
- 1% · Canada
- Languages at home
- 95% English-only · Spanish 3% German/W. Germanic 1%
Political lean MEDSL · Morton
- 2024 margin
- Solid R (+53.8) · D 22.2% · R 75.9% · Other 1.9%
- 2008→2024 swing
- -32.7pp toward R · 2008: -21.0pp · 2024: -53.8pp
- All cycles
- 2024: R+53.8 2020: R+50.4 2016: R+53.0 2012: R+31.1 2008: R+21.0
Not yet ingested
- Civics
- —
Market trends
- HPI YoY
- ▼ -161.81%
- Current HPI
- 137.8984
- Rent YoY
- ▲ 14.00%
- Metro
- Bismarck, ND
- State GDP YoY
- ▲ 2.09%
- F500 in state
- 2
Industry mix (Fortune 500 HQ in ND)
| Industry | F500 HQs | Revenue |
|---|---|---|
| Utilities / Construction | 1 | $6B |
|
||
Price history
1 event — show timeline
- 2026-05-20 Listed $130,000 GNMLS
Cash-flow waterfall
monthlySold comps — $/sqft
last 12 mo · ≤1 miLoading sold comps…