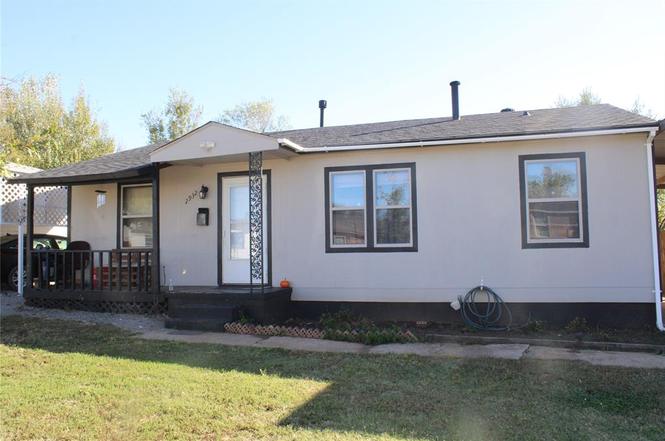
2932 SW 51st St · Oklahoma City, OK
Flood risk 1/10 · Minimal
- FEMA flood zone
- X (unshaded)
- Chance of flooding over 30 yrs
- 0.0%
- Est. flood insurance / yr
- $507 – $1,088
Fire risk 4/10 · Minor
- Est. fire insurance / yr
- $2,463 – $4,575
Heat risk 6/10 · Moderate
- Hot days now (above 107°F)
- 7 days/yr
- Hot days in 30 yrs
- 19 days/yr
Wind risk 3/10 · Minor
- Chance of severe wind over 30 yrs
- 4.0%
Air-quality risk 1/10 · Minimal
- Unhealthy air days now
- 0 days/yr
- Unhealthy air days in 30 yrs
- 0 days/yr
Risk factors via First Street. Map © Google.
Why this score? — see what drove the D grade
The composite is a weighted blend of 9 inputs, each scored 0–100. Each bar is that input's sub-score; the figure is the points it added to the 100-point composite (weight × sub-score).
- Cash flow +16.6/30.0
- ARV discount +7.5/15.0
- DSCR +5.1/10.0
- Livability +4.0/5.0
- 1% rule +3.6/10.0
- Rent growth +2.8/5.0
- Condition / age +2.5/5.0
- Schools +0.7/10.0
- Appreciation +0.0/10.0
$135,000
🖨 Deal sheet (PDF) 📄 Offer letter ✓ Due diligence
Listing remarks
Welcome home! This well-maintained single-family residence offers three comfortable bedrooms and one full bath in a smart, efficient layout. Recent exterior and interior updates — including brand-new roof and siding plus new laminated flooring throughout — provide both curb appeal and low-maintenance living. A reinforced storm shelter offers peace of mind, and easy backyard access leads to a generous, private rear yard ideal for pets, play, or weekend gatherings. Located just off I-240 at S May & SW 51st, you’ll enjoy quick access to highways, shopping and everyday conveniences while still having a quiet, residential feel. A fantastic opportunity for first-time buyer
Key facts
- 9,169 sq ft lot
- Built 1954
- Listed 172 days
Property features AI
Finance
- Other: Property is existing (not new construction)
- Financial info: Assumable loans: No; Loan qualification: Yes
- HOA & community: No mandatory association dues
Exterior
- Home design: Single-family residence; One-level; North-facing; Residential property
- Construction: Composition roof (new 2025); Low E windows; Other construction materials; Conventional foundation
- Exterior features: Covered porch; Exterior storage; Interior lot; Above-ground/outdoor/storm shelter (safe room)
Interior
- Kitchen: Free-standing gas range; Built-in gas oven
- Bedrooms: 3 bedrooms
- Flooring: Laminate flooring
- Bathrooms: 1 full bathroom
- Heating & cooling: Electric heating
- Interior features: Ceiling fan(s); Water heater
Neighborhood map
What this means for you Summary
Snapshot
- This is a 3-bed/1.0-bath single-family listed at $135k.
Deal economics
- At list price, monthly cash flow is $81 ($975/yr) — positive.
- The deal already cash-flows at list — no discount required.
- To meet the 1% rule (rent ≥ 1% of price), the offer needs to be $116k (14.4% below list).
- Recommended offer: $116k (14.4% below list) — sets the bar for 1% rule.
- Cap rate 7.0% vs local median 3.7% in Oklahoma City — top-decile yield for the area; either an underpriced asset or a hidden risk that comps aren't pricing in. Stress-test before assuming the spread holds.
Location & tenants
- Location reads 80/100 on livability (#3 in OK, #1,635 nationally) — a professional / high-income tenant draw. Strengths: amenities A+, commute A+, cost of living A+; Watch: crime F.
- Oklahoma City (urban): math 7% / reading 10% proficiency, ranked #254 of 270 in OK (top 94%) — low school quality limits family demand, transient renter base, plan for 1-2y turnover; 82% free/reduced lunch — lower-income household profile, screen leases tightly.
- Zoned schools: Arthur Es (math 2% / reading 8%, grade F, #766 of 845 statewide, top 94%, 389 students, 0% FRL); Classen Ms of Advanced Studies (math 35% / reading 46%, grade F, #6 of 345 statewide, top 1%, 855 students, 0% FRL); U. S. Grant Hs (math 2% / reading 7%, grade F, #442 of 447 statewide, top 99%, 1,594 students, 0% FRL) — zoned schools average 0% FRL vs 82% district-wide (82 pts lower); this property's tenant base skews higher-income than the district average.
- Market conditions: Rents rising (+1.1%/yr); 95 active listings in the ZIP; 38 comparable units currently listed for rent nearby; rentals at typical pace (median 22d on market — plan ~3-4 weeks tenant-placement turnaround); 5,365 units permitted in Oklahoma County in 2024 (569 in 5+ unit buildings).
- This rent runs 31% of the median local income ($45k/yr) — at the standard rent-burdened threshold; future hikes will face affordability resistance.
Forward outlook
- Local home prices are declining (-3.0%/yr); year-one equity from $933 of loan paydown is wiped out by about $4k of value loss. Plan a longer hold.
- Oklahoma County population projected at +41% by 2050 — long-run rental-demand tailwind backs the buy-and-hold thesis.
Negotiation context
- It's been on market 172 days — a 12% lower offer ($119k) is reasonable based on typical stale-listing flexibility.
- Current owner paid $30k; list at $135k implies a 350% gain — meaningful room to come down on a strong offer.
Risks & watch-outs
- Watch-outs: built in 1954 — expect roof / HVAC / electrical / plumbing capex.
- Climate carrying-cost: extreme-heat days projected 7→19/yr by 2055 (HVAC capex compounding) — expect insurance premiums to compound above CPI over the hold.
Questions for the listing agent
- It's been on market 172 days. Have you received any prior offers? Is the seller open to a 14% concession, seller financing, or rate buy-down credit?
- Built in 1954 — when were the roof, HVAC, electrical panel, plumbing, and water heater last replaced?
- Why hasn't it sold? Are there any deal-killer items the seller is aware of (foundation, flood, title, zoning, code violations)?
- Is there a deadline driving the sale (1031 exchange, divorce, estate, relocation)? That informs how much negotiation room exists.
- Schools are F-rated, which usually means shorter tenancies and higher turnover. Who's the typical renter profile here, and what's been the actual vacancy rate?
- Crime grade is F in this area — have there been break-ins, vandalism, or insurance claims at this property in the last 3 years? What carrier currently insures it and at what premium?
- The area grade is low — what's the realistic commute time and amenity access for the typical tenant pool here? Any planned neighborhood developments (good or bad) we should know about?
- What's the average days-on-market for RENTAL listings here right now (not sales)? A rising rental-DOM trend means longer vacancies and softer asking-rent achievability than the comps imply.
- What's the recent tenant-quality profile in this submarket — average credit score on applications, eviction rate, late-payment / NSF rate, and stable-employment percentage? A property-management company in the area should have these aggregated.
- How much new for-sale + rental construction is in the pipeline within 1–3 miles? Heavy new supply typically softens prices + rents 12–24 months out; constrained supply supports both.
Investment metrics
- 1% rule
- 0.86% ✗
- Cap rate
- 7.02%
- Cash-on-cash
- 2.58%
- DSCR
- 1.11
- GRM
- 9.7
CMA / ARV
- ARV (on-the-fly)
- $135,050
- Comps found
- 12
Show comp detail 12 sales within ~0.75 mi
| Address | Dist | Beds/Ba | Sqft | Sold | Price | $/sf | Match |
|---|---|---|---|---|---|---|---|
| 2932 SW 51st St | 0.00mi | 3/1.0 | 925 (0%) | 1mo | $135,000 | $146 | 99 |
| 2924 SW 51st St | 0.02mi | 3/1.0 | 950 (+3%) | 1mo | $122,000 | $128 | 94 |
| 2948 SW 49th St | 0.14mi | 3/1.0 | 875 (-5%) | 4mo | $115,000 | $131 | 81 |
| 3013 SW 52nd St | 0.09mi | 2/1.0 (-1) | 828 (-10%) | 1mo | $95,000 | $115 | 73 |
| 3101 SW 45th St | 0.43mi | 2/1.0 (-1) | 907 (-2%) | 2mo | $151,500 | $167 | 70 |
| 2633 Texoma Dr | 0.43mi | 3/1.0 | 884 (-4%) | 3mo | $156,800 | $177 | 70 |
| 2520 SW 45th St | 0.67mi | 3/1.0 | 935 (+1%) | 0mo | $129,750 | $139 | 67 |
| 3108 SW 46th St | 0.35mi | 3/1.0 | 840 (-9%) | 2mo | $140,000 | $167 | 66 |
| 3113 SW 46th St | 0.38mi | 2/1.0 (-1) | 984 (+6%) | 1mo | $70,000 | $71 | 66 |
| 3022 SW 57th St | 0.40mi | 3/1.5 | 1,004 (+8%) | 1mo | $175,000 | $174 | 64 |
| 2401 SW 54th St | 0.73mi | 3/1.0 | 935 (+1%) | 1mo | $177,000 | $189 | 64 |
| 3237 SW 48th St | 0.38mi | 2/1.0 (-1) | 840 (-9%) | 2mo | $110,000 | $131 | 60 |
Match score weights: distance 35% · size 25% · config 20% · recency 20%. Top-matched comps best support the ARV.
Projected returns pro-forma
-3.0% appreciation · 1.13% rent growth · sell at horizon
- IRR
- -14.2%
- Equity multiple
- 0.50×
- Total profit
- $-18,878
- Equity at exit
- $20,129
- IRR
- -8.4%
- Equity multiple
- 0.51×
- Total profit
- $-18,392
- Equity at exit
- $11,672
Cash invested: $37,800 (down + closing). Projections, not guarantees.
Landlord ↔ Tenant lean methodology
- Overall (STATE)
- 83 Strongly Landlord-Friendly
- State Oklahoma
- 83 Strongly Landlord-Friendly · R+20
- County
- — inherits STATE
- City
- — inherits STATE
ZIP-level market 73119
- Home prices YoY
- -14.4%
- Rents YoY
- 1.1%
- Active inventory
- 95
- Price-to-rent
- 9.7×
Monthly cashflow live
- Estimated rent
- $1,156 high interval (Pro) →
- Mortgage (P&I)
- −$708
- Tax from tax record
- −$68 /mo · $810/yr
- Insurance
- −$56
- HOA
- −$0
- Vacancy / Maint / Mgmt
- −$243
- Net cashflow
- $81
Break-even live
Sensitivity live
| Price | -10% $158 | -5% $119 | +0% $81 | +5% $43 | +10% $5 |
|---|---|---|---|---|---|
| Rent | -10% $-10 | -5% $36 | +0% $81 | +5% $127 | +10% $173 |
| Rate | -1.0pp $149 | -0.5pp $116 | base $81 | +0.5pp $46 | +1.0pp $11 |
UW: 25.0% down · 7.5% · 30yr · 1.5% tax · 5.0% vac · 8.0% maint · 8.0% mgmt
Financing live
Cash to close
- Down payment
- $33,750
- Closing costs
- $4,050
- Reserves months
- —
- Total cash needed
- —
Loan-product check · same deal, 3 products live
Conventional
25% down · 7.5% · 30yr
- Down + closing
- —
- Monthly P&I
- —
- Monthly cashflow
- —
- DSCR
- —
- Eligible?
- —
Personal DTI + credit; lowest rate.
DSCR
20% down · 8.5% · 30yr
- Down + closing
- —
- Monthly P&I
- —
- Monthly cashflow
- —
- DSCR
- —
- Eligible?
- —
No personal income docs; deal must DSCR.
Hard money
10% down · 12.0% · 12mo
- Down + closing
- —
- Monthly P&I
- —
- Monthly cashflow
- —
- DSCR
- —
- Eligible?
- —
Short-term bridge; refi at stabilization.
Rent comps 38 comps
| Address | Beds | Baths | Sqft | Rent | $/sqft | DOM | Units | Dist |
|---|---|---|---|---|---|---|---|---|
| 2812 SW 48th St Oklahoma City, OK | 4.0 | 1.0 | 840 | $1,350 | $1.61 | 21d | 1 | 0.19mi |
| 2801 SW 51st St Oklahoma City, OK | 2.0 | 1.0 | 840 | $1,025 | $1.22 | 4d | 1 | 0.20mi |
| 2741 SW Murray Dr Oklahoma City, OK | 3.0 | 1.0 | 949 | $1,395 | $1.47 | 4d | 1 | 0.27mi |
| 2741 SW 54th Pl Oklahoma City, OK | 3.0 | 2.0 | 1059 | $1,249 | $1.18 | 4d | 1 | 0.30mi |
| 5617 S May Ave Oklahoma City, OK | 1.0–3.0 | 1.5 | 1000 | $926 | $0.93 | 25d | 1 | 0.32mi |
| 5901 S May Ave Apt 78 Oklahoma City, OK | 2.0 | 2.0 | 859 | $945 | $1.10 | 0d | 1 | 0.47mi |
| 5901 S May Ave Unit 089 VLI Oklahoma City, OK | 2.0 | 2.0 | 859 | $999 | $1.16 | 45d | 1 | 0.47mi |
| 5901 S May Ave Apt 55 Oklahoma City, OK | 2.0 | 2.0 | 859 | $995 | $1.16 | 45d | 1 | 0.47mi |
| 5901 S May Ave Unit 006 Oklahoma City, OK | 2.0 | 2.0 | 859 | $949 | $1.10 | 45d | 1 | 0.47mi |
| 5901 S May Ave Unit 015 Oklahoma City, OK | 2.0 | 2.0 | 859 | $995 | $1.16 | 0d | 1 | 0.47mi |
| 5901 S May Ave Unit 105 Oklahoma City, OK | 2.0 | 2.0 | 859 | $995 | $1.16 | 4d | 1 | 0.47mi |
| 5901 S May Ave Unit 021 Oklahoma City, OK | 2.0 | 2.0 | 859 | $1,288 | $1.50 | 0d | 1 | 0.47mi |
| 5901 S May Ave Unit 086 LI Oklahoma City, OK | 2.0 | 2.0 | 859 | $945 | $1.10 | 22d | 1 | 0.47mi |
| 5901 S May Ave Apt 38 Oklahoma City, OK | 2.0 | 2.0 | 859 | $1,288 | $1.50 | 45d | 1 | 0.47mi |
| 5901 S May Ave Unit 090 Oklahoma City, OK | 2.0 | 2.0 | 859 | $945 | $1.10 | 45d | 1 | 0.47mi |
| 5901 S May Ave Unit 058- Up Oklahoma City, OK | 2.0 | 2.0 | 859 | $945 | $1.10 | 4d | 1 | 0.47mi |
| 5901 S May Ave Unit 004 VLI Up Oklahoma City, OK | 2.0 | 2.0 | 859 | $986 | $1.15 | 45d | 1 | 0.51mi |
| 2500 SW 48th St Oklahoma City, OK | 2.0 | 1.0 | 1096 | $1,050 | $0.96 | 45d | 1 | 0.59mi |
| 2412 SW 47th St Oklahoma City, OK | 3.0 | 1.0 | 638 | $1,150 | $1.80 | 25d | 1 | 0.71mi |
| 2813 SW 62nd St Oklahoma City, OK | 3.0 | 1.5 | 1001 | $1,400 | $1.40 | 25d | 1 | 0.86mi |
| 2236 SW 49th St Oklahoma City, OK | 2.0 | 1.0 | 750 | $875 | $1.17 | 0d | 1 | 0.86mi |
| 2908 SW 62nd St Oklahoma City, OK | 3.0 | 1.5 | 936 | $1,450 | $1.55 | 4d | 1 | 0.90mi |
| 2640 SW 38th St Oklahoma City, OK | 3.0 | 2.0 | 944 | $1,050 | $1.11 | 4d | 1 | 0.94mi |
| 5600 S Rockwood Ave Oklahoma City, OK | 3.0 | 1.0 | 1000 | $1,100 | $1.10 | 0d | 1 | 0.98mi |
| 2728 SW 65th St Oklahoma City, OK | 3.0 | 1.0 | 863 | $1,250 | $1.45 | 6d | 1 | 1.11mi |
| 4330 S Barnes Ave Oklahoma City, OK | 1.0–3.0 | 1.0–2.0 | 860 | $1,099 | $1.28 | 6d | 9 | 1.14mi |
| 3801 SW 43rd St Oklahoma City, OK | 2.0 | 1.0 | 720 | $925 | $1.28 | 45d | 1 | 1.18mi |
| 2336 SW Grand Blvd Oklahoma City, OK | 2.0 | 1.0 | 770 | $995 | $1.29 | 45d | 1 | 1.19mi |
| 3800 SW 42nd St Oklahoma City, OK | 2.0 | 1.0 | 790 | $895 | $1.13 | 45d | 1 | 1.19mi |
| 2128 SW 41st St Oklahoma City, OK | 2.0 | 1.0 | 860 | $820 | $0.95 | 4d | 1 | 1.19mi |
| 2120 SW 61st St Oklahoma City, OK | 3.0 | 1.0 | 1101 | $1,200 | $1.09 | 45d | 1 | 1.23mi |
| 2119 SW 39th St Oklahoma City, OK | 1.0–2.0 | 1.0 | 675 | $909 | $1.35 | 45d | 1 | 1.30mi |
| 2759 W I 240 Service Rd Oklahoma City, OK | 1.0–2.0 | 1.0–1.5 | 725 | $924 | $1.27 | 0d | 3 | 1.31mi |
| 2140 SW 35th St Oklahoma City, OK | 3.0 | 2.0 | 976 | $1,300 | $1.33 | 45d | 1 | 1.41mi |
| 3120 S Woodward Ave Oklahoma City, OK | 2.0 | 1.0 | 740 | $800 | $1.08 | 4d | 1 | 1.45mi |
| 3301 S Saint Clair Ave Oklahoma City, OK | 2.0 | 1.0 | 560 | $725 | $1.29 | 4d | 1 | 1.45mi |
| 1433 SW 60th St Oklahoma City, OK | 3.0 | 2.0 | 942 | $1,400 | $1.49 | 45d | 1 | 1.47mi |
| 1338 South Dr Oklahoma City, OK | 2.0 | 1.0 | 720 | $1,150 | $1.60 | 18d | 1 | 1.50mi |
Listing history 4 events
-
2026-04-24status Pending
-
2026-02-16price $135,000
-
2025-11-03$140,000 Active
-
1997-11-07soldstatus $30,000
ⓘ Source: listings_history table (triggers on properties + properties_extension) + one-shot
backfill from property_details.listing_events for pre-trigger history.
Tax reassessment forecast OK · Resets to sale price
- Current annual tax
- $810 · $68/mo
- Projected year-2 tax
- $1,215 · $101/mo
- Expected delta
- +$405/yr (+$34/mo · 49.9%)
ⓘ Screening estimate from a state-policy table — verify with the county assessor before closing.
Climate risk First Street
- Flood 1/10 Low FEMA zone X (unshaded) · 0% chance over 30 yrs
- Wildfire 4/10 Moderate
- Heat 6/10 Major 7 d/yr ≥107°F today · 19 d/yr by 30 yrs out
- Wind 3/10 Moderate 4% chance of damaging wind over 30 yrs
- Air quality 1/10 Low 0 unhealthy d/yr today · 0 by 30 yrs out
Nearby sold comps map
Loading sold comps map…
Walkable amenities ~0.75 mi
Loading nearby amenities…
Taxation est. · year 1
- Rental income
- $13,869
- − Mortgage interest
- −$7,562
- − Property taxes
- −$810
- − Insurance
- −$675
- − Repairs & maintenance
- −$1,109
- − Management
- −$1,109
- − Depreciation
- −$3,927
- Taxable loss
- −$1,325
- Est. tax savings @ 24.0%
- +$318
- After-tax cash flow
- $1,293/yr
For passive investors: Depreciation is non-cash, so a rental often shows a tax loss while cash-flowing — sheltering income. Rental losses are passive: they offset passive income freely, and up to $25,000/yr can offset ordinary (W-2) income if you actively participate and your MAGI is under $100k (phasing out to $0 by $150k); unused losses carry forward. On sale, claimed depreciation is recaptured at up to 25%, and gains may owe capital-gains tax (a 1031 exchange can defer both). Figures are a year-1 estimate at your 24.0% rate — not tax advice; consult a CPA.
Schools (NCES district)
- District
- Oklahoma City
- NCES district ID
- 4022770
- Math proficiency
- 7% ▼ -5.00%
- Reading proficiency
- 10% ▼ -6.00%
- Median HH income
- $35,606
- Composite
- 7.0/100
- National rank
- #9970
- State rank
- #254 of 270 in OK
Livability — Oklahoma City
- Score
- 80/100
- State rank
- #3
- US rank
- #1635
Category grades
Schools grade is shown separately in the Schools card above.
Census & demographics
- Census place
- Oklahoma City, OK
- County
- Oklahoma County · 771,644 people
- City population
- 498,656
- Metro
- Oklahoma City, OK
- Population (ZIP)
- 30,398
- Household income
- $45,421
- Rent vs Own
- Severe rent burden
- 1221.0
Population outlook (Oklahoma County) Hauer SSP2
- Today (2025)
- 911,875 people
- By 2030
- 982,413 · +7.7%
- By 2040
- 1,130,468 · +24.0%
- By 2050
- 1,288,422 · +41.3%
- By 2075
- 1,711,482 · +87.7%
- By 2100
- 2,088,448 · +129.0%
Race, ethnicity, and origin ACS 2023
- Neighborhood character
- Majority Hispanic (63%)
- Race & ethnicity
- Hispanic / Latino 63% Two or more races 24% White 24% Native American 7% Black 6%
- Hispanic origin (detail)
- Mexican 58%
- Common ancestry
- Slovak 1% Lithuanian 1%
- Foreign-born
- 28% · Canada
- Languages at home
- 45% English-only · Spanish 54%
Political lean MEDSL · Oklahoma
- 2024 margin
- Toss-up / Even · D 48.0% · R 49.7% · Other 2.3%
- 2008→2024 swing
- +15.1pp toward D · 2008: -16.8pp · 2024: -1.7pp
- All cycles
- 2024: R+1.7 2020: R+1.1 2016: R+10.5 2012: R+16.7 2008: R+16.8
Not yet ingested
- Civics
- —
Market trends
- HPI YoY
- ▼ -50.15%
- Current HPI
- 297.1117
- Rent YoY
- ▲ 1.13%
- Metro
- Oklahoma City, OK
- State GDP YoY
- ▲ 1.55%
- F500 in state
- 6
Industry mix (Fortune 500 HQ in OK)
| Industry | F500 HQs | Revenue |
|---|---|---|
| Energy | 3 | $48B |
|
||
Price history
+350.0% since first listed4 events — show timeline
- 2026-04-24 Pending — MLSOK
- 2026-02-16 Price Changed $135,000 MLSOK
- 2025-11-03 Listed $140,000 MLSOK
- 1997-11-07 Sold (Public Records) $30,000 Public Records
Property tax history
+3.7%/yrLatest (2025): $810 · +4.4% YoY. Source: county tax records.
Cash-flow waterfall
monthlySold comps — $/sqft
last 12 mo · ≤1 miLoading sold comps…