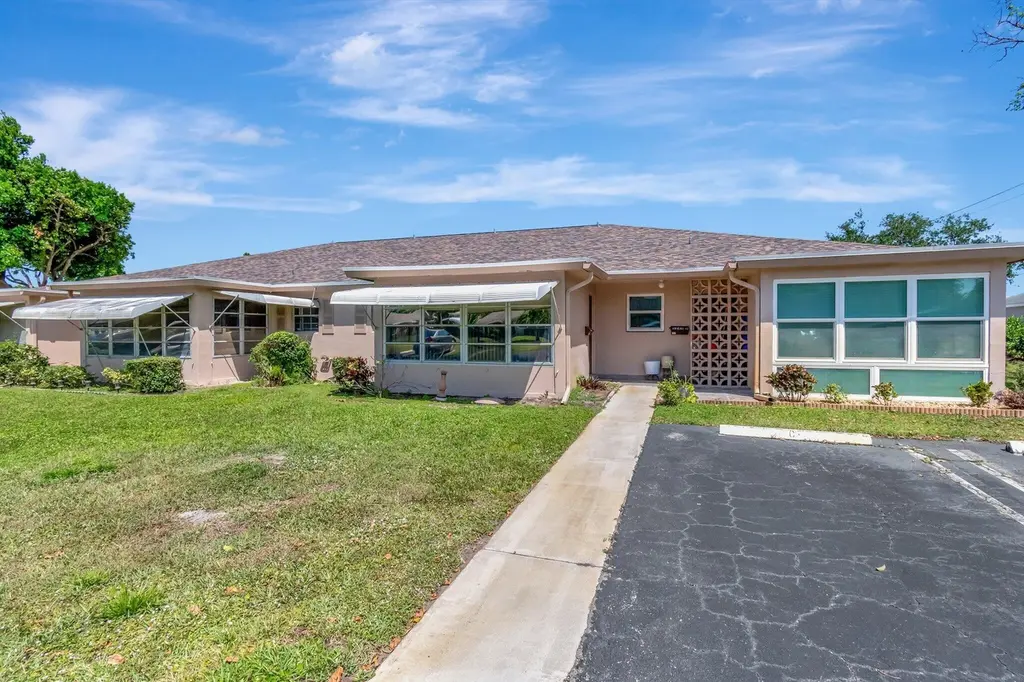
1245 High Point Pl S Unit C · Delray Beach, FL
Flood risk 5/10 · Moderate
- FEMA flood zone
- X (unshaded)
- Chance of flooding over 30 yrs
- 0.24%
- Est. flood insurance / yr
- $507 – $1,088
Fire risk 1/10 · Minimal
- Est. fire insurance / yr
- $947 – $1,759
Heat risk 10/10 · Severe
- Hot days now (above 106°F)
- 7 days/yr
- Hot days in 30 yrs
- 27 days/yr
Wind risk 10/10 · Severe
- Chance of severe wind over 30 yrs
- 99.0%
Air-quality risk 2/10 · Minimal
- Unhealthy air days now
- 1 days/yr
- Unhealthy air days in 30 yrs
- 2 days/yr
Risk factors via First Street. Map © Google.
Why this score? — see what drove the C+ grade
The composite is a weighted blend of 9 inputs, each scored 0–100. Each bar is that input's sub-score; the figure is the points it added to the 100-point composite (weight × sub-score).
- Cash flow +23.2/30.0
- 1% rule +10.0/10.0
- ARV discount +7.5/15.0
- DSCR +7.4/10.0
- Schools +4.3/10.0
- Livability +3.9/5.0
- Rent growth +3.0/5.0
- Condition / age +2.5/5.0
- Appreciation +0.0/10.0
$139,000
🖨 Deal sheet (PDF) 📄 Offer letter ✓ Due diligence
Listing remarks MLS
LOVELY VILLA IN DELRAY, OPEN FLOOR PLAN, TILE FLOORS, EXCELLENT COMMUNITY
Key facts
- Quality built-ins
- Florida room
- Large tile floors
Tags
Property features AI
Finance
- Financial info: Community contains 292 units; Pets not allowed
- HOA & community: HOA: High Point of Delray Section 6; Monthly HOA fee; HOA amenities include clubhouse, laundry, shuffleboard, tennis courts, community room, library, and pickleball courts; HOA fee covers cable TV, insurance, grounds maintenance, sewer, trash, water, common real estate tax, and recreation facility
Exterior
- Parking: 2 parking spaces (assigned and guest parking), plus 1 open parking space
- Utilities: Public water; Public sewer; Electricity connected; Cable available
- Home design: Condominium; Single-story; Faces west; Resale property
- Construction: Built with CBS construction; Composition/shingle roof; Building name: 1245; Public records list living area as 1,040
- Exterior features: Open patio; Patio
Interior
- Kitchen: Dishwasher; Electric range; Microwave; Refrigerator; Electric water heater
- Bedrooms: 1 bedroom on the main level
- Flooring: Ceramic tile
- Bathrooms: 2 full bathrooms on the main level
- Heating & cooling: Central electric heating; Central electric cooling
- Interior features: Walk-in closet(s); Blinds; Furnished
- Laundry & utility: Laundry in common area (see remarks)
Neighborhood map
What this means for you Summary
Snapshot
- This is a 1-bed/1.5-bath condo listed at $139k.
Deal economics
- At list price, monthly cash flow is $251 ($3k/yr) — positive.
- The deal already cash-flows at list — no discount required.
- Meets the 1% rule at list price ($2k rent vs $139k).
- Recommended offer: $131k (6.0% below list) — sets the bar for market timing.
- Cap rate 8.5% vs local median 4.3% in Delray Beach — top-decile yield for the area; either an underpriced asset or a hidden risk that comps aren't pricing in. Stress-test before assuming the spread holds.
Location & tenants
- Location reads 77/100 on livability (#202 in FL, #3,160 nationally) — a middle-class / working-renter tenant base. Strengths: housing A+, health & safety A+, commute A-; Watch: cost of living C-, crime D-, amenities F.
- Palm Beach (suburban): math 46% / reading 53% proficiency, ranked #34 of 73 in FL (top 47%) — families likely to look elsewhere, expect single-tenant / working-renter base with shorter leases.
- Zoned schools: Banyan Creek Elementary School (math 62% / reading 64%, grade B, #582 of 2,144 statewide, top 28%, 844 students, 51% FRL); Carver Middle School (math 22% / reading 34%, grade F, #486 of 571 statewide, top 86%, 732 students, 73% FRL); Atlantic High School (math 28% / reading 52%, grade F, #296 of 667 statewide, top 45%, 1,889 students, 59% FRL).
- Market conditions: Rents rising (+1.8%/yr); 359 active listings in the ZIP; 40 comparable units currently listed for rent nearby; rentals at typical pace (median 26d on market — plan ~3-4 weeks tenant-placement turnaround); solid renter incomes; 3,974 units permitted in Palm Beach County in 2024 (1,012 in 5+ unit buildings).
- This rent runs 33% of the median local income ($78k/yr) — at the standard rent-burdened threshold; future hikes will face affordability resistance.
Forward outlook
- Local home prices are declining (-3.0%/yr); year-one equity from $961 of loan paydown is wiped out by about $4k of value loss. Plan a longer hold.
- Palm Beach County population projected at +30% by 2050 — long-run rental-demand tailwind backs the buy-and-hold thesis.
Negotiation context
- It's been on market 76 days — a 6% lower offer ($131k) is reasonable based on typical stale-listing flexibility.
- 7 sale attempts since 23y ago with the ask held roughly flat each time — persistent listings suggest the price (not the market) is what's stuck; bring a comps-based counter.
- Current owner paid $39k; list at $139k implies a 254% gain — meaningful room to come down on a strong offer.
Risks & watch-outs
- Watch-outs: HOA is 22% of rent.
- Climate carrying-cost: moderate flood risk; severe wind risk, 99% chance of damaging wind over 30y; extreme-heat days projected 7→27/yr by 2055 (HVAC capex compounding) — expect insurance premiums to compound above CPI over the hold.
Questions for the listing agent
- It's been on market 76 days. Have you received any prior offers? Is the seller open to a 6% concession, seller financing, or rate buy-down credit?
- Built in 1978 — when were the roof, HVAC, electrical panel, plumbing, and water heater last replaced?
- What does the HOA fee cover, when was the last increase, and are there any pending special assessments or reserve-fund shortfalls?
- Any open or pending special assessments — roof, HVAC, plumbing, elevator, façade? What's the per-unit balance and payoff schedule, and is the seller paying it off at close or rolling it to the buyer?
- Why hasn't it sold? Are there any deal-killer items the seller is aware of (foundation, flood, title, zoning, code violations)?
- Is there a deadline driving the sale (1031 exchange, divorce, estate, relocation)? That informs how much negotiation room exists.
- Schools are B-rated — typically a magnet for longer-tenancy family renters. What's the average tenant stay here, and is there a school-zone premium baked into asking?
- Crime grade is D in this area — have there been break-ins, vandalism, or insurance claims at this property in the last 3 years? What carrier currently insures it and at what premium?
- What's the average days-on-market for RENTAL listings here right now (not sales)? A rising rental-DOM trend means longer vacancies and softer asking-rent achievability than the comps imply.
- What's the recent tenant-quality profile in this submarket — average credit score on applications, eviction rate, late-payment / NSF rate, and stable-employment percentage? A property-management company in the area should have these aggregated.
- How much new apartment / multifamily construction is in the pipeline within 1–3 miles? Heavy new supply (>2% of stock underway) typically softens rents 12–24 months out; light construction supports rent growth.
Investment metrics
- 1% rule
- 1.56% ✓
- Cap rate
- 8.46%
- Cash-on-cash
- 7.73%
- DSCR
- 1.34
- GRM
- 5.3
CMA / ARV
No comps found within radius.
Projected returns pro-forma
-3.0% appreciation · 1.83% rent growth · sell at horizon
- IRR
- -6.1%
- Equity multiple
- 0.78×
- Total profit
- $-8,746
- Equity at exit
- $20,725
- IRR
- 1.6%
- Equity multiple
- 1.11×
- Total profit
- $4,206
- Equity at exit
- $12,018
Cash invested: $38,920 (down + closing). Projections, not guarantees.
Landlord ↔ Tenant lean methodology
- Overall (STATE)
- 87 Strongly Landlord-Friendly
- State Florida
- 87 Strongly Landlord-Friendly · R+3
- County
- — inherits STATE
- City
- — inherits STATE
ZIP-level market 33445
- Rents YoY
- 1.8%
- Active inventory
- 359
- Price-to-rent
- 5.3×
Monthly cashflow live
- Estimated rent
- $2,170 high interval (Pro) →
- Mortgage (P&I)
- −$729
- Tax from tax record
- −$197 /mo · $2,358/yr
- Insurance
- −$58
- HOA
- −$480
- Vacancy / Maint / Mgmt
- −$456
- Net cashflow
- $251
Break-even live
Sensitivity live
| Price | -10% $329 | -5% $290 | +0% $251 | +5% $211 | +10% $172 |
|---|---|---|---|---|---|
| Rent | -10% $79 | -5% $165 | +0% $251 | +5% $336 | +10% $422 |
| Rate | -1.0pp $321 | -0.5pp $286 | base $251 | +0.5pp $215 | +1.0pp $178 |
UW: 25.0% down · 7.5% · 30yr · 1.5% tax · 5.0% vac · 8.0% maint · 8.0% mgmt
Financing live
Cash to close
- Down payment
- $34,750
- Closing costs
- $4,170
- Reserves months
- —
- Total cash needed
- —
Loan-product check · same deal, 3 products live
Conventional
25% down · 7.5% · 30yr
- Down + closing
- —
- Monthly P&I
- —
- Monthly cashflow
- —
- DSCR
- —
- Eligible?
- —
Personal DTI + credit; lowest rate.
DSCR
20% down · 8.5% · 30yr
- Down + closing
- —
- Monthly P&I
- —
- Monthly cashflow
- —
- DSCR
- —
- Eligible?
- —
No personal income docs; deal must DSCR.
Hard money
10% down · 12.0% · 12mo
- Down + closing
- —
- Monthly P&I
- —
- Monthly cashflow
- —
- DSCR
- —
- Eligible?
- —
Short-term bridge; refi at stabilization.
Rent comps 40 comps
| Address | Beds | Baths | Sqft | Rent | $/sqft | DOM | Units | Dist |
|---|---|---|---|---|---|---|---|---|
| 1142 Circle Ter W Unit C Delray Beach, FL | 1.0 | 1.5 | 1080 | $1,700 | $1.57 | 4d | 1 | 0.05mi |
| 1155 South Drive Cir Unit A Delray Beach, FL | 2.0 | 2.0 | 1080 | $2,195 | $2.03 | 25d | 1 | 0.09mi |
| 1152 Circle Dr Unit D Delray Beach, FL | 2.0 | 2.0 | 1200 | $2,000 | $1.67 | 25d | 1 | 0.09mi |
| 1152 Circle Dr Unit D Delray Beach, FL | 2.0 | 2.0 | 1200 | $2,000 | $1.67 | 13d | 1 | 0.09mi |
| 1252 Club Dr W Unit D Delray Beach, FL | 2.0 | 2.0 | 1137 | $2,100 | $1.85 | 25d | 1 | 0.15mi |
| 1252 Club Dr W Unit D Delray Beach, FL | 2.0 | 2.0 | 1137 | $2,100 | $1.85 | 6d | 1 | 0.15mi |
| 4515 NW 3rd Ct Unit C Delray Beach, FL | 1.0 | 2.0 | 1080 | $1,900 | $1.76 | 25d | 1 | 0.30mi |
| 707 High Point Blvd N Unit C Delray Beach, FL | 1.0 | 1.5 | 994 | $1,600 | $1.61 | 25d | 1 | 0.42mi |
| 775 North Dr Unit A Delray Beach, FL | 2.0 | 2.0 | 1175 | $2,000 | $1.70 | 0d | 1 | 0.44mi |
| 775 North Dr Unit A Delray Beach, FL | 2.0 | 2.0 | 1175 | $2,000 | $1.70 | 12d | 1 | 0.44mi |
| 512 High Point Dr Unit C Delray Beach, FL | 1.0 | 2.0 | 994 | $2,100 | $2.11 | 21d | 1 | 0.46mi |
| 4510 NW 2nd St Unit A Delray Beach, FL | 2.0 | 2.0 | 1080 | $1,800 | $1.67 | 25d | 1 | 0.47mi |
| 405 High Point Blvd Unit C Delray Beach, FL | 1.0 | 1.5 | 994 | $1,500 | $1.51 | 25d | 1 | 0.50mi |
| 125 Via D Este Delray Beach, FL | 1.0–3.0 | 1.0–2.0 | 1156 | $2,450 | $2.12 | 0d | 14 | 0.55mi |
| 212 High Point Ter W Unit C Delray Beach, FL | 1.0 | 1.5 | 1122 | $2,000 | $1.78 | 23d | 1 | 0.56mi |
| 797 NW 32nd Ave Delray Beach, FL | 2.0 | 2.0 | 1480 | $2,800 | $1.89 | 25d | 1 | 0.61mi |
| 797 NW 32nd Ave Delray Beach, FL | 2.0 | 2.0 | 1480 | $2,800 | $1.89 | 19d | 1 | 0.61mi |
| 4477 NW 3rd Dr Delray Beach, FL | 2.0 | 1.5 | 1109 | $2,550 | $2.30 | 25d | 1 | 0.63mi |
| 2622 NW 7th Ct Delray Beach, FL | 2.0 | 2.5 | 1384 | $2,750 | $1.99 | 25d | 1 | 0.70mi |
| 872 NW 29th Ave Unit A Delray Beach, FL | 2.0 | 2.0 | 1188 | $2,700 | $2.27 | 25d | 1 | 0.70mi |
| 227 Coral Trace Ln Unit 227 Delray Beach, FL | 2.0 | 2.0 | 1376 | $3,100 | $2.25 | 25d | 1 | 0.72mi |
| 2480 S Coral Trace Cir Delray Beach, FL | 2.0 | 2.0 | 1379 | $2,900 | $2.10 | 9d | 1 | 0.72mi |
| 13487 Barwick Rd Unit B Delray Beach, FL | 2.0 | 1.5 | 1092 | $3,600 | $3.30 | 0d | 1 | 0.74mi |
| 5265 NW 3rd St Unit C Delray Beach, FL | 1.0 | 1.5 | 1080 | $2,200 | $2.04 | 25d | 1 | 0.76mi |
| 4080 Sea Grape Cir Delray Beach, FL | — | 2.0 | 1418 | $3,650 | $2.57 | 0d | 1 | 0.76mi |
| 305 SW 28th Ave Delray Beach, FL | 2.0 | 2.0 | 1369 | $4,300 | $3.14 | 15d | 1 | 0.82mi |
| 354 SW 28th Ave Delray Beach, FL | 2.0 | 2.0 | 1369 | $5,450 | $3.98 | 25d | 1 | 0.83mi |
| 5030 Lakefront Blvd Unit D Delray Beach, FL | 2.0 | 2.0 | 1287 | $1,700 | $1.32 | 25d | 1 | 0.83mi |
| 2915 NW 12th St Unit D Delray Beach, FL | 2.0 | 2.0 | 1499 | $3,200 | $2.13 | 9d | 1 | 0.86mi |
| 5126 Lakefront Blvd Unit D Delray Beach, FL | 2.0 | 2.0 | 1186 | $2,500 | $2.11 | 22d | 1 | 0.93mi |
| 5093 Privet Pl Unit A-1 Delray Beach, FL | 2.0 | 2.0 | 1220 | $2,350 | $1.93 | 25d | 1 | 0.97mi |
| 5169 Lakefront Blvd Unit D Delray Beach, FL | 2.0 | 2.0 | 1186 | $2,300 | $1.94 | 25d | 1 | 0.98mi |
| 14629 Canalview Dr Unit C Delray Beach, FL | 1.0 | 2.0 | 1068 | $1,600 | $1.50 | 25d | 1 | 0.98mi |
| 5385 Lakefront Blvd Unit A Delray Beach, FL | 2.0 | 2.0 | 1186 | $2,200 | $1.85 | 25d | 1 | 0.98mi |
| 14676 Canalview Dr Unit C Delray Beach, FL | 1.0 | 2.0 | 1068 | $1,775 | $1.66 | 25d | 1 | 0.98mi |
| 500 N Congress Ave Delray Beach, FL | 2.0–3.0 | 1.0–2.0 | 989 | $2,295 | $2.32 | 0d | 6 | 0.98mi |
| 2583 NW 13th St Delray Beach, FL | 2.0 | 2.0 | 1466 | $2,600 | $1.77 | 19d | 1 | 0.99mi |
| 2095 W Atlantic Ave Delray Beach, FL | 3.0 | 1.0–2.0 | 1012 | $2,825 | $2.79 | 0d | 10 | 1.03mi |
| 5061 Nesting Way Unit D Delray Beach, FL | 2.0 | 2.0 | 1255 | $2,400 | $1.91 | 25d | 1 | 1.04mi |
| 4809 N Wickham Cir Unit A Delray Beach, FL | 2.0 | 2.0 | 1028 | $2,600 | $2.53 | 25d | 1 | 1.04mi |
HOA detail condo
- Monthly dues
- $480 · $5,760/yr
- Assessments
- None detected in remarks — confirm with the listing agent.
Listing history 40 events
-
2026-06-21days on market $139,000 Active 76 DOM
-
2026-06-18days on market $139,000 Active 73 DOM
-
2026-06-17days on market $139,000 Active 72 DOM
-
2026-06-16days on market $139,000 Active 71 DOM
-
2026-06-15days on market $139,000 Active 70 DOM
-
2026-06-13days on market $139,000 Active 68 DOM
-
2026-06-09days on market $139,000 Active 64 DOM
-
2026-06-08days on market $139,000 Active 63 DOM
-
2026-06-07days on market $139,000 Active 62 DOM
-
2026-06-04days on market $139,000 Active 59 DOM
-
2026-06-03days on market $139,000 Active 58 DOM
-
2026-06-02days on market $139,000 Active 57 DOM
-
2026-06-01days on market $139,000 Active 56 DOM
-
2026-05-31days on market $139,000 Active 55 DOM
-
2026-05-24price $139,000
-
2026-04-06status Active
-
2026-03-28historical
-
2026-03-27$145,900 Active
-
2025-09-30historical
-
2025-09-15price $149,900
-
2025-07-07price $153,900
-
2025-06-05price $154,900
-
2025-05-01price $158,500
-
2025-04-17price $159,500
-
2025-04-02$162,500 Active
-
2013-05-13soldstatus $39,299 73-char remark
Show marketing remark (73 chars)
LOVELY VILLA IN DELRAY, OPEN FLOOR PLAN, TILE FLOORS, EXCELLENT COMMUNITY
-
2005-10-04soldstatus $147,000
-
2005-09-16soldstatus $147,000
-
2005-07-08historical
-
2005-05-25$153,500
-
2004-11-23historical
-
2004-11-11$139,900
-
2004-05-10soldstatus $76,000
-
2004-05-06soldstatus $76,000
-
2004-03-30historical
-
2004-03-08$79,990
-
2003-10-03soldstatus $61,000
-
2003-09-29soldstatus $61,000
-
2003-08-22historical
-
2003-08-19$61,000
ⓘ Source: listings_history table (triggers on properties + properties_extension) + one-shot
backfill from property_details.listing_events for pre-trigger history.
Tax reassessment forecast FL · Resets to sale price
- Current annual tax
- $2,358 · $197/mo
- Projected year-2 tax
- $2,358 · $197/mo
- Expected delta
- $0/yr ($0/mo · 0.0%)
ⓘ Screening estimate from a state-policy table — verify with the county assessor before closing.
Climate risk First Street
- Flood 5/10 Major FEMA zone X (unshaded) · 24% chance over 30 yrs
- Wildfire 1/10 Low
- Heat 10/10 Extreme 7 d/yr ≥106°F today · 27 d/yr by 30 yrs out
- Wind 10/10 Extreme 99% chance of damaging wind over 30 yrs
- Air quality 2/10 Low 1 unhealthy d/yr today · 2 by 30 yrs out
Nearby sold comps map
Loading sold comps map…
Walkable amenities ~0.75 mi
Loading nearby amenities…
Taxation est. · year 1
- Rental income
- $26,035
- − Mortgage interest
- −$7,786
- − Property taxes
- −$2,358
- − Insurance
- −$695
- − Repairs & maintenance
- −$2,083
- − Management
- −$2,083
- − HOA
- −$5,760
- − Depreciation
- −$4,044
- Taxable income
- $1,226
- Est. tax owed @ 24.0%
- −$294
- After-tax cash flow
- $2,713/yr
For passive investors: Depreciation is non-cash, so a rental often shows a tax loss while cash-flowing — sheltering income. Rental losses are passive: they offset passive income freely, and up to $25,000/yr can offset ordinary (W-2) income if you actively participate and your MAGI is under $100k (phasing out to $0 by $150k); unused losses carry forward. On sale, claimed depreciation is recaptured at up to 25%, and gains may owe capital-gains tax (a 1031 exchange can defer both). Figures are a year-1 estimate at your 24.0% rate — not tax advice; consult a CPA.
Schools (NCES district)
- District
- Palm Beach
- NCES district ID
- 1201500
- Math proficiency
- 46% ▼ -16.00%
- Reading proficiency
- 53% ▼ -4.00%
- Median HH income
- $53,943
- Composite
- 42.72/100
- National rank
- #3160
- State rank
- #34 of 73 in FL
Livability — Delray Beach
- Score
- 77/100
- State rank
- #202
- US rank
- #3160
Category grades
Schools grade is shown separately in the Schools card above.
Census & demographics
- Census place
- Delray Beach, FL
- County
- Palm Beach County · 1,438,312 people
- City population
- 123,167
- Metro
- Miami-Fort Lauderdale-Pompano Beach, FL
- Population (ZIP)
- 33,122
- Household income
- $78,163
- Rent vs Own
- Severe rent burden
- 1649.0
Population outlook (Palm Beach County) Hauer SSP2
- Today (2025)
- 1,637,487 people
- By 2030
- 1,743,255 · +6.5%
- By 2040
- 1,948,712 · +19.0%
- By 2050
- 2,132,979 · +30.3%
- By 2075
- 2,530,027 · +54.5%
- By 2100
- 2,706,979 · +65.3%
Race, ethnicity, and origin ACS 2023
- Neighborhood character
- Diverse neighborhood (Simpson 0.62)
- Race & ethnicity
- White 55% Black 24% Hispanic / Latino 11% Two or more races 11% Asian 4%
- Hispanic origin (detail)
- Puerto Rican 3% Cuban 2%
- Common ancestry
- Hispanic 14% Romanian 3% Scotch-Irish 3%
- Foreign-born
- 27% · Canada, Jamaica, Dominican Republic
- Languages at home
- 66% English-only · French/Haitian/Cajun 18% Spanish 9% Other Indo-European 4%
Political lean MEDSL · Palm Beach
- 2024 margin
- Toss-up / Even · D 50.0% · R 49.2%
- 2008→2024 swing
- -22.1pp toward R · 2008: 22.9pp · 2024: 0.8pp
- All cycles
- 2024: D+0.8 2020: D+12.8 2016: D+15.3 2012: D+17.0 2008: D+22.9
Not yet ingested
- Civics
- —
Market trends
- HPI YoY
- ▼ -258.16%
- Current HPI
- 349.5505
- Rent YoY
- ▲ 1.83%
- Metro
- Miami-Fort Lauderdale-Pompano Beach, FL
- State GDP YoY
- ▲ 3.28%
- F500 in state
- 36
Industry mix (Fortune 500 HQ in FL)
| Industry | F500 HQs | Revenue |
|---|---|---|
| Industrial Technology | 2 | $29B |
|
||
| Insurance | 2 | $17B |
|
||
| Retail | 1 | $60B |
|
||
| Technology Distribution | 1 | $58B |
|
||
| Homebuilding | 1 | $35B |
|
||
| Technology Manufacturing | 1 | $35B |
|
||
Price history
+127.9% since first listed26 events — show timeline
- 2026-05-24 Price Changed $139,000 Beaches MLS
- 2026-04-06 Relisted — Beaches MLS
- 2026-03-28 Listing Removed — Beaches MLS
- 2026-03-27 Listed $145,900 Beaches MLS
- 2025-09-30 Listing Removed — Beaches MLS
- 2025-09-15 Price Changed $149,900 Beaches MLS
- 2025-07-07 Price Changed $153,900 Beaches MLS
- 2025-06-05 Price Changed $154,900 Beaches MLS
- 2025-05-01 Price Changed $158,500 Beaches MLS
- 2025-04-17 Price Changed $159,500 Beaches MLS
- 2025-04-02 Listed $162,500 Beaches MLS
- 2013-05-13 Sold (MLS) $39,299 MARMLS
- 2005-10-04 Sold (Public Records) $147,000 Public Records
- 2005-09-16 Sold (MLS) $147,000 Beaches MLS
- 2005-07-08 Listing Removed — Beaches MLS
- 2005-05-25 Listed $153,500 Beaches MLS
- 2004-11-23 Listing Removed — Beaches MLS
- 2004-11-11 Listed $139,900 Beaches MLS
- 2004-05-10 Sold (Public Records) $76,000 Public Records
- 2004-05-06 Sold (MLS) $76,000 Beaches MLS
- 2004-03-30 Listing Removed — Beaches MLS
- 2004-03-08 Listed $79,990 Beaches MLS
- 2003-10-03 Sold (Public Records) $61,000 Public Records
- 2003-09-29 Sold (MLS) $61,000 Beaches MLS
- 2003-08-22 Listing Removed — Beaches MLS
- 2003-08-19 Listed $61,000 Beaches MLS
Property tax history
+7.7%/yrLatest (2025): $2,358 · +3.7% YoY. Source: county tax records.
Cash-flow waterfall
monthlySold comps — $/sqft
last 12 mo · ≤1 miLoading sold comps…