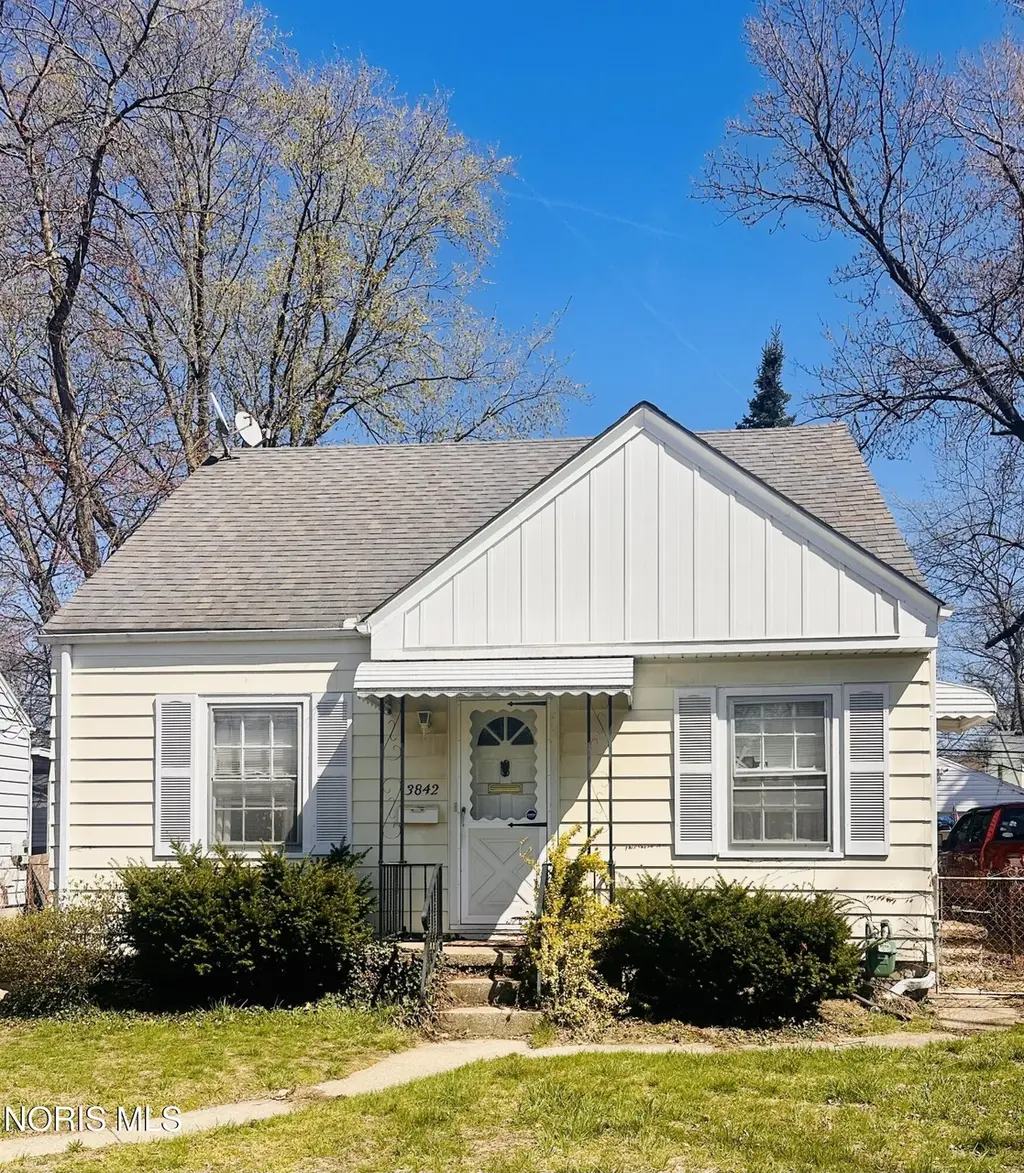
3842 Seckinger Dr · Toledo, OH
Flood risk 1/10 · Minimal
- FEMA flood zone
- X (unshaded)
- Chance of flooding over 30 yrs
- 0.0%
- Est. flood insurance / yr
- $507 – $1,088
Fire risk 1/10 · Minimal
- Est. fire insurance / yr
- $713 – $1,323
Heat risk 3/10 · Minor
- Hot days now (above 100°F)
- 7 days/yr
- Hot days in 30 yrs
- 16 days/yr
Wind risk 2/10 · Minimal
- Chance of severe wind over 30 yrs
- —
Air-quality risk 2/10 · Minimal
- Unhealthy air days now
- 1 days/yr
- Unhealthy air days in 30 yrs
- 3 days/yr
Risk factors via First Street. Map © Google.
Why this score? — see what drove the C- grade
The composite is a weighted blend of 9 inputs, each scored 0–100. Each bar is that input's sub-score; the figure is the points it added to the 100-point composite (weight × sub-score).
- Cash flow +15.6/30.0
- ARV discount +15.0/15.0
- 1% rule +4.8/10.0
- DSCR +4.8/10.0
- Rent growth +3.3/5.0
- Livability +3.3/5.0
- Condition / age +2.5/5.0
- Schools +1.6/10.0
- Appreciation +0.0/10.0
$84,900
🖨 Deal sheet 📄 Offer letter ✓ Due diligence
Listing remarks MLS
GREAT VALUE * SQ FOOTAGE ON RECORD DOES NOT INCLUED 2 FINISHED ROOMS UP * EXTRA STORAGE * GFA/CA * CLEAN AS CAN BE * A GREAT STARTER HOUSE!
Key facts
- 4,900 sq ft lot
- Garage
- Built 1947
Property features AI
Exterior
- Parking: Detached garage (1 space, 1 total parking)
- Utilities: Public water; Public sewer; 100 Amp electric service; Electricity available; Natural gas available; Cable, internet and WiFi available
- Home design: Single-family residence (house); One and one-half levels; Not attached to other structures; No common walls
- Construction: Metal siding; Crawl space foundation; Estimated living area approximately 728
- Exterior features: Shingle roof; City street frontage
Interior
- Kitchen: Electric range; Refrigerator
- Bedrooms: Bedroom 2 on the upper level; Additional upper-level room noted as attic/other
- Flooring: Carpet; Linoleum
- Bathrooms: 1 full bathroom
- Heating & cooling: Forced air heating
- Interior features: Eat-in kitchen; 6 total rooms
- Laundry & utility: Washer and dryer included; Laundry on main level; Water heater
Neighborhood map
What this means for you Summary
Snapshot
- This is a 1-bed/1.0-bath single-family listed at $85k.
Deal economics
- At list price, monthly cash flow is $35 ($422/yr) — positive.
- The deal already cash-flows at list — no discount required.
- To meet the 1% rule (rent ≥ 1% of price), the offer needs to be $83k (2.3% below list).
- Recommended offer: $83k (2.3% below list) — sets the bar for 1% rule.
Location & tenants
- Location reads 66/100 on livability (#645 in OH) — a middle-class / working-renter tenant base. Strengths: cost of living A+, housing A+, health & safety A+; Watch: amenities C-, crime F, commute F.
- Toledo City (urban): math 15% / reading 24% proficiency, ranked #634 of 656 in OH (top 97%) — low school quality limits family demand, transient renter base, plan for 1-2y turnover; 72% free/reduced lunch — lower-income household profile, screen leases tightly.
- Zoned schools: Elmhurst Elementary School (math 59% / reading 57%, grade C+, #714 of 1,584 statewide, top 45%, 382 students, 28% FRL); Start High School (math 11% / reading 33%, grade F, #672 of 781 statewide, top 86%, 1,242 students, 50% FRL) — zoned schools average 39% FRL vs 72% district-wide (32 pts lower); this property's tenant base skews higher-income than the district average.
- Zoned-school proficiency averages 40% at this address vs 20% district-wide (+20 pts) — the actual schools serving this property are materially stronger than the Toledo City average implies; a family-tenant draw the district grade alone would hide.
- Market conditions: Rents rising (+3.3%/yr); 111 active listings in the ZIP; 27 comparable units currently listed for rent nearby; rentals at typical pace (median 21d on market — plan ~3-4 weeks tenant-placement turnaround); 415 units permitted in Lucas County in 2024 (122 in 5+ unit buildings).
- This rent is only 15% of the median local income ($64k/yr) — well below the 30% rent-burden line; pricing power to push rent on renewal without tenant pushback.
Forward outlook
- Local home prices are declining (-3.0%/yr); year-one equity from $587 of loan paydown is wiped out by about $3k of value loss. Plan a longer hold.
- Lucas County population projected at -16% by 2050 — secular population decline; favor cash flow + early exit over multi-decade hold.
Negotiation context
- Only 1 days on market — expect competitive offers; lowballing is unlikely to land.
- Current owner paid $72k; 19% above their basis — modest negotiation headroom, anchor on the comps not their cost.
Risks & watch-outs
- Watch-outs: built in 1947 — expect roof / HVAC / electrical / plumbing capex.
Questions for the listing agent
- Built in 1947 — when were the roof, HVAC, electrical panel, plumbing, and water heater last replaced?
- Is there a deadline driving the sale (1031 exchange, divorce, estate, relocation)? That informs how much negotiation room exists.
- Schools are D-rated, which usually means shorter tenancies and higher turnover. Who's the typical renter profile here, and what's been the actual vacancy rate?
- Crime grade is F in this area — have there been break-ins, vandalism, or insurance claims at this property in the last 3 years? What carrier currently insures it and at what premium?
- What's the average days-on-market for RENTAL listings here right now (not sales)? A rising rental-DOM trend means longer vacancies and softer asking-rent achievability than the comps imply.
- What's the recent tenant-quality profile in this submarket — average credit score on applications, eviction rate, late-payment / NSF rate, and stable-employment percentage? A property-management company in the area should have these aggregated.
- How much new for-sale + rental construction is in the pipeline within 1–3 miles? Heavy new supply typically softens prices + rents 12–24 months out; constrained supply supports both.
Investment metrics
- 1% rule
- 0.98% ✗
- Cap rate
- 6.79%
- Cash-on-cash
- 1.77%
- DSCR
- 1.08
- GRM
- 8.5
CMA / ARV
- ARV (on-the-fly)
- $101,920
- Comps found
- 3
Show comp detail 3 sales within ~0.75 mi
| Address | Dist | Beds/Ba | Sqft | Sold | Price | $/sf | Match |
|---|---|---|---|---|---|---|---|
| 2621 Grantwood Dr | 0.70mi | 2/1.0 (+1) | 728 (0%) | 1mo | $135,900 | $187 | 61 |
| 4222 Garrison Rd | 0.47mi | 2/1.0 (+1) | 786 (+8%) | 24mo | $110,000 | $140 | 40 |
| 2624 Grantwood Dr | 0.72mi | 2/1.0 (+1) | 832 (+14%) | 7mo | $70,000 | $84 | 32 |
Match score weights: distance 35% · size 25% · config 20% · recency 20%. Top-matched comps best support the ARV.
Projected returns pro-forma
-3.0% appreciation · 3.3% rent growth · sell at horizon
- IRR
- -13.1%
- Equity multiple
- 0.53×
- Total profit
- $-11,235
- Equity at exit
- $12,659
- IRR
- -3.6%
- Equity multiple
- 0.76×
- Total profit
- $-5,730
- Equity at exit
- $7,341
Cash invested: $23,772 (down + closing). Projections, not guarantees.
Landlord ↔ Tenant lean methodology
- Overall (STATE)
- 73 Landlord-Friendly
- State Ohio
- 73 Landlord-Friendly · R+6
- County
- — inherits STATE
- City
- — inherits STATE
ZIP-level market 43613
- Home prices YoY
- -20.7%
- Rents YoY
- 3.3%
- Active inventory
- 111
- Price-to-rent
- 8.5×
Monthly cashflow live
- Estimated rent
- $829 high interval (Pro) →
- Mortgage (P&I)
- −$445
- Tax from tax record
- −$139 /mo · $1,672/yr
- Insurance
- −$35
- HOA
- −$0
- Vacancy / Maint / Mgmt
- −$174
- Net cashflow
- $35
Break-even live
UW: 25.0% down · 7.5% · 30yr · 1.5% tax · 5.0% vac · 8.0% maint · 8.0% mgmt
Financing live
Cash to close
- Down payment
- $21,225
- Closing costs
- $2,547
- Reserves months
- —
- Total cash needed
- —
Loan-product check · same deal, 3 products live
Conventional
25% down · 7.5% · 30yr
- Down + closing
- —
- Monthly P&I
- —
- Monthly cashflow
- —
- DSCR
- —
- Eligible?
- —
Personal DTI + credit; lowest rate.
DSCR
20% down · 8.5% · 30yr
- Down + closing
- —
- Monthly P&I
- —
- Monthly cashflow
- —
- DSCR
- —
- Eligible?
- —
No personal income docs; deal must DSCR.
Hard money
10% down · 12.0% · 12mo
- Down + closing
- —
- Monthly P&I
- —
- Monthly cashflow
- —
- DSCR
- —
- Eligible?
- —
Short-term bridge; refi at stabilization.
Rent comps 27 comps
| Address | Beds | Baths | Sqft | Rent | $/sqft | DOM | Units | Dist |
|---|---|---|---|---|---|---|---|---|
| 3070 Carskaddon Ave Toledo, OH | 1.0–2.0 | 1.0 | 805 | $850 | $1.06 | 13d | 1 | 0.36mi |
| 4137 Secor Rd Toledo, OH | 1.0–2.0 | 1.0 | 750 | $818 | $1.09 | 13d | 7 | 0.43mi |
| 3045 Ilger Ave Toledo, OH | 1.0–2.0 | 1.0 | 585 | $709 | $1.21 | 13d | 8 | 0.54mi |
| 3519 Secor Rd Toledo, OH | 1.0–2.0 | 1.0 | 728 | $775 | $1.06 | 13d | 5 | 0.57mi |
| 3640 Douglas Rd Toledo, OH | 1.0 | 1.0 | 720 | $784 | $1.09 | 43d | 1 | 0.79mi |
| 3010 W Central Ave #108 Toledo, OH | — | 1.0 | 500 | $735 | $1.47 | 43d | 1 | 0.81mi |
| 3433 Douglas Rd Unit 3 Toledo, OH | 1.0 | 1.0 | 750 | $755 | $1.01 | 13d | 1 | 0.86mi |
| 2956 Central Ave Toledo, OH | 1.0 | 1.0 | 747 | $1,235 | $1.65 | 13d | 1 | 0.87mi |
| 4103 Harvest Ln Toledo, OH | 1.0 | 1.0 | 590 | $745 | $1.26 | 43d | 2 | 0.89mi |
| 4109 Harvest Ln Toledo, OH | 2.0 | 1.0 | 750 | $1,195 | $1.59 | 13d | 1 | 0.91mi |
| 3838 W Sylvania Ave Toledo, OH | 1.0–2.0 | 1.0 | 725 | $995 | $1.37 | 13d | 2 | 0.91mi |
| 4060 Royer Rd Toledo, OH | 1.0 | 1.0 | 515 | $725 | $1.41 | 43d | 1 | 0.97mi |
| 4040 Royer Rd Unit 37 Toledo, OH | 1.0 | 1.0 | 515 | $756 | $1.47 | 43d | 1 | 0.97mi |
| 4040 Royer Rd Unit 34 Toledo, OH | 1.0 | 1.0 | 515 | $725 | $1.41 | 43d | 1 | 0.97mi |
| 4050 Royer Rd Toledo, OH | 1.0 | 1.0 | 515 | $756 | $1.47 | 43d | 1 | 0.97mi |
| 3355 W Laskey Rd Toledo, OH | 2.0 | 1.0 | 750 | $850 | $1.13 | 13d | 2 | 1.18mi |
| 3355 W Laskey Rd Apt 24 Toledo, OH | 2.0 | 1.0 | 750 | $850 | $1.13 | 23d | 1 | 1.18mi |
| 3160 Matson Apt 27 Toledo, OH | 1.0 | 1.0 | 567 | $725 | $1.28 | 21d | 1 | 1.25mi |
| 3150 Matson Unit 17 Toledo, OH | 1.0 | 1.0 | 567 | $799 | $1.41 | 21d | 1 | 1.25mi |
| 4836 Douglas Rd Unit 6 Toledo, OH | 1.0 | 1.0 | 600 | $695 | $1.16 | 23d | 1 | 1.26mi |
| 2650 Christie St Toledo, OH | 1.0–2.0 | 1.0 | 800 | $749 | $0.94 | 43d | 1 | 1.28mi |
| 2027 Berkshire Pl Toledo, OH | 2.0 | 1.0 | 600 | $845 | $1.41 | 23d | 1 | 1.30mi |
| 5080 Secor Rd Toledo, OH | 1.0–2.0 | 1.0–1.5 | 699 | $750 | $1.07 | 43d | 1 | 1.30mi |
| 4912 Douglas Rd Unit 2459-2F Toledo, OH | 1.0 | 1.0 | 495 | $650 | $1.31 | 43d | 1 | 1.31mi |
| 2704 Kenwood Blvd Toledo, OH | 1.0–3.0 | 1.0 | 825 | $903 | $1.09 | 13d | 71 | 1.34mi |
| 2255 W Laskey Rd Unit 14 Toledo, OH | 2.0 | 1.0 | 650 | $775 | $1.19 | 21d | 1 | 1.50mi |
| 2255 W Laskey Rd Apt 10 Toledo, OH | 2.0 | 1.0 | 650 | $775 | $1.19 | 13d | 1 | 1.50mi |
Listing history 5 events
-
2026-05-23historical $84,900
-
2025-10-09price $71,500 139-char remark
Show marketing remark (139 chars)
GREAT VALUE * SQ FOOTAGE ON RECORD DOES NOT INCLUED 2 FINISHED ROOMS UP * EXTRA STORAGE * GFA/CA * CLEAN AS CAN BE * A GREAT STARTER HOUSE!
-
2004-04-05soldstatus $71,500
-
2004-03-31soldstatus $71,500 139-char remark
Show marketing remark (139 chars)
GREAT VALUE * SQ FOOTAGE ON RECORD DOES NOT INCLUED 2 FINISHED ROOMS UP * EXTRA STORAGE * GFA/CA * CLEAN AS CAN BE * A GREAT STARTER HOUSE!
-
2003-12-11$79,900 139-char remark
Show marketing remark (139 chars)
GREAT VALUE * SQ FOOTAGE ON RECORD DOES NOT INCLUED 2 FINISHED ROOMS UP * EXTRA STORAGE * GFA/CA * CLEAN AS CAN BE * A GREAT STARTER HOUSE!
ⓘ Source: listings_history table (triggers on properties + properties_extension) + one-shot
backfill from property_details.listing_events for pre-trigger history.
Tax reassessment forecast OH · Partial reset (capped growth)
- Current annual tax
- $1,672 · $139/mo
- Projected year-2 tax
- $1,672 · $139/mo
- Expected delta
- $0/yr ($0/mo · 0.0%)
ⓘ Screening estimate from a state-policy table — verify with the county assessor before closing.
Climate risk First Street
- Flood 1/10 Low FEMA zone X (unshaded) · 0% chance over 30 yrs
- Wildfire 1/10 Low
- Heat 3/10 Moderate 7 d/yr ≥100°F today · 16 d/yr by 30 yrs out
- Wind 2/10 Low
- Air quality 2/10 Low 1 unhealthy d/yr today · 3 by 30 yrs out
Nearby sold comps map
Loading sold comps map…
Walkable amenities ~0.75 mi
Loading nearby amenities…
Taxation est. · year 1
- Rental income
- $9,951
- − Mortgage interest
- −$4,756
- − Property taxes
- −$1,672
- − Insurance
- −$424
- − Repairs & maintenance
- −$796
- − Management
- −$796
- − Depreciation
- −$2,470
- Taxable loss
- −$963
- Est. tax savings @ 24.0%
- +$231
- After-tax cash flow
- $653/yr
For passive investors: Depreciation is non-cash, so a rental often shows a tax loss while cash-flowing — sheltering income. Rental losses are passive: they offset passive income freely, and up to $25,000/yr can offset ordinary (W-2) income if you actively participate and your MAGI is under $100k (phasing out to $0 by $150k); unused losses carry forward. On sale, claimed depreciation is recaptured at up to 25%, and gains may owe capital-gains tax (a 1031 exchange can defer both). Figures are a year-1 estimate at your 24.0% rate — not tax advice; consult a CPA.
Schools (NCES district)
- District
- Toledo City
- NCES district ID
- 3904490
- Math proficiency
- 15% ▼ -16.00%
- Reading proficiency
- 24% ▼ -13.00%
- Median HH income
- $32,137
- Composite
- 15.76/100
- National rank
- #9276
- State rank
- #634 of 656 in OH
Livability — Toledo
- Score
- 66/100
- State rank
- #645
- US rank
- #11442
Category grades
Schools grade is shown separately in the Schools card above.
Census & demographics
- Census place
- Toledo, OH
- County
- Lucas County · 380,724 people
- City population
- 280,811
- Metro
- Toledo, OH
- Population (ZIP)
- 30,780
- Household income
- $64,384
- Rent vs Own
- Severe rent burden
- 917.0
Population outlook (Lucas County) Hauer SSP2
- Today (2025)
- 420,751 people
- By 2030
- 410,187 · -2.5%
- By 2040
- 384,019 · -8.7%
- By 2050
- 355,125 · -15.6%
- By 2075
- 291,683 · -30.7%
- By 2100
- 233,670 · -44.5%
Race, ethnicity, and origin ACS 2023
- Neighborhood character
- Predominantly White (71%)
- Race & ethnicity
- White 71% Black 15% Two or more races 10% Hispanic / Latino 7%
- Hispanic origin (detail)
- Mexican 5%
- Common ancestry
- Romanian 9% Lithuanian 3% Slovak 1%
- Foreign-born
- 2% · Canada
- Languages at home
- 95% English-only · Spanish 3% Arabic 1%
Political lean MEDSL · Lucas
- 2024 margin
- D (+12.6) · D 55.8% · R 43.2%
- 2008→2024 swing
- -18.9pp toward R · 2008: 31.4pp · 2024: 12.6pp
- All cycles
- 2024: D+12.6 2020: D+16.8 2016: D+17.4 2012: D+30.4 2008: D+31.4
Not yet ingested
- Civics
- —
Market trends
- HPI YoY
- ▼ -62.37%
- Current HPI
- 239.1345
- Rent YoY
- ▲ 3.30%
- Metro
- Toledo, OH
- State GDP YoY
- ▲ 1.98%
- F500 in state
- 48
Industry mix (Fortune 500 HQ in OH)
| Industry | F500 HQs | Revenue |
|---|---|---|
| Insurance | 3 | $145B |
|
||
| Industrial Machinery | 3 | $49B |
|
||
| Financial Services | 3 | $24B |
|
||
| Consumer Goods | 2 | $93B |
|
||
| Aerospace / Defense | 2 | $47B |
|
||
| Utilities | 2 | $33B |
|
||
Price history
+6.3% since first listed5 events — show timeline
- 2026-05-23 Coming Soon $84,900 NORIS
- 2025-10-09 Price Changed $71,500 NORIS
- 2004-04-05 Sold (Public Records) $71,500 Public Records
- 2004-03-31 Sold (MLS) $71,500 NORIS
- 2003-12-11 Listed $79,900 NORIS
Property tax history
+2.2%/yrLatest (2025): $1,672 · +0.4% YoY. Source: county tax records.
Cash-flow waterfall
monthlySold comps — $/sqft
last 12 mo · ≤1 miLoading sold comps…