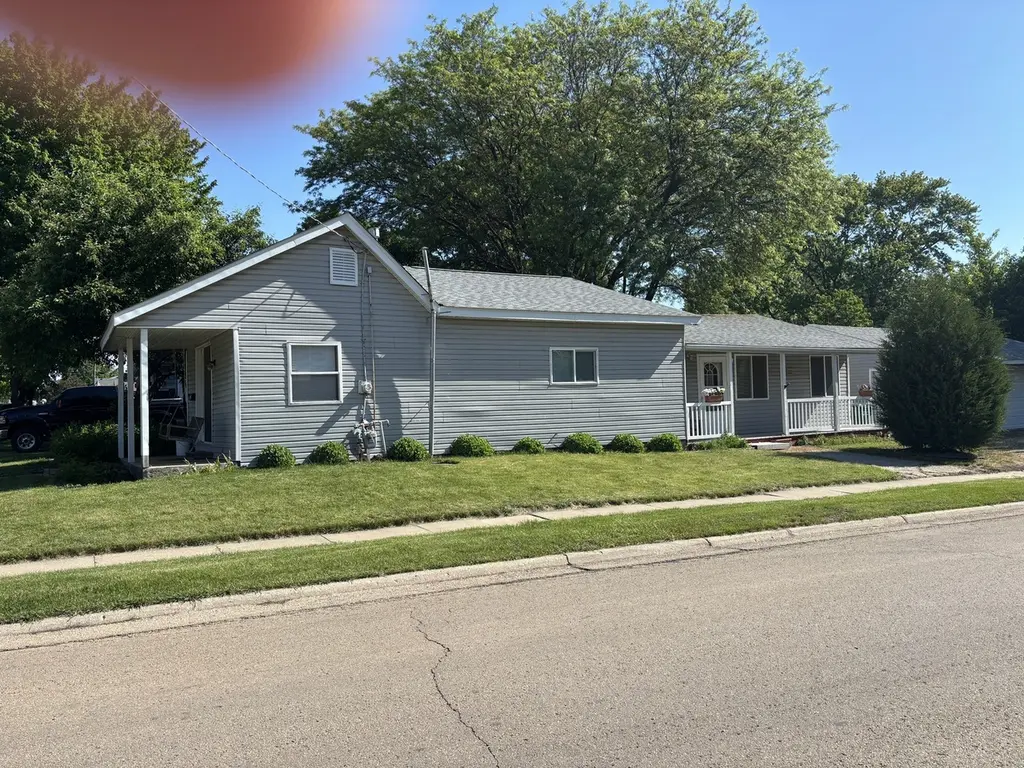
1701 Lincoln Ave · Mendota, IL
Flood risk 1/10 · Minimal
- FEMA flood zone
- X (unshaded)
- Chance of flooding over 30 yrs
- 0.0%
- Est. flood insurance / yr
- $473 – $860
Fire risk 1/10 · Minimal
- Est. fire insurance / yr
- $804 – $1,492
Heat risk 2/10 · Minimal
- Hot days now (above 102°F)
- 7 days/yr
- Hot days in 30 yrs
- 16 days/yr
Wind risk 2/10 · Minimal
- Chance of severe wind over 30 yrs
- 1.0%
Air-quality risk 2/10 · Minimal
- Unhealthy air days now
- 1 days/yr
- Unhealthy air days in 30 yrs
- 2 days/yr
Risk factors via First Street. Map © Google.
Why this score? — see what drove the D+ grade
The composite is a weighted blend of 9 inputs, each scored 0–100. Each bar is that input's sub-score; the figure is the points it added to the 100-point composite (weight × sub-score).
- ARV discount +15.0/15.0
- Cash flow +14.8/30.0
- DSCR +4.5/10.0
- 1% rule +3.8/10.0
- Livability +3.5/5.0
- Schools +2.9/10.0
- Rent growth +2.5/5.0
- Condition / age +2.5/5.0
- Appreciation +0.0/10.0
$137,000
🖨 Deal sheet 📄 Offer letter ✓ Due diligence
Listing remarks MLS
Welcome Cash and Conventional Financing! Featuring a 2+ Car Garage with Cement Floor. With a little TLC this Ranch with 3 Bedrooms, Large Kitchen, Large Living Room and Bonus Room will make a NICE Starter home or Investment Property! CALL US TODAY! Seller Selling "AS IS"
Key facts
- 7,500 sq ft lot
- 2 garage spots
- Built 1913
Property features AI
Finance
- Other: Living area source: Assessor; Built before 1978; Parcel number on file
- HOA & community: No master association fee required
Exterior
- Parking: Detached garage (listed as 2.5 garage/parking spaces total)
- Utilities: Public water; Public sewer
- Home design: Detached single-family home; One-story; Fee simple ownership; Rehab completed in 2019; Home is over 100 years old; Vinyl siding
- Construction: Vinyl siding construction
- Exterior features: Lot approximately 50 x 150; Lot less than 0.25 acre
Interior
- Kitchen: Main-level kitchen approximately 17 x 20
- Bedrooms: 3 bedrooms (all on the main level); Master bedroom on the main level with a half bath access; Bedroom 2 (main level) approximately 9 x 13; Bedroom 3 (main level) approximately 8 x 9; Additional bedroom listed (dimensions not provided)
- Bathrooms: 1 full bathroom; 1 half bathroom
- Heating & cooling: Natural gas heating; Central air conditioning
- Interior features: Six total rooms; Partial cellar basement
- Laundry & utility: Laundry room
Neighborhood map
What this means for you Summary
Snapshot
- This is a 3-bed/1.5-bath single-family listed at $137k.
Deal economics
- At list price, monthly cash flow is $38 ($458/yr) — positive.
- The deal already cash-flows at list — no discount required.
- To meet the 1% rule (rent ≥ 1% of price), the offer needs to be $121k (12.0% below list).
- Recommended offer: $121k (12.0% below list) — sets the bar for 1% rule.
- Cap rate 6.6% vs local median 4.8% in Mendota — top-decile yield for the area; either an underpriced asset or a hidden risk that comps aren't pricing in. Stress-test before assuming the spread holds.
Location & tenants
- Location reads 69/100 on livability (#425 in IL) — a middle-class / working-renter tenant base. Strengths: crime A+, cost of living A+, housing A; Watch: health & safety C-, amenities F, commute F.
- Mendota Twp Hsd 280 (rural): math 30% / reading 30% proficiency, ranked #474 of 919 in IL (top 52%) — families likely to look elsewhere, expect single-tenant / working-renter base with shorter leases.
- Zoned schools: Mendota Twp High School (math 22% / reading 17%, grade F, #397 of 693 statewide, top 61%, 493 students, 0% FRL).
- Market conditions: 30 active listings in the ZIP; 82 units permitted in LaSalle County in 2024 (0 in 5+ unit buildings).
Forward outlook
- Local home prices are declining (-3.0%/yr); year-one equity from $947 of loan paydown is wiped out by about $4k of value loss. Plan a longer hold.
- LaSalle County population projected at -16% by 2050 — secular population decline; favor cash flow + early exit over multi-decade hold.
Negotiation context
- It's been on market 25 days — a 2% lower offer ($135k) is reasonable based on typical stale-listing flexibility.
- 2 sale attempts since 9y ago with the ask held roughly flat each time — persistent listings suggest the price (not the market) is what's stuck; bring a comps-based counter.
- Current owner paid $40k; list at $137k implies a 242% gain — meaningful room to come down on a strong offer.
Risks & watch-outs
- Watch-outs: built in 1913 — expect roof / HVAC / electrical / plumbing capex.
Questions for the listing agent
- Built in 1913 — when were the roof, HVAC, electrical panel, plumbing, and water heater last replaced?
- Is there a deadline driving the sale (1031 exchange, divorce, estate, relocation)? That informs how much negotiation room exists.
- Schools are F-rated, which usually means shorter tenancies and higher turnover. Who's the typical renter profile here, and what's been the actual vacancy rate?
- The area grade is low — what's the realistic commute time and amenity access for the typical tenant pool here? Any planned neighborhood developments (good or bad) we should know about?
- What's the average days-on-market for RENTAL listings here right now (not sales)? A rising rental-DOM trend means longer vacancies and softer asking-rent achievability than the comps imply.
- What's the recent tenant-quality profile in this submarket — average credit score on applications, eviction rate, late-payment / NSF rate, and stable-employment percentage? A property-management company in the area should have these aggregated.
- How much new for-sale + rental construction is in the pipeline within 1–3 miles? Heavy new supply typically softens prices + rents 12–24 months out; constrained supply supports both.
Investment metrics
- 1% rule
- 0.88% ✗
- Cap rate
- 6.63%
- Cash-on-cash
- 1.19%
- DSCR
- 1.05
- GRM
- 9.5
CMA / ARV
- ARV (on-the-fly)
- $179,820
- Comps found
- 12
Show comp detail 12 sales within ~0.75 mi
| Address | Dist | Beds/Ba | Sqft | Sold | Price | $/sf | Match |
|---|---|---|---|---|---|---|---|
| 209 16th St | 0.06mi | 3/1.0 | 1,311 (-2%) | 2mo | $157,500 | $120 | 90 |
| 403 16th St | 0.10mi | 3/2.0 | 1,300 (-2%) | 6mo | $120,000 | $92 | 84 |
| 202 15th St | 0.09mi | 3/2.0 | 1,232 (-8%) | 16mo | $178,000 | $144 | 68 |
| 1503 Illinois Ave | 0.35mi | 3/1.0 | 1,300 (-2%) | 12mo | $175,000 | $135 | 68 |
| 1700 Sunset Dr | 0.52mi | 3/1.5 | 1,328 (-0%) | 10mo | $219,000 | $165 | 66 |
| 2012 Gwendolyn Ave | 0.46mi | 3/2.0 | 1,360 (+2%) | 14mo | $269,900 | $198 | 61 |
| 2106 Cedar Ave | 0.55mi | 3/1.5 | 1,260 (-5%) | 6mo | $242,000 | $192 | 60 |
| 501 10th St | 0.47mi | 3/2.5 | 1,350 (+1%) | 15mo | $143,000 | $106 | 60 |
| 1011 Chicago St | 0.69mi | 3/2.0 | 1,408 (+6%) | 11mo | $202,500 | $144 | 47 |
| 1102 Oak Ct | 0.66mi | 3/1.5 | 1,183 (-11%) | 8mo | $129,000 | $109 | 44 |
| 1202 Main St | 0.47mi | 3/2.0 | 1,518 (+14%) | 18mo | $115,000 | $76 | 37 |
| 908 Monroe St | 0.73mi | 3/1.5 | 1,216 (-9%) | 20mo | $75,000 | $62 | 35 |
Match score weights: distance 35% · size 25% · config 20% · recency 20%. Top-matched comps best support the ARV.
Projected returns pro-forma
-3.0% appreciation · 3.0% rent growth · sell at horizon
- IRR
- -14.4%
- Equity multiple
- 0.48×
- Total profit
- $-19,771
- Equity at exit
- $20,427
- IRR
- -5.7%
- Equity multiple
- 0.63×
- Total profit
- $-14,094
- Equity at exit
- $11,845
Cash invested: $38,360 (down + closing). Projections, not guarantees.
Landlord ↔ Tenant lean methodology
- Overall (STATE)
- 43 Moderately Tenant-Leaning
- State Illinois
- 43 Moderately Tenant-Leaning · D+7
- County
- — inherits STATE
- City
- — inherits STATE
ZIP-level market 61342
- Home prices YoY
- -14.8%
- Active inventory
- 30
- Price-to-rent
- 9.5×
Monthly cashflow live
- Estimated rent
- $1,205 medium interval (Pro) →
- Mortgage (P&I)
- −$718
- Tax from tax record
- −$138 /mo · $1,662/yr
- Insurance
- −$57
- HOA
- −$0
- Vacancy / Maint / Mgmt
- −$253
- Net cashflow
- $38
Break-even live
UW: 25.0% down · 7.5% · 30yr · 1.5% tax · 5.0% vac · 8.0% maint · 8.0% mgmt
Financing live
Cash to close
- Down payment
- $34,250
- Closing costs
- $4,110
- Reserves months
- —
- Total cash needed
- —
Loan-product check · same deal, 3 products live
Conventional
25% down · 7.5% · 30yr
- Down + closing
- —
- Monthly P&I
- —
- Monthly cashflow
- —
- DSCR
- —
- Eligible?
- —
Personal DTI + credit; lowest rate.
DSCR
20% down · 8.5% · 30yr
- Down + closing
- —
- Monthly P&I
- —
- Monthly cashflow
- —
- DSCR
- —
- Eligible?
- —
No personal income docs; deal must DSCR.
Hard money
10% down · 12.0% · 12mo
- Down + closing
- —
- Monthly P&I
- —
- Monthly cashflow
- —
- DSCR
- —
- Eligible?
- —
Short-term bridge; refi at stabilization.
Listing history 21 events
-
2026-06-19days on market $137,000 Active 25 DOM
-
2026-06-18days on market $137,000 Active 24 DOM
-
2026-06-17days on market $137,000 Active 23 DOM
-
2026-06-16days on market $137,000 Active 22 DOM
-
2026-06-15days on market $137,000 Active 21 DOM
-
2026-06-14days on market $137,000 Active 19 DOM
-
2026-06-12days on market $137,000 Active 18 DOM
-
2026-06-09days on market $137,000 Active 15 DOM
-
2026-06-08days on market $137,000 Active 14 DOM
-
2026-06-07days on market $137,000 Active 13 DOM
-
2026-06-03days on market $137,000 Active 9 DOM
-
2026-06-02days on market $137,000 Active 8 DOM
-
2026-06-01days on market $137,000 Active 7 DOM
-
2026-05-31days on market $137,000 Active 6 DOM
-
2026-05-30days on market $137,000 Active 5 DOM
-
2026-05-25$137,000 Active
-
2017-09-15soldstatus $40,000 Closed Sale 281-char remark
Show marketing remark (281 chars)
Welcome Cash and Conventional Financing! Featuring a 2+ Car Garage with Cement Floor. With a little TLC this Ranch with 3 Bedrooms, Large Kitchen, Large Living Room and Bonus Room will make a NICE Starter home or Investment Property! CALL US TODAY! Seller Selling "AS IS"
-
2017-08-24historical Contingent 281-char remark
Show marketing remark (281 chars)
Welcome Cash and Conventional Financing! Featuring a 2+ Car Garage with Cement Floor. With a little TLC this Ranch with 3 Bedrooms, Large Kitchen, Large Living Room and Bonus Room will make a NICE Starter home or Investment Property! CALL US TODAY! Seller Selling "AS IS"
-
2017-08-10price $47,500 281-char remark
Show marketing remark (281 chars)
Welcome Cash and Conventional Financing! Featuring a 2+ Car Garage with Cement Floor. With a little TLC this Ranch with 3 Bedrooms, Large Kitchen, Large Living Room and Bonus Room will make a NICE Starter home or Investment Property! CALL US TODAY! Seller Selling "AS IS"
-
2017-07-11price $49,900 281-char remark
Show marketing remark (281 chars)
Welcome Cash and Conventional Financing! Featuring a 2+ Car Garage with Cement Floor. With a little TLC this Ranch with 3 Bedrooms, Large Kitchen, Large Living Room and Bonus Room will make a NICE Starter home or Investment Property! CALL US TODAY! Seller Selling "AS IS"
-
2017-06-12$55,000 New 281-char remark
Show marketing remark (281 chars)
Welcome Cash and Conventional Financing! Featuring a 2+ Car Garage with Cement Floor. With a little TLC this Ranch with 3 Bedrooms, Large Kitchen, Large Living Room and Bonus Room will make a NICE Starter home or Investment Property! CALL US TODAY! Seller Selling "AS IS"
ⓘ Source: listings_history table (triggers on properties + properties_extension) + one-shot
backfill from property_details.listing_events for pre-trigger history.
Tax reassessment forecast IL · Partial reset (capped growth)
- Current annual tax
- $1,662 · $138/mo
- Projected year-2 tax
- $2,386 · $199/mo
- Expected delta
- +$724/yr (+$60/mo · 43.6%)
ⓘ Screening estimate from a state-policy table — verify with the county assessor before closing.
Climate risk First Street
- Flood 1/10 Low FEMA zone X (unshaded) · 0% chance over 30 yrs
- Wildfire 1/10 Low
- Heat 2/10 Low 7 d/yr ≥102°F today · 16 d/yr by 30 yrs out
- Wind 2/10 Low 100% chance of damaging wind over 30 yrs
- Air quality 2/10 Low 1 unhealthy d/yr today · 2 by 30 yrs out
Nearby sold comps map
Loading sold comps map…
Walkable amenities ~0.75 mi
Loading nearby amenities…
Taxation est. · year 1
- Rental income
- $14,463
- − Mortgage interest
- −$7,674
- − Property taxes
- −$1,662
- − Insurance
- −$685
- − Repairs & maintenance
- −$1,157
- − Management
- −$1,157
- − Depreciation
- −$3,985
- Taxable loss
- −$1,857
- Est. tax savings @ 24.0%
- +$446
- After-tax cash flow
- $904/yr
For passive investors: Depreciation is non-cash, so a rental often shows a tax loss while cash-flowing — sheltering income. Rental losses are passive: they offset passive income freely, and up to $25,000/yr can offset ordinary (W-2) income if you actively participate and your MAGI is under $100k (phasing out to $0 by $150k); unused losses carry forward. On sale, claimed depreciation is recaptured at up to 25%, and gains may owe capital-gains tax (a 1031 exchange can defer both). Figures are a year-1 estimate at your 24.0% rate — not tax advice; consult a CPA.
Schools (NCES district)
- District
- Mendota Twp Hsd 280
- NCES district ID
- 1725650
- Math proficiency
- 30% ▲ 5.00%
- Reading proficiency
- 30% ▲ 5.00%
- Median HH income
- $53,522
- Composite
- 29.37/100
- National rank
- #11816
- State rank
- #474 of 919 in IL
Livability — Mendota
- Score
- 69/100
- State rank
- #425
- US rank
- #8707
Category grades
Schools grade is shown separately in the Schools card above.
Census & demographics
- Census place
- Mendota, IL
- Population (ZIP)
- 8,373
Population outlook (LaSalle County) Hauer SSP2
- Today (2025)
- 107,080 people
- By 2030
- 104,196 · -2.7%
- By 2040
- 97,413 · -9.0%
- By 2050
- 90,294 · -15.7%
- By 2075
- 76,252 · -28.8%
- By 2100
- 61,339 · -42.7%
Race, ethnicity, and origin ACS 2023
- Neighborhood character
- Predominantly White (72%)
- Race & ethnicity
- White 72% Hispanic / Latino 24% Two or more races 5%
- Hispanic origin (detail)
- Mexican 21% Puerto Rican 3%
- Common ancestry
- Romanian 3% Portuguese 2% Slovak 2%
- Foreign-born
- 7% · Canada
- Languages at home
- 81% English-only · Spanish 17% German/W. Germanic 1% Chinese 1%
Political lean MEDSL · LaSalle
- 2024 margin
- R (+18.5) · D 40.1% · R 58.6% · Other 1.3%
- 2008→2024 swing
- -29.6pp toward R · 2008: 11.1pp · 2024: -18.5pp
- All cycles
- 2024: R+18.5 2020: R+14.3 2016: R+14.4 2012: R+0.4 2008: D+11.1
Not yet ingested
- Civics
- —
Market trends
- HPI YoY
- ▼ -30.79%
- Current HPI
- 177.6371
- Rent YoY
- —
- Metro
- —
- State GDP YoY
- ▲ 1.59%
- F500 in state
- 60
Industry mix (Fortune 500 HQ in IL)
| Industry | F500 HQs | Revenue |
|---|---|---|
| Insurance | 4 | $201B |
|
||
| Consumer Goods | 4 | $87B |
|
||
| Industrial Machinery | 3 | $64B |
|
||
| Healthcare | 2 | $55B |
|
||
| Retail / Pharmacy | 1 | $148B |
|
||
| Agriculture / Food | 1 | $86B |
|
||
Price history
+149.1% since first listed6 events — show timeline
- 2026-05-25 Listed $137,000 MRED as Distributed by MLS Grid
- 2017-09-15 Sold (MLS) $40,000 MRED as Distributed by MLS Grid
- 2017-08-24 Contingent — MRED as Distributed by MLS Grid
- 2017-08-10 Price Changed $47,500 MRED as Distributed by MLS Grid
- 2017-07-11 Price Changed $49,900 MRED as Distributed by MLS Grid
- 2017-06-12 Listed $55,000 MRED as Distributed by MLS Grid
Property tax history
-0.4%/yrLatest (2024): $1,662 · +4.4% YoY. Source: county tax records.
Cash-flow waterfall
monthlySold comps — $/sqft
last 12 mo · ≤1 miLoading sold comps…