8 Taylor St · Fairview, GA
Flood risk 1/10 · Minimal
- FEMA flood zone
- X (unshaded)
- Chance of flooding over 30 yrs
- 0.0%
- Est. flood insurance / yr
- $473 – $860
Fire risk 4/10 · Minor
- Est. fire insurance / yr
- $963 – $1,789
Heat risk 5/10 · Moderate
- Hot days now (above 104°F)
- 7 days/yr
- Hot days in 30 yrs
- 19 days/yr
Wind risk 4/10 · Minor
- Chance of severe wind over 30 yrs
- 13.0%
Air-quality risk 3/10 · Minor
- Unhealthy air days now
- 2 days/yr
- Unhealthy air days in 30 yrs
- 2 days/yr
Risk factors via First Street. Map © Google.
Why this score? — see what drove the D+ grade
The composite is a weighted blend of 9 inputs, each scored 0–100. Each bar is that input's sub-score; the figure is the points it added to the 100-point composite (weight × sub-score).
- Cash flow +15.7/30.0
- ARV discount +13.1/15.0
- DSCR +4.9/10.0
- Rent growth +4.4/5.0
- 1% rule +3.9/10.0
- Livability +2.9/5.0
- Condition / age +2.5/5.0
- Schools +2.3/10.0
- Appreciation +0.0/10.0
$154,500
🖨 Deal sheet (PDF) 📄 Offer letter ✓ Due diligence
Listing remarks
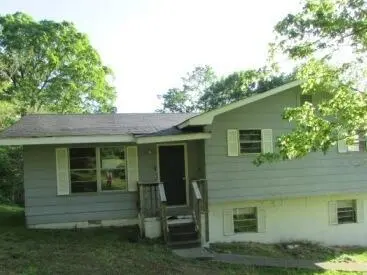
Single family split level home offering approximately 1082 sq ft, 3 Bedrooms, 2 full and 1 half bath, built in 1974 and situated on . 47 acres. This home features a living room, eat-in kitchen, and just 2 stairs up from the main level is the owners bedroom with en-suite bath, 2 additional bedrooms and full hall bath. Step downstairs to the basement where there is ample room for a den or recreation room with fireplace, half bath and laundry. This lovely spot is located just minutes to Fort Oglethorpe, and about 15 minutes from DT Chattanooga. Make your appointment for your private showing today. HUD home Case #106-448306. HUD homes are sold AS-IS. Earnest money deposit in the form of a cash
Key facts
- 0.47 acre lot
- Built 1974
- Listed 55 days
Property features AI
Finance
- Financial info: Tax information provided
- HOA & community: No community features listed
Exterior
- Parking: Driveway; Off-street paved parking
- Utilities: Public water; Septic tank sewer; Cable available; Electricity available; Phone available
- Home design: Single family residence; Three or more levels
- Construction: Frame and other construction materials; Block foundation; Shingle roof; Year built: Not provided
- Exterior features: Deck; Patio
Interior
- Kitchen: Oven; Free-standing electric range
- Bedrooms: Total rooms: 6
- Flooring: Carpet; Laminate
- Bathrooms: 2 full bathrooms; 1 half bathroom
- Heating & cooling: Central heating (electric); Central air conditioning (electric)
- Interior features: Aluminum frame windows; Finished basement; Basement fireplace
- Laundry & utility: Washer hookup; Electric dryer hookup; Gas dryer hookup
Neighborhood map
What this means for you Summary
Snapshot
- This is a 3-bed/2.5-bath single-family listed at $154k.
Deal economics
- At list price, monthly cash flow is $69 ($831/yr) — positive.
- The deal already cash-flows at list — no discount required.
- To meet the 1% rule (rent ≥ 1% of price), the offer needs to be $138k (10.5% below list).
- Recommended offer: $138k (10.5% below list) — sets the bar for 1% rule.
- Cap rate 6.8% vs local median 4.9% in Fairview — top-decile yield for the area; either an underpriced asset or a hidden risk that comps aren't pricing in. Stress-test before assuming the spread holds.
Location & tenants
- Location reads 58/100 on livability (#440 in GA) — a working-class tenant base; expect higher turnover. Strengths: cost of living A+, housing A+; Watch: employment D+, amenities F, commute F.
- Walker County (rural): math 25% / reading 29% proficiency, ranked #114 of 174 in GA (top 66%) — low school quality limits family demand, transient renter base, plan for 1-2y turnover; 61% free/reduced lunch — lower-income household profile, screen leases tightly.
- Zoned schools: Stone Creek Elementary School (math 22% / reading 22%, grade F, #810 of 1,228 statewide, top 69%, 425 students, 84% FRL); Rossville Middle School (math 13% / reading 25%, grade F, #368 of 470 statewide, top 79%, 444 students, 81% FRL); Ridgeland High School (math 23% / reading 19%, grade F, #225 of 424 statewide, top 54%, 1,244 students, 70% FRL) — zoned schools average 78% FRL vs 61% district-wide (17 pts higher); higher-poverty schools than district average — tighter screening recommended.
- Market conditions: Rents rising fast (+7.4%/yr); 430 active listings in the ZIP; 12 comparable units currently listed for rent nearby; rentals lingering (median 46d on market — plan ~5-8 weeks vacancy on turnover, expect pricing pressure); 50% of comp listings sitting > 30 days — soft ceiling on asking rent; 347 units permitted in Walker County in 2024 (24 in 5+ unit buildings).
Forward outlook
- Local home prices are declining (-3.0%/yr); year-one equity from $1k of loan paydown is wiped out by about $5k of value loss. Plan a longer hold.
- Walker County population projected at -16% by 2050 — secular population decline; favor cash flow + early exit over multi-decade hold.
Negotiation context
- It's been on market 55 days — a 3% lower offer ($150k) is reasonable based on typical stale-listing flexibility.
- 9 sale attempts since 25y ago; this cycle's ask has dropped $47k (23%) from the opening price — seller is motivated, your offer sets the floor, not the list.
- Current owner paid $125k; 24% above their basis — modest negotiation headroom, anchor on the comps not their cost.
Risks & watch-outs
- Climate carrying-cost: extreme-heat days projected 7→19/yr by 2055 (HVAC capex compounding) — expect insurance premiums to compound above CPI over the hold.
Questions for the listing agent
- It's been on market 55 days. Have you received any prior offers? Is the seller open to a 11% concession, seller financing, or rate buy-down credit?
- Built in 1974 — when were the roof, HVAC, electrical panel, plumbing, and water heater last replaced?
- Is there a deadline driving the sale (1031 exchange, divorce, estate, relocation)? That informs how much negotiation room exists.
- Schools are F-rated, which usually means shorter tenancies and higher turnover. Who's the typical renter profile here, and what's been the actual vacancy rate?
- The area grade is low — what's the realistic commute time and amenity access for the typical tenant pool here? Any planned neighborhood developments (good or bad) we should know about?
- What's the average days-on-market for RENTAL listings here right now (not sales)? A rising rental-DOM trend means longer vacancies and softer asking-rent achievability than the comps imply.
- What's the recent tenant-quality profile in this submarket — average credit score on applications, eviction rate, late-payment / NSF rate, and stable-employment percentage? A property-management company in the area should have these aggregated.
- How much new for-sale + rental construction is in the pipeline within 1–3 miles? Heavy new supply typically softens prices + rents 12–24 months out; constrained supply supports both.
Investment metrics
- 1% rule
- 0.89% ✗
- Cap rate
- 6.83%
- Cash-on-cash
- 1.92%
- DSCR
- 1.09
- GRM
- 9.3
CMA / ARV
- ARV (median comp)
- $176,620
- List price
- $154,500
- Delta
- -12.52%
- Verdict
- UNDERPRICED
- Comps
- 20 within 1.0 mi
Show comp detail 12 sales within ~0.75 mi
| Address | Dist | Beds/Ba | Sqft | Sold | Price | $/sf | Match |
|---|---|---|---|---|---|---|---|
| 843 Schmitt Rd | 0.34mi | 3/2.0 | 1,658 (-1%) | 2mo | $240,000 | $145 | 78 |
| 75 Battle Bluff Dr | 0.56mi | 3/2.0 | 1,758 (+4%) | 3mo | $278,000 | $158 | 62 |
| 2006 Rogers Rd | 0.58mi | 3/2.0 | 1,672 (-1%) | 11mo | $279,900 | $167 | 60 |
| 820-B Park City Rd | 0.41mi | 3/2.0 | 1,524 (-9%) | 8mo | $229,000 | $150 | 57 |
| 820 Park City Rd | 0.43mi | 3/2.0 | 1,524 (-9%) | 8mo | $229,000 | $150 | 56 |
| 39 Dragoon Ct | 0.52mi | 3/2.0 | 1,519 (-10%) | 3mo | $300,000 | $197 | 55 |
| 47 Battle Bluff Dr | 0.59mi | 4/2.5 (+1) | 1,800 (+7%) | 4mo | $339,000 | $188 | 52 |
| 88 Campbell St | 0.60mi | 3/2.0 | 1,590 (-6%) | 12mo | $290,000 | $182 | 51 |
| 100 Campbell St | 0.69mi | 3/2.0 | 1,590 (-6%) | 8mo | $279,900 | $176 | 50 |
| 2008 Carol St | 0.58mi | 3/2.0 | 1,824 (+8%) | 11mo | $249,900 | $137 | 48 |
| 112 Hunt St | 0.65mi | 3/2.0 | 1,458 (-13%) | 7mo | $272,500 | $187 | 40 |
| 1625 West Rebel Road Rd | 0.70mi | 3/2.0 | 1,869 (+11%) | 14mo | $345,000 | $185 | 35 |
Match score weights: distance 35% · size 25% · config 20% · recency 20%. Top-matched comps best support the ARV.
Projected returns pro-forma
-3.0% appreciation · 7.44% rent growth · sell at horizon
- IRR
- -8.6%
- Equity multiple
- 0.67×
- Total profit
- $-14,180
- Equity at exit
- $23,036
- IRR
- 5.8%
- Equity multiple
- 1.52×
- Total profit
- $22,323
- Equity at exit
- $13,358
Cash invested: $43,260 (down + closing). Projections, not guarantees.
Landlord ↔ Tenant lean methodology
- Overall (STATE)
- 90 Strongly Landlord-Friendly
- State Georgia
- 90 Strongly Landlord-Friendly · R+3
- County
- — inherits STATE
- City
- — inherits STATE
ZIP-level market 30741
- Home prices YoY
- -30.7%
- Rents YoY
- 7.4%
- Active inventory
- 430
- Price-to-rent
- 9.3×
Monthly cashflow live
- Estimated rent
- $1,382 high interval (Pro) →
- Mortgage (P&I)
- −$810
- Tax from tax record
- −$148 /mo · $1,778/yr
- Insurance
- −$64
- HOA
- −$0
- Vacancy / Maint / Mgmt
- −$290
- Net cashflow
- $69
Break-even live
Sensitivity live
| Price | -10% $157 | -5% $113 | +0% $69 | +5% $26 | +10% $-18 |
|---|---|---|---|---|---|
| Rent | -10% $-40 | -5% $15 | +0% $69 | +5% $124 | +10% $178 |
| Rate | -1.0pp $147 | -0.5pp $109 | base $69 | +0.5pp $29 | +1.0pp $-12 |
UW: 25.0% down · 7.5% · 30yr · 1.5% tax · 5.0% vac · 8.0% maint · 8.0% mgmt
Financing live
Cash to close
- Down payment
- $38,625
- Closing costs
- $4,635
- Reserves months
- —
- Total cash needed
- —
Loan-product check · same deal, 3 products live
Conventional
25% down · 7.5% · 30yr
- Down + closing
- —
- Monthly P&I
- —
- Monthly cashflow
- —
- DSCR
- —
- Eligible?
- —
Personal DTI + credit; lowest rate.
DSCR
20% down · 8.5% · 30yr
- Down + closing
- —
- Monthly P&I
- —
- Monthly cashflow
- —
- DSCR
- —
- Eligible?
- —
No personal income docs; deal must DSCR.
Hard money
10% down · 12.0% · 12mo
- Down + closing
- —
- Monthly P&I
- —
- Monthly cashflow
- —
- DSCR
- —
- Eligible?
- —
Short-term bridge; refi at stabilization.
Rent comps 12 comps
| Address | Beds | Baths | Sqft | Rent | $/sqft | DOM | Units | Dist |
|---|---|---|---|---|---|---|---|---|
| 810 Schmitt Rd Rossville, GA | 2.0 | 1.5 | 1147 | $850 | $0.74 | 45d | 1 | 0.13mi |
| 1945 Barrett Dr Fort Oglethorpe, GA | 4.0 | 2.0 | 1847 | $2,025 | $1.10 | 45d | 1 | 0.84mi |
| 1945 Barrett Dr Fort Oglethorpe, GA | 4.0 | 2.0 | 1847 | $2,025 | $1.10 | 25d | 1 | 0.84mi |
| 106 Champion Rd Rossville, GA | 3.0 | 1.0 | 1104 | $1,675 | $1.52 | 45d | 1 | 0.97mi |
| 106 Champion Rd Rossville, GA | 3.0 | 1.0 | 1104 | $1,675 | $1.52 | 25d | 1 | 0.97mi |
| 403 Barnhardt Cir Fort Oglethorpe, GA | 2.0 | 1.5 | 1000 | $1,225 | $1.23 | 15d | 2 | 0.98mi |
| 301 Corey Cir Fort Oglethorpe, GA | 2.0 | 2.0 | 1100 | $1,300 | $1.18 | 45d | 1 | 1.29mi |
| 704 Corey Cir Fort Oglethorpe, GA | 2.0 | 2.0 | 1100 | $1,300 | $1.18 | 15d | 2 | 1.31mi |
| 110 2nd St Rossville, GA | 3.0 | 2.0 | 1168 | $1,399 | $1.20 | 15d | 1 | 1.34mi |
| 361 Hogan Rd Unit C Rossville, GA | 2.0 | 2.0 | 1210 | $1,295 | $1.07 | 45d | 1 | 1.36mi |
| 11 Carroll Ln Rossville, GA | 4.0 | 2.5 | 1656 | $1,599 | $0.97 | 45d | 1 | 1.45mi |
| 1591 Park City Rd Apt E15 Rossville, GA | 2.0 | 1.0 | 1050 | $1,145 | $1.09 | 25d | 1 | 1.50mi |
Listing history 40 events
-
2026-06-15status $154,500 Pending 55 DOM
-
2026-06-15days on market $154,500 Active 55 DOM
-
2026-06-14days on market $154,500 Active 53 DOM
-
2026-06-13days on market $154,500 Active 52 DOM
-
2026-06-10pricedays on market $154,500 Active 50 DOM
-
2026-06-09days on market $171,500 Active 49 DOM
-
2026-06-08days on market $171,500 Active 48 DOM
-
2026-06-07days on market $171,500 Active 47 DOM
-
2026-06-05days on market $171,500 Active 44 DOM
-
2026-06-03days on market $171,500 Active 43 DOM
-
2026-06-02days on market $171,500 Active 42 DOM
-
2026-06-01days on market $171,500 Active 41 DOM
-
2026-05-31days on market $171,500 Active 40 DOM
-
2026-05-30days on market $171,500 Active 39 DOM
-
2026-05-09price $171,500 1333-char remark
-
2026-04-21$201,700 Active 1333-char remark
-
2024-04-30historical
-
2023-09-01status Pending
-
2023-08-24historical
-
2023-06-16status Pending
-
2023-06-16historical Active Under Contract
-
2023-06-09$149,900 Active
-
2023-06-09$149,900 Active
-
2023-04-27price $169,900
-
2021-05-13soldstatus $125,000
-
2021-03-12soldstatus $125,000 Closed
-
2021-01-22historical
-
2021-01-18status Active
-
2021-01-11historical
-
2021-01-06status Active
-
2020-12-21historical
-
2020-12-12status Active
-
2020-12-08historical
-
2020-12-01price $122,900
-
2020-11-02price $123,900
-
2020-10-21status Active
-
2020-10-19historical
-
2020-10-15$124,900 Active
-
2001-09-21soldstatus $75,500
-
2001-03-21$79,900
ⓘ Source: listings_history table (triggers on properties + properties_extension) + one-shot
backfill from property_details.listing_events for pre-trigger history.
Tax reassessment forecast GA · Resets to sale price
- Current annual tax
- $1,778 · $148/mo
- Projected year-2 tax
- $1,778 · $148/mo
- Expected delta
- $0/yr ($0/mo · 0.0%)
ⓘ Screening estimate from a state-policy table — verify with the county assessor before closing.
Climate risk First Street
- Flood 1/10 Low FEMA zone X (unshaded) · 0% chance over 30 yrs
- Wildfire 4/10 Moderate
- Heat 5/10 Major 7 d/yr ≥104°F today · 19 d/yr by 30 yrs out
- Wind 4/10 Moderate 13% chance of damaging wind over 30 yrs
- Air quality 3/10 Moderate 2 unhealthy d/yr today · 2 by 30 yrs out
Nearby sold comps map
Loading sold comps map…
Walkable amenities ~0.75 mi
Loading nearby amenities…
Taxation est. · year 1
- Rental income
- $16,588
- − Mortgage interest
- −$8,654
- − Property taxes
- −$1,778
- − Insurance
- −$772
- − Repairs & maintenance
- −$1,327
- − Management
- −$1,327
- − Depreciation
- −$4,495
- Taxable loss
- −$1,766
- Est. tax savings @ 24.0%
- +$424
- After-tax cash flow
- $1,255/yr
For passive investors: Depreciation is non-cash, so a rental often shows a tax loss while cash-flowing — sheltering income. Rental losses are passive: they offset passive income freely, and up to $25,000/yr can offset ordinary (W-2) income if you actively participate and your MAGI is under $100k (phasing out to $0 by $150k); unused losses carry forward. On sale, claimed depreciation is recaptured at up to 25%, and gains may owe capital-gains tax (a 1031 exchange can defer both). Figures are a year-1 estimate at your 24.0% rate — not tax advice; consult a CPA.
Schools (NCES district)
- District
- Walker County
- NCES district ID
- 1305370
- Math proficiency
- 25% ▼ -10.00%
- Reading proficiency
- 29% ▼ -10.00%
- Median HH income
- $39,889
- Composite
- 22.74/100
- National rank
- #8035
- State rank
- #114 of 174 in GA
Livability — Fairview
- Score
- 58/100
- State rank
- #440
- US rank
- #21150
Category grades
Schools grade is shown separately in the Schools card above.
Census & demographics
- Census place
- Fairview, GA
- County
- Walker County · 48,831 people
- City population
- 29,236
- Metro
- Chattanooga, TN-GA
- Population (ZIP)
- 30,041
- Household income
- $58,834
- Rent vs Own
- Severe rent burden
- 834.0
Population outlook (Walker County) Hauer SSP2
- Today (2025)
- 66,050 people
- By 2030
- 64,305 · -2.6%
- By 2040
- 60,127 · -9.0%
- By 2050
- 55,551 · -15.9%
- By 2075
- 44,886 · -32.0%
- By 2100
- 34,015 · -48.5%
Race, ethnicity, and origin ACS 2023
- Neighborhood character
- Predominantly White (86%)
- Race & ethnicity
- White 86% Black 5% Two or more races 5% Hispanic / Latino 5%
- Common ancestry
- Slovak 3% Iranian 2% Italian 1%
- Foreign-born
- 2% · Canada
- Languages at home
- 96% English-only · Spanish 3%
Political lean MEDSL · Walker
- 2024 margin
- Solid R (+59.3) · D 20.1% · R 79.4%
- 2008→2024 swing
- -12.5pp toward R · 2008: -46.8pp · 2024: -59.3pp
- All cycles
- 2024: R+59.3 2020: R+59.3 2016: R+61.5 2012: R+50.2 2008: R+46.8
Not yet ingested
- Civics
- —
Market trends
- HPI YoY
- ▼ -118.05%
- Current HPI
- 267.0047
- Rent YoY
- ▲ 7.44%
- Metro
- Chattanooga, TN-GA
- State GDP YoY
- ▲ 2.66%
- F500 in state
- 28
Industry mix (Fortune 500 HQ in GA)
| Industry | F500 HQs | Revenue |
|---|---|---|
| Paper / Packaging | 2 | $29B |
|
||
| Retail | 1 | $160B |
|
||
| Transportation / Logistics | 1 | $91B |
|
||
| Airlines | 1 | $62B |
|
||
| Consumer Goods | 1 | $47B |
|
||
| Utilities | 1 | $25B |
|
||
Price history
+93.4% since first listed28 events — show timeline
- 2026-06-15 Pending — GCAR
- 2026-06-09 Price Changed $154,500 GCAR
- 2026-05-09 Price Changed $171,500 GCAR
- 2026-04-21 Listed $201,700 GCAR
- 2024-04-30 Listing Removed — REALTRACS as Distributed by MLS Grid
- 2023-09-01 Pending — CCARMLS
- 2023-08-24 Delisted — CCARMLS
- 2023-06-16 Pending — CCARMLS
- 2023-06-16 Contingent — REALTRACS as Distributed by MLS Grid
- 2023-06-09 Listed $149,900 CCARMLS
- 2023-06-09 Listed $149,900 REALTRACS as Distributed by MLS Grid
- 2023-04-27 Price Changed $169,900 GCAR
- 2021-05-13 Sold (Public Records) $125,000 Public Records
- 2021-03-12 Sold (MLS) $125,000 GCAR
- 2021-01-22 Delisted — GCAR
- 2021-01-18 Relisted — GCAR
- 2021-01-11 Delisted — GCAR
- 2021-01-06 Relisted — GCAR
- 2020-12-21 Delisted — GCAR
- 2020-12-12 Relisted — GCAR
- 2020-12-08 Delisted — GCAR
- 2020-12-01 Price Changed $122,900 GCAR
- 2020-11-02 Price Changed $123,900 GCAR
- 2020-10-21 Relisted — GCAR
- 2020-10-19 Delisted — GCAR
- 2020-10-15 Listed $124,900 GCAR
- 2001-09-21 Sold (MLS) $75,500 GCAR
- 2001-03-21 Listed $79,900 GCAR
Property tax history
+8.6%/yrLatest (2025): $1,778 · +4.8% YoY. Source: county tax records.
Cash-flow waterfall
monthlySold comps — $/sqft
last 12 mo · ≤1 miLoading sold comps…